 Market States & Cycles
The stock market is constantly changing but the one constant throughout history is and will always be human nature. The stories, stocks, centuries, asset class, bubbles, busts, change… but people don’t! That is why it is important to understand market cycles not just from a technical level but from a psychological level as well. If you develop or use a strategy that controls your risk and is built around how markets actually work you will do well on Wall Street. The hard part for many people is having the discipline to stay true to their strategy and actually follow it in real-time.
3 Market States: Up, Down, or Sideways
To their detriment, people have a natural tendency to over-complicate most everything in life. Especially, difficult concepts that are not easily understood (e.g. Wall Street). At the most basic level there are only three directions any market or stock can move: Up, Down, or Sideways.
5 Market Cycles
Step 1 – Base
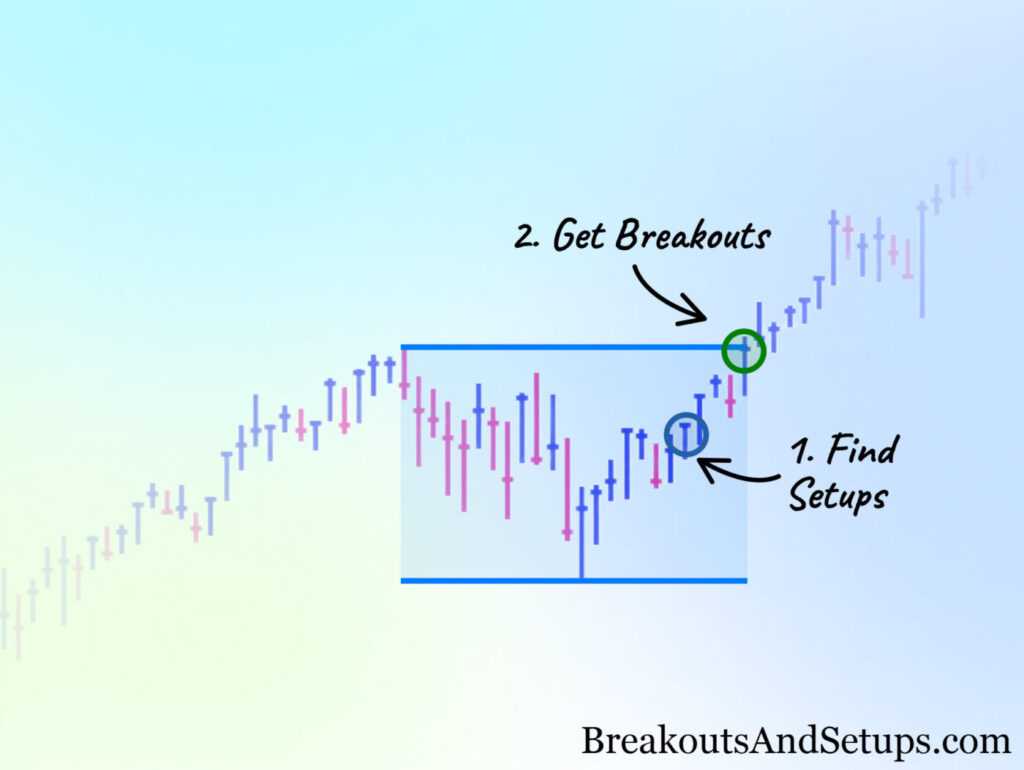
The first step before a trend begins is to see the market (or stock) build a base (move sideways). During the basing phase, the market is moving sideways between support and resistance. During the latter part of this phase, ideally the action will tighten up (almost like a coiled spring) and then at some point breakout above resistance (creating a new uptrend) or breakdown below support (creating a new downtrend).
Step 2 – Trend Begins
Ideally one would like to see the breakout occur on heavy volume which is a strong sign that large institutions are accumulating (buying) stock. Remember, it is important to note that price is primary and everything else (including volume) is secondary. Some people say you must have volume above X% in order for a proper signal to emerge but based on my research and experience, price is primary and volume criteria is secondary.
Step 3 – Normal Pullbacks
During the trend (up or down), it is very normal to see a breakout pullback and slightly fail initially (shake out the weak hands) then blast off again. Remember the market is counter-intuitive in nature and tends to fool most people, most of the time. The general crowd tends to miss the first few breakouts and tends to buy after the move becomes “too obvious.” The smart money does the opposite- buys early and sells into strength down the road.
Step 4 – More Basing & Too Obvious Factor
As the trend (up or down) builds- the states rotate from trending to sideways and back to trending again (several bases develop within a trend). This is normal and healthy action as the trend develops, matures and eventually ends. After the trend matures, most people who doubted the move are now buying into it (fear of missing out). Thus creating more momentum and eventually the move becomes obvious and shows up on most technical/charting blogs.
Step 5 – Trend Ends- Tops/Bottoms
Remember that all trends eventually end which means traders (not long-term investors) will need to sell their stocks at some point. After a big move, up or down, fear builds; the smart (a.k.a. early) money is getting out while the dumb (late) money is getting “in.” This creates sloppy wide-and-loose action (after a big move) and typically suggests a top or bottom is close to (or in the process of) forming.
Rinse, Wash, Repeat- New Trends Begin
Once a top is completed (sideways action after a long uptrend) support is broken off that sideways consolidation and a new downtrend begins (go back to phase 1). The same is true after a long downtrend. The market bottoms and a new uptrend eventually forms. Keep this mind as you buy and sell stocks. Ask yourself am I late or early? What state is the market in (up, down, or sideways) and what phase of the cycle are we in.


