

[su_heading style=”modern-2-dark” size=”20″] Market Update [/su_heading]
Stocks Fall As Earnings Season Begins
Stocks rallied last week as investors digested the latest round of largely lackluster economic and earnings data. The big winners (so far) from earnings season include: Amazon.com ($AMZN), Netflix ($NFLX), Hasbro ($HAS), Domino’s Pizza ($DPZ), Sketchers ($SKX), Dunkin (Donuts) Brands Group ($DNKN), Google Inc ($GOOG), Microsoft Corp ($MSFT), O’Reilly Automotive ($ORLY), and YUM Brands ($YUM). On the downside: Texas Instruments ($TXN), Travelers ($TRV), 3M ($MMM), Chipotle ($CMG), Pulte Group ($PHM), Biogen Inc ($BIIB), and American Express ($AXP), just to name a few. We mention this because history shows us that some of the market’s strongest performers occur from big gaps up on earnings and some of the weakest stocks gap down after reporting numbers. Separately, it is important to note that so far, the major averages continue to grind higher which suggests the bulls still remain in control – for now.
[su_heading style=”modern-2-dark” size=”20″] Portfolio Update [/su_heading]
Thankfully, the FLS portfolio is doing well. FLS locked in a nice 11% gain last week in MTH, even with the gap down. We have decent exposure in the market right now and would like to see how stocks react next week as we digest the next round of earnings news before adding exposure. Ideally, our current holdings will increase nicely in value and that will give us a nice cushion.
[su_heading style=”modern-1-dark” size=”18″] Positions [/su_heading]
- The service owns: TSLA +6.71%, HACK +5.82%, SPY +2.26%, IBB +2.99%, GDX -3.59%, AAPL -0.08%, FB -0.83%
- The service will exit: TSLA @ 193.97, HACK @ 27.49, SPY @ 203.87, IBB @ 333.57, GDX @ 19.24, AAPL @125.66, FB @ 78.42
[su_heading style=”modern-1-dark” size=”18″] Working Buy Orders [/su_heading]
There are no new working orders today
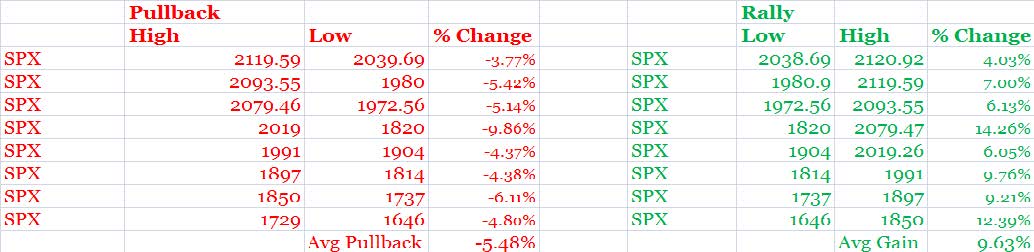
[su_heading style=”modern-2-dark” size=”20″] Analyzing The S&P 500’s Latest Moves (Up & Down) [/su_heading]
Nearly every pullback has been shallow in both size (small percent decline) and scope (short in duration) which is
bullish for this ongoing and very powerful rally.
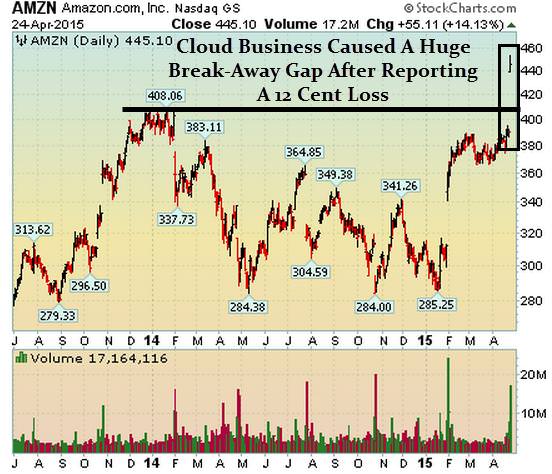
[su_heading style=”modern-2-dark” size=”20″] Chart of the Week [/su_heading]
Amazon.com Surged 14% After Reporting A 12 Cent Loss Last Qtr. The Big Story Was From Their “Cloud” Business. The Company Believes That One Day It Might Be Worth More Than Its Retail Business- Which is Huge!
[su_heading style=”modern-2-dark” size=”20″] 2015 Scorecard [/su_heading]
Nasdaq Comp +7.0% YTD, Russell 2k +5% YTD, S&P 500 +2.8%, DJ Industrials +1.4%
[su_heading style=”modern-1-dark” size=”18″] Key Points [/su_heading]
Uptrend: Short-Term, Intermediate & Long Term Remain Strong
SPX Support = 2039, 1980, 1972, 1904, 1820
SPX Resistance = 2119.59
Sarhan’s Crowd Behavior Index: Bullish
(Proprietary market indicator that measures crowd sentiment: Bullish Bearish or Neutral)
[su_heading style=”modern-1-dark” size=”18″] Global Macro Update [/su_heading]
[su_row]
[su_column size=”1/2″]
Stocks: Uptrend
Bonds: Uptrend
Currencies (Euro/USD): Sideways
Softs: Downtrend
[/su_column]
[su_column size=”1/2″]
Energy: Uptrend
Metals: Sideways
Grains: Downtrend
[/su_column]
[/su_row]


