[su_heading style=”modern-2-dark” size=”20″] Market Update [/su_heading]
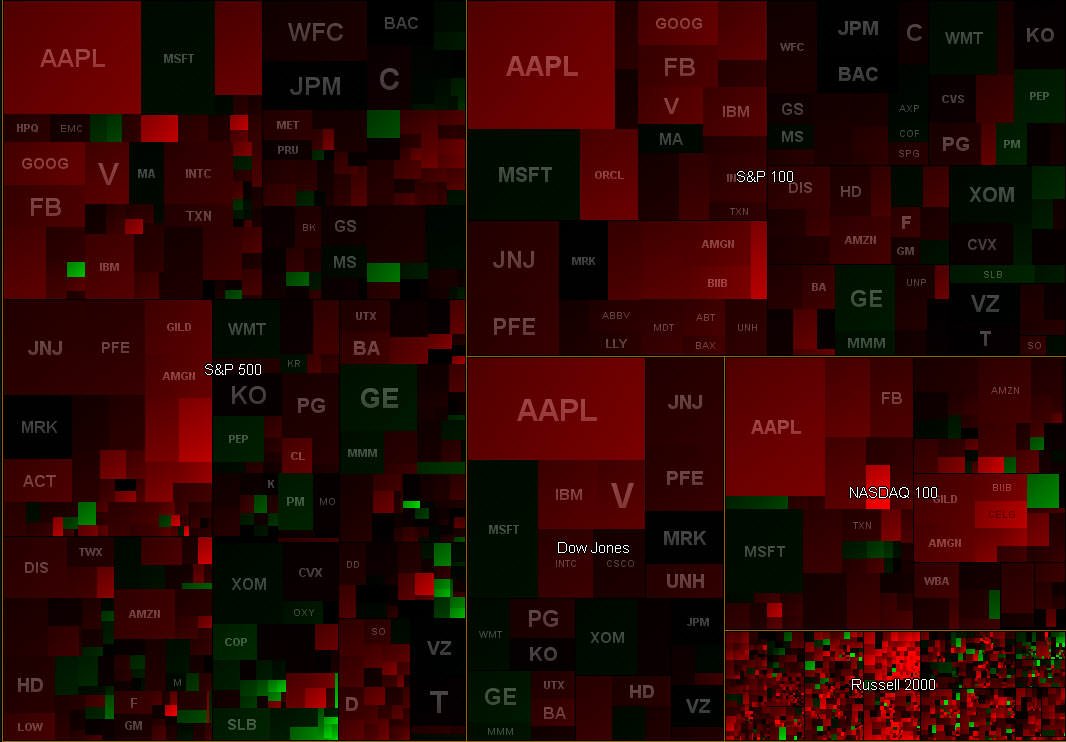
The major averages continue to drift lower as the technical damage underneath the surface gets worse. Barring some large unforeseen move before the close, the Major averages are on track to end mixed for the month: The Dow Industrials, S&P 500, Nasdaq Comp, Nasdaq 100 and NYSE Comp are all higher for April while the small-cap Russell 2000 and the Dow Transports are lower in April. It is also important to note that the Russell 2000 sliced below support 50 DMA line for the first time since Feb 2015 which is not ideal. As mentioned in Tuesday’s intra-week update, one of the strongest areas of the market, the biotech ($IBB) and Healthcare ($XLV) ETF’s both broke below their respective 50 DMA lines which is not healthy. Meanwhile, the great mini rotation we have talked about for years continues to keep the major averages near their respective highs. Most recently, the biotechs and healthcare stocks got in trouble, and almost immediately, capital “rotated” into the beaten down areas like the commodities (mainly energy) and other “stuff” areas of the market. To be clear, this is very sloppy action and eventually it will end badly (once the market stops reacting to all the interference from global central banks). I attached a screenshot of my intra-day screen so you can see for yourself how “red” things are today. At this point, we want to exercise caution as the market sorts itself out. As always, we will have a full report for you this weekend.
[su_heading style=”modern-1-dark” size=”18″] Positions [/su_heading]
Thankfully, the FLS portfolio continues acting well. On Tuesday, to protect our positions, we tightened our stops to protect from this selloff. Earlier today, the service was stopped out of AAPL for a small -3.62% loss. If the selling continues we will be out and comfortable. Here is a snapshot of the FLS portfolio as of 2:15pm EST:
- The service owns: TSLA +11.55%, HACK +3.74%, SPY +1.05%, GDX +0.55%, IBB -3.73%, FB – 3.73%
- The service will exit: TSLA @ 204.69, HACK @ 28.85, SPY @ 206.98, IBB @ 333.57, GDX @ 19.24,
FB @ 78.42
[su_heading style=”modern-1-dark” size=”18″] Working Buy Orders [/su_heading]
There Are No New Buy Orders