

[su_heading style=”modern-2-dark” size=”20″] Market Update [/su_heading]
Bulls Not Going Down Without A Fight
After all was said and done, underneath the surface, it wasn’t a pretty week on Wall Street even though the major averages held up better. On Monday, the benchmark S&P 500 hit a new high for the year, then turned lower after several key areas of the market began to fall out of bed. Social media stocks were smacked hard last week after several key companies lowered guidance. The Fed met last week but didn’t say much as they removed all calendar references from their after market commentary and remain data-dependent. So far, the data remains lackluster at best which lowers the odds of a rate hike in the near future. The big winners (so far) from earnings season include: Amazon.com ($AMZN), Netflix ($NFLX), Hasbro ($HAS), Domino’s Pizza ($DPZ), Sketchers ($SKX), Dunkin (Donuts) Brands Group ($DNKN), Microsoft Corp ($MSFT), O’Reilly Automotive ($ORLY), and YUM Brands ($YUM), Skywest ($SKYW), Web.com ($WWWW), Equinix ($EQIX), Styngenta ($SYT), Nutri System ($NTRI), Brink’s Co ($BCO), Teradyne Inc ($TER), Skyworks Solutions ($SWKS), GoPro ($GPRO).
On the downside: Twitter ($TWTR), Yelp ($YELP), LinkedIn ($LNKD), Constant Contact (CTCT), Accuray ($ARAY), Cooper Tire & Rubber ($CTB), Abaxis ($ABAX), Texas Instruments ($TXN), Buffalo Wild Wings ($BWLD), Baidu Inc. ($BIDU), Stratasys ($SSYS), Harman ($HAR), Nokia ($NOK), Travelers ($TRV), 3M ($MMM), Chipotle ($CMG), Pulte Group ($PHM), Biogen Inc ($BIIB), Generac Holdings ($GNRC), First Solar ($FSLR) and American Express ($AXP), just to name a few. We mention this because history shows us that some of the market’s strongest performers occur from big gaps up on earnings and some of the weakest stocks gap down after reporting numbers. Even though we saw some distribution (selling) last week, it is important to note that on Monday, the major averages hit new highs (record highs and 2000 highs for the Nasdaq), and the broader trend remains higher – for now. In the short term, the long range-bound action we have seen most of the year remains in place.
[su_heading style=”modern-2-dark” size=”20″] Portfolio Update [/su_heading]
Thankfully, FLS has navigated this latest pullback with grace and did not get caught with any big gap downs (and there were many this earnings season). If the market moves higher from here, FLS will slowly add more stocks to the portfolio. If not, we will respect our stops and move out of the way (if conditions deteriorate further). Until then, we are long and comfortable.
[su_heading style=”modern-1-dark” size=”18″] Positions [/su_heading]
- The service owns: TSLA +10.43%, HACK +4.30%, SPY +1.81%, GDX +0.95%
- The service will exit: TSLA @ 204.69, HACK @ 28.85, SPY @ 206.98, GDX @ 19.24
[su_heading style=”modern-1-dark” size=”18″] Working Buy Orders [/su_heading]
[su_table]
| Status | Order | Ticker | Buy Stop | Protective Sell Stop | Risk from Entry |
| Working | Buy | NFLX | 576.13 | 551.97 | 4.19% |
| Working | Buy | SWKS | 100.58 | 94.57 | 5.98% |
| Working | Buy | AAPL | 130 | 121.62 | 6.45% |
[/su_table]
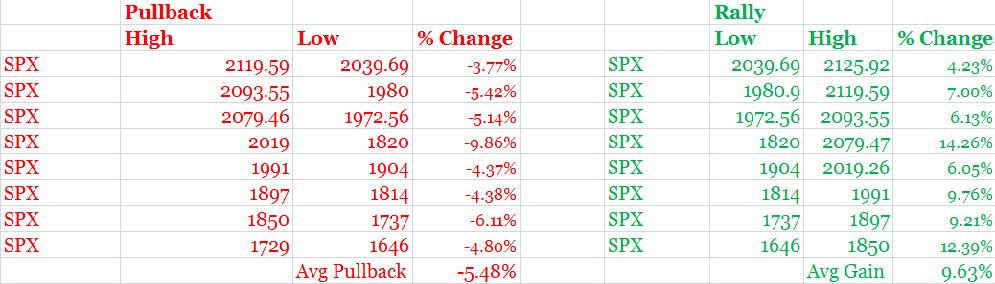
[su_heading style=”modern-2-dark” size=”20″] Analyzing The S&P 500’s Latest Moves (Up & Down) [/su_heading]
Nearly every pullback has been shallow in both size (small percent decline) and scope (short in duration) which is bullish for this ongoing and very powerful rally.
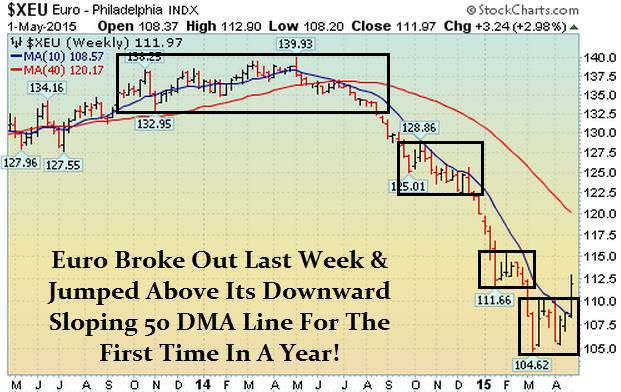
[su_heading style=”modern-2-dark” size=”20″] Chart of the Week [/su_heading]
The Euro Is Trying To Bottom…
[su_heading style=”modern-2-dark” size=”20″] 2015 Scorecard [/su_heading]
Nasdaq Comp +5.7% YTD, S&P 500 +2.4%, Russell 2k +1.9% YTD, DJ Industrials +1.1%
[su_heading style=”modern-1-dark” size=”18″] Key Points [/su_heading]
- Uptrend: Short-Term, Intermediate & Long Term Remain Strong
- SPX Support = 2039, 1980, 1972, 1904, 1820
- SPX Resistance = 2126
- Sarhan’s Crowd Behavior Index: Bullish
(Proprietary market indicator that measures crowd sentiment: Bullish Bearish or Neutral)
[su_heading style=”modern-1-dark” size=”18″] Global Macro Update [/su_heading]
[su_row]
[su_column size=”1/2″]
- Stocks: Uptrend
- Bonds: Looks Toppy
- Currencies (Euro/USD): Trying To Bottom
- Softs: Downtrend
[/su_column]
[su_column size=”1/2″]
- Energy: Uptrend
- Metals: Sideways
- Grains: Downtrend
[/su_column]
[/su_row]


