


[su_spoiler title=”Monday-Wednesday’s Action: Buyers Showed Up On Wed” style=”fancy”]
Stocks slid on Monday as investors waited for Apple’s latest developer conference. The tech giant announced a few new changes and items to their roster, namely Apple Music which allows people to stream their music. U.S. stocks edged lower after Friday’s jobs report topped estimates which increased the odds of a Fed rate hike in the near future. The DAX, Germany’s stock market, fell into correction territory defined by a decline of 10% or more from a recent high. Chinese imports and exports fell which is a drag on the global economy. China’s exports slid by -2.5% in May from a year earlier in dollar terms, while imports tanked by a whopping -17.6%, leaving a trade surplus of $59.49 billion. The report showed that the U.S. contributed +18.8% to total exports which is the most since August 2010. The DJIA turned negative for the year which is not ideal. Stocks fell on Tuesday after weak economic data was announced from China. China said consumer inflation fell by 1.2% year on year in May which was below the Street’s estimate and increases concerns that deflation is more of a threat than inflation as their economy softens. China said producer prices fell for the 38th consecutive month which is not ideal. Wholesale inventories rose by +0.4% in April, above expectations of a +0.2% rise. The National Federation of Independent Business said U.S. small business confidence rose to a five-month high in May of 98.3, the highest since December. The S&P 500 fell to its 150 DMA line. Stocks surged on Wednesday helping the Dow Industrials, S&P 500, and the Nasdaq 100 all jump back above their respective 50 DMA lines as a slew of stocks bounced from oversold levels. The market rallied all morning and extended their gains after Bloomberg reported that Germany will offer Greek Prime Minister Alexis Tsipras aid in return for his commitment to one economic reform. A government spokesman told Reuters that Germany will only accept a deal between Athens and its creditors if all three major lending operations approved the deal. Latest headlines aside, the bulls showed up and bought the “dip.” Weekly mortgage applications jumped 8.4% as buyers continue to do what they can to lock in low rates ahead of a potential rate hike later this year.
[/su_spoiler]
[su_spoiler title=”Thursday-Friday’s Action: Stocks Slide Ahead of Wkend” style=”fancy”]
Stocks were quiet on Thursday after the IMF put more pressure on the ongoing Greek drama. Retail sales rose +1.2%, beating estimates for a 1.1% gain. Ex-autos, retail sales rose 1%, beating estimates for a gain of 0.7%. Weekly jobless claims came in at 279k, slightly above expectations. April business inventories rose 0.4%, the largest gain in nearly a year. Retail inventories excluding autos, which go into the calculation of GDP, rose a solid +0.6% in April. Separately, the Atlanta Fed raised its GDP model forecast for real GDP growth in the second quarter to 1.9%, up from its earlier estimates of 1.1%. Separately, New Zealand’s Central Bank surprised the world and cut rates to help stimulate their economy. In 2014, they began raising rates but were forced to cut them because their economy is not strong enough to stand on its own two feet. This serves as an important example for the U.S. Fed who is contemplating raising rates later this year. Stocks opened lower on Friday after the ongoing saga continued in Greece and U.S. producer prices topped estimates. The Producer Price Index rose +0.5% in May, topping estimates for a 0.4% gain. The gain was the largest since May 2012. Core prices, which excludes food and energy, rose 0.1%, beating estimates for a -0.2%.
[/su_spoiler]
[su_spoiler title=”Market Outlook: The Central Bank Put Is Alive And Well” style=”fancy”]
Remember, in bull markets surprises happen to the upside. This has been our primary thesis since the end of 2012. We would be remiss not to note that this very strong bull market is aging (celebrated its 6th anniversary in March 2015) and the last two major bull markets ended shortly after their 5th anniversary; 1994-2000 & 2002-Oct 2007). To be clear, the central bank put is very strong and until material damage occurs, the stock market deserves the longer-term bullish benefit of the doubt. As always, keep your losses small and never argue with the tape.
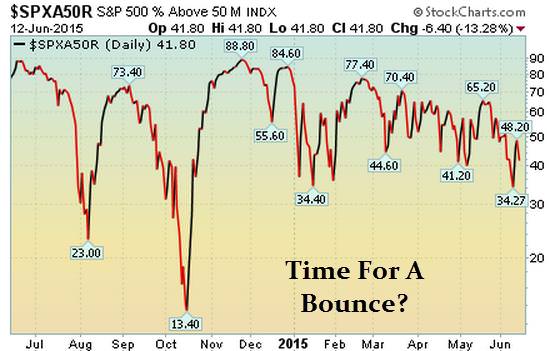
41.8% Of Stocks in the S&P 500 Are Above Their Respective 50 DMA
(Market Tends To Turn When This Reading Gets Above 70% or Below 40%)
Observation: Readings above 70% usually (not always) correspond with a short-term pullback Conversely, reads below 40% usually (not always) correspond with a short-term bounce
[/su_spoiler]
[su_spoiler title=”Big Stock List” style=”fancy”]
- AAPL – Fell for 3rd straight week and broke below its 50 DMA line
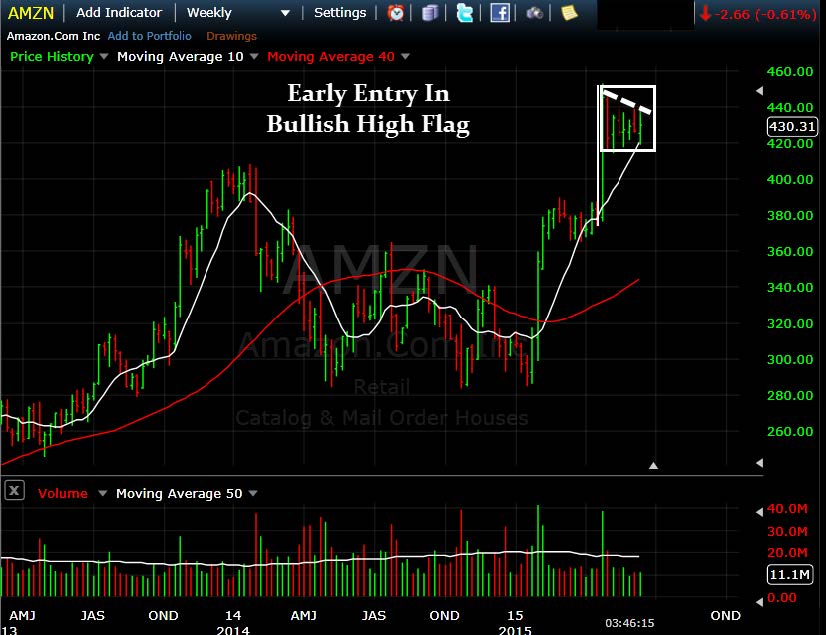
- AMZN – Rallied last week after bouncing off its 50 DMA line. Continues forming BULLISH 8-wk base
- EA – Near perfect pullback and subsequent bounce off its 10 week moving average (~50 DMA)
- FB – Relatively unchanged for the week but closed above 50 DMA line
- FLT – STRONG rally last week as it jumped back above its 50 MDA line
- GOOGL – Fell last week as it continues to trade just below its 50 and 200 DMA lines
- ILMN – Nice rally for 7th straight week as it jumps to a fresh record high
- NFLX – 7th straight weekly gain. Very extended and way overdue for a pullback
- SBUX – Big positive reversal on a weekly basis and jumped to new high last week
- TSLA – Closed in lower half of its range last week
- UA – Closed in upper half of the range for the week and above its 50 DMA line
- V – Strong rally last week after bulls showed up and defended 50 DMA line
[/su_spoiler]
[su_spoiler title=”17 New Setups” style=”fancy”]
These hand-picked stocks are carefully selected to help with your idea generation and offer you additional setups each week. The setups are based on our proprietary criteria and offer advanced (dotted line) & classic long and short entry points (solid line). Short patterns are typically mirror images of long patterns.
Note: Please Verify All Earnings Dates/Data from Multiple Sources for Every Stock in all our report(s).
Charts Courtesy of FreeStockCharts.com and/or Stockcharts.com
AMZN Working Order & Setup:
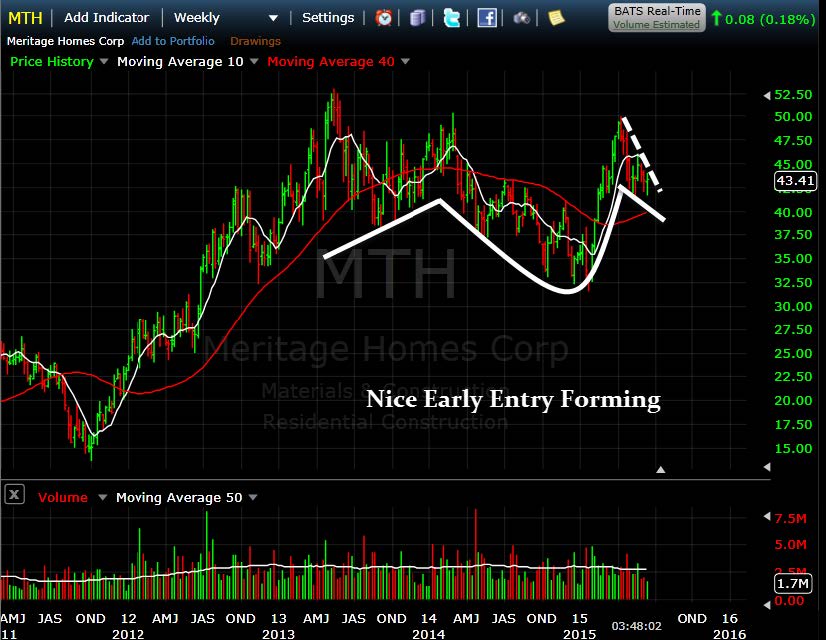
MTH Working Order & Setup: New Early Entry Forming
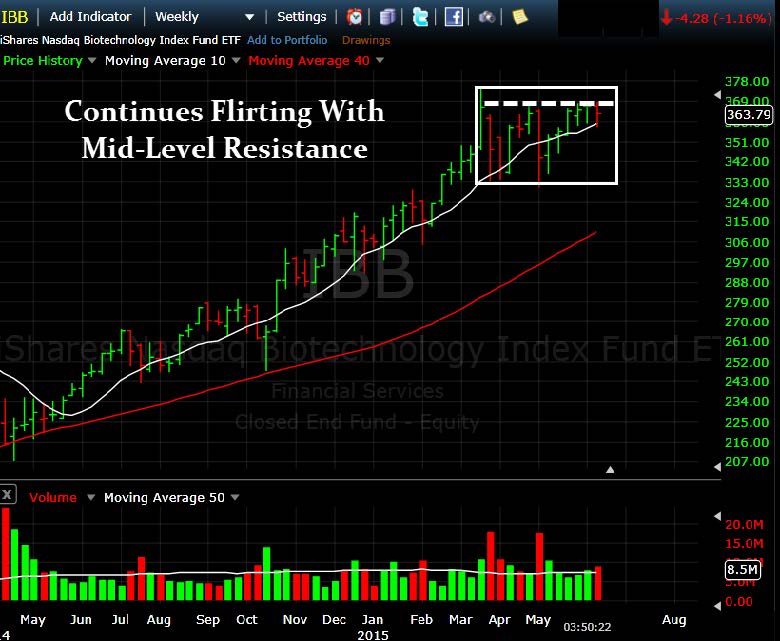
IBB Setup: Continues Flirting Resistance
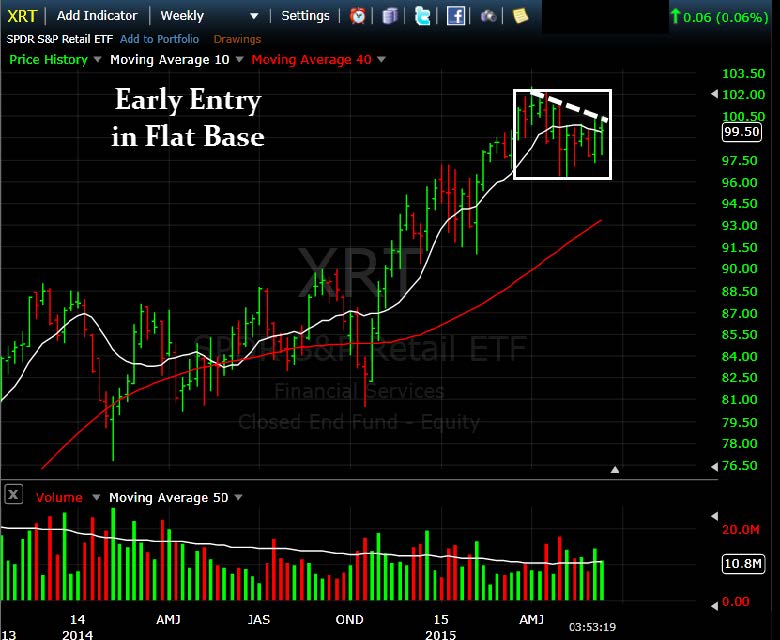
XRT Setup: Early Entry In Flat Base
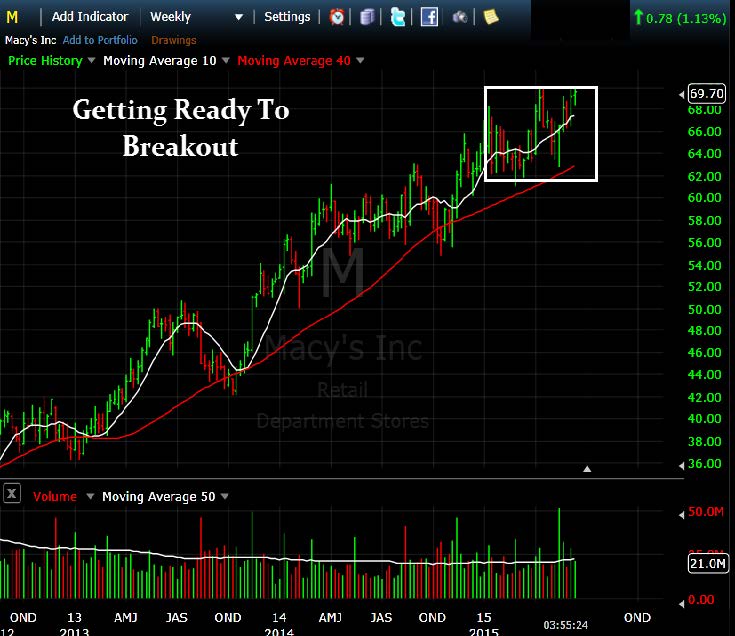
M Setup: Flirting With Resistance
BX Setup: Nice Early Entry Forming

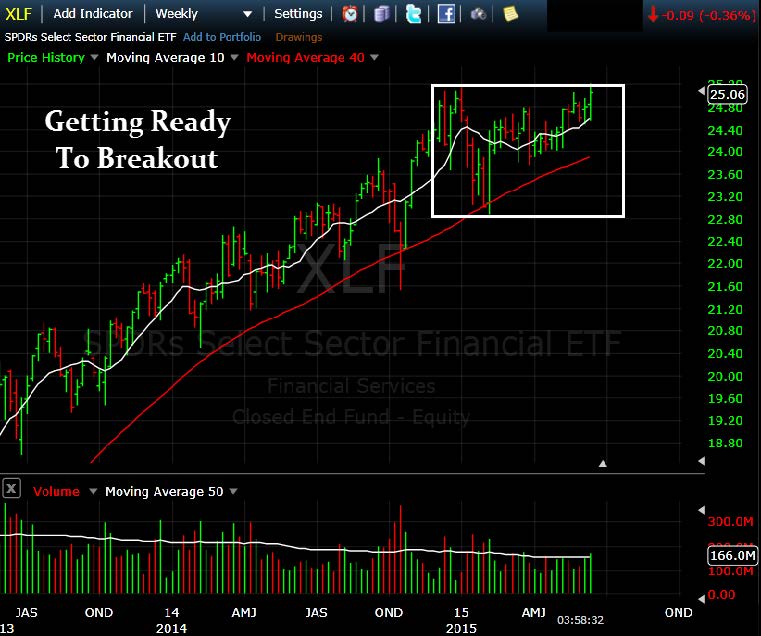
XLF Setup: Getting Ready To Breakout
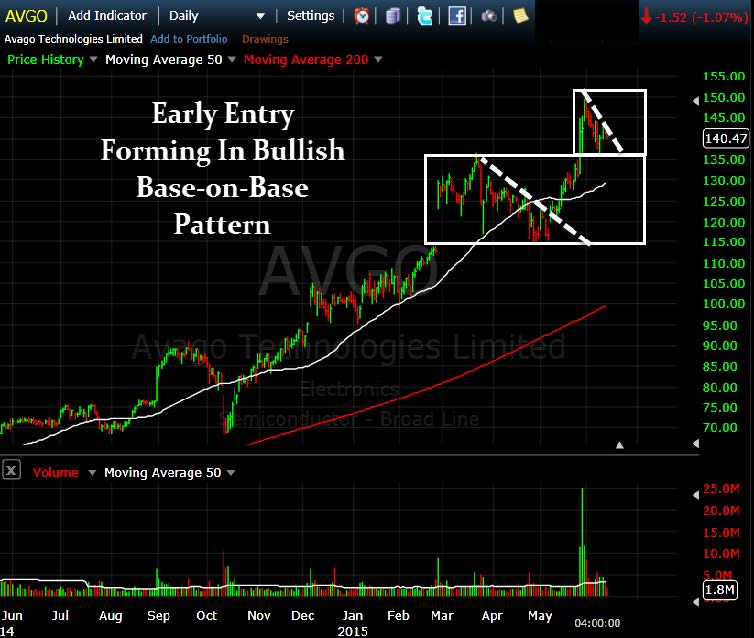
AVGO Setup: Early Entry Forming In Bullish-Base-on-Base Pattern
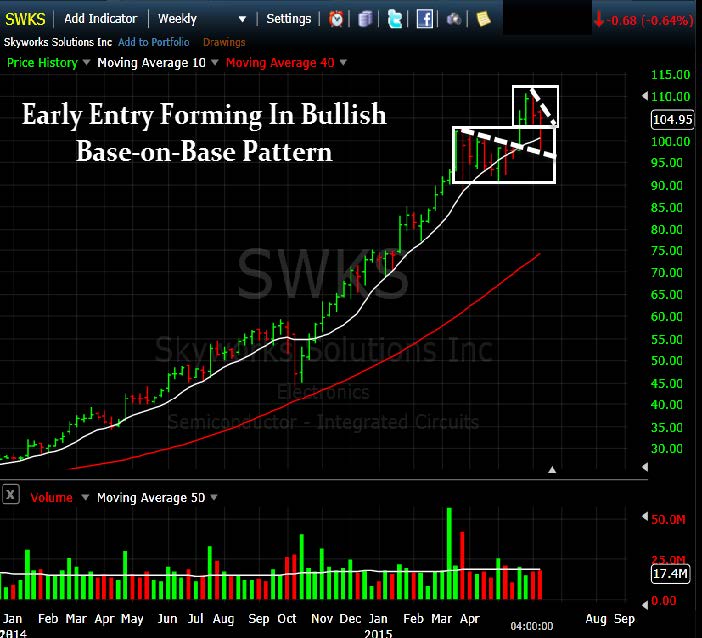
SWKS Setup – Early Entry In Bullish Base-on-Base Pattern
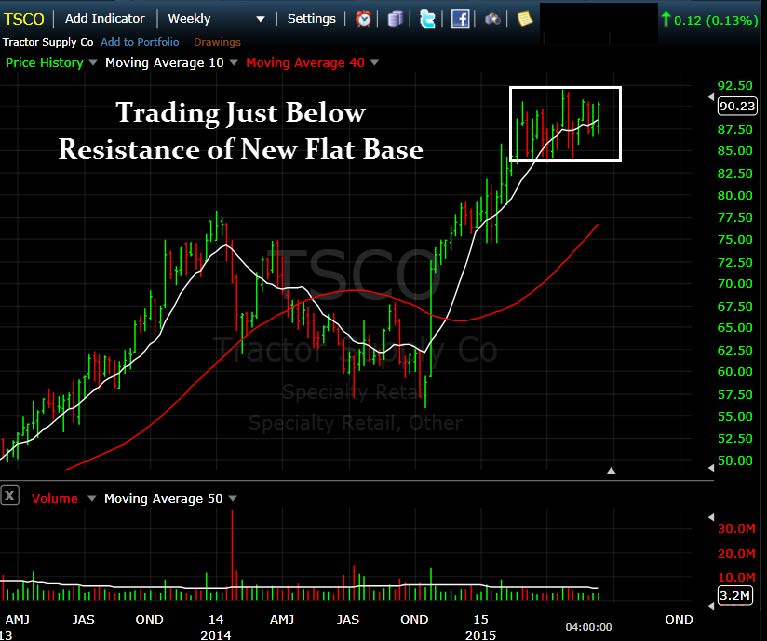
TSCO: Trading Just Below Resistance of New Flat Base
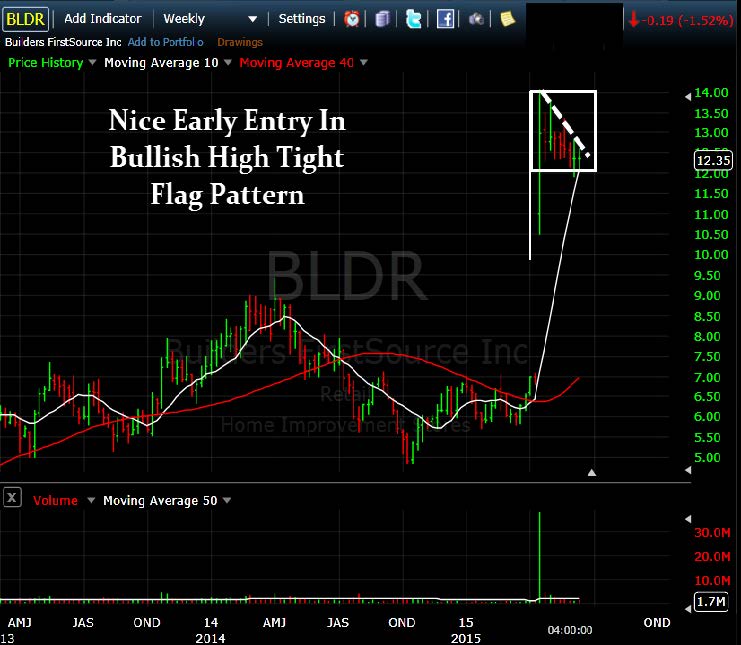
BLDR Setup – Early Entry Forming In Bullish High Tight Flag Pattern
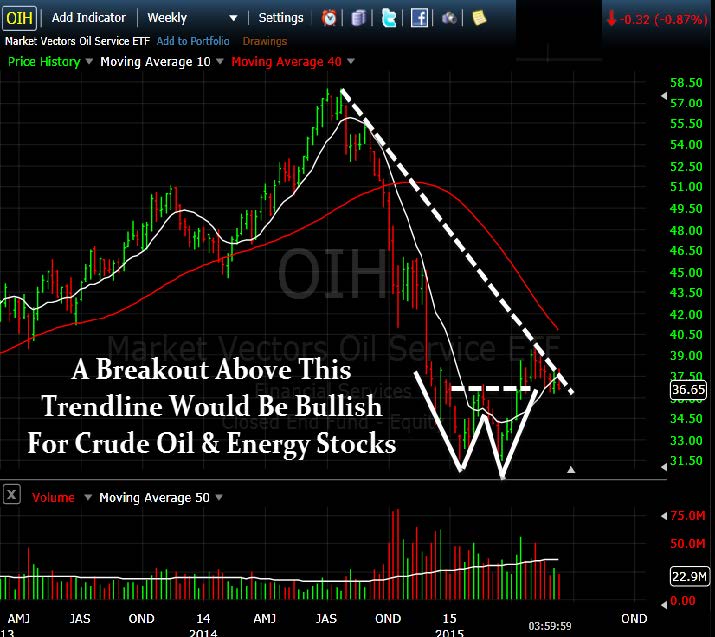
OIH Setup: Early Entry Forming In Oil & Oil Stocks
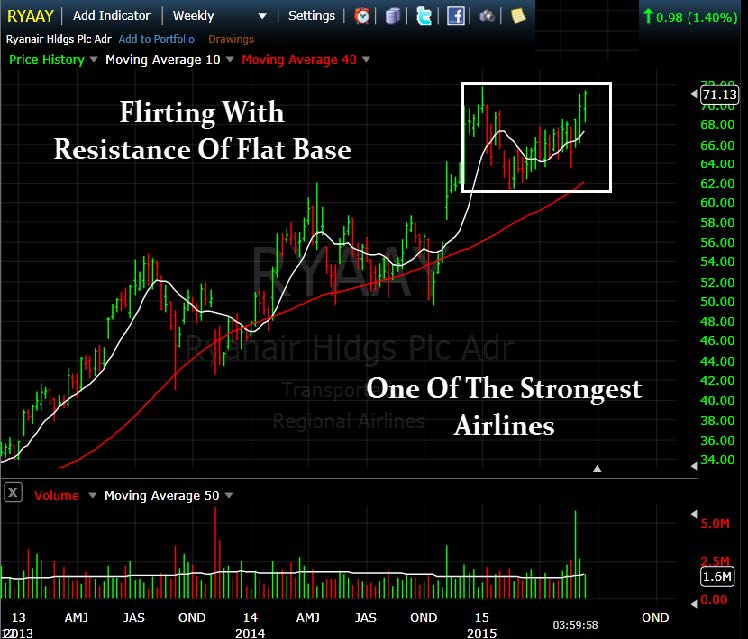
RYAAY Setup – Nice Early Entry Forming
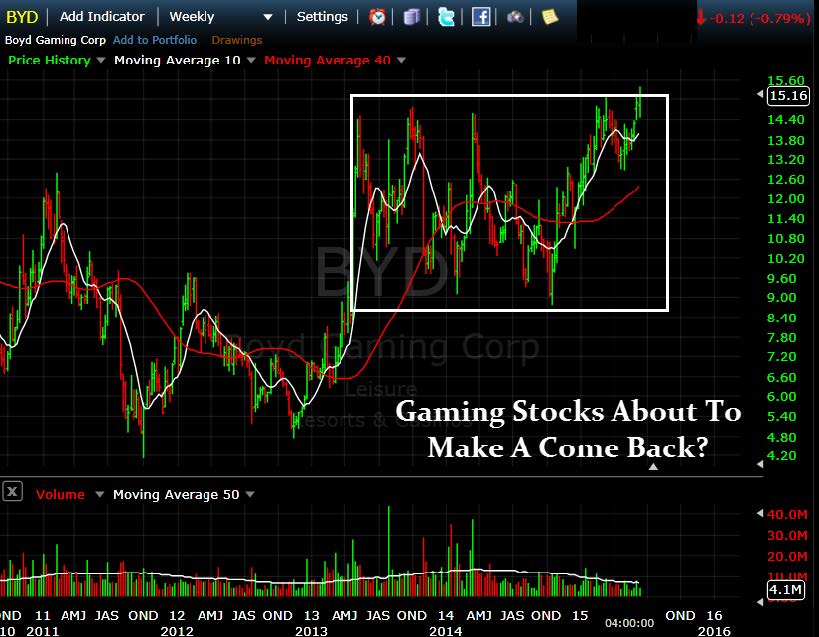
BYD: Big Base Breakout…First Gaming Stock To Breakout
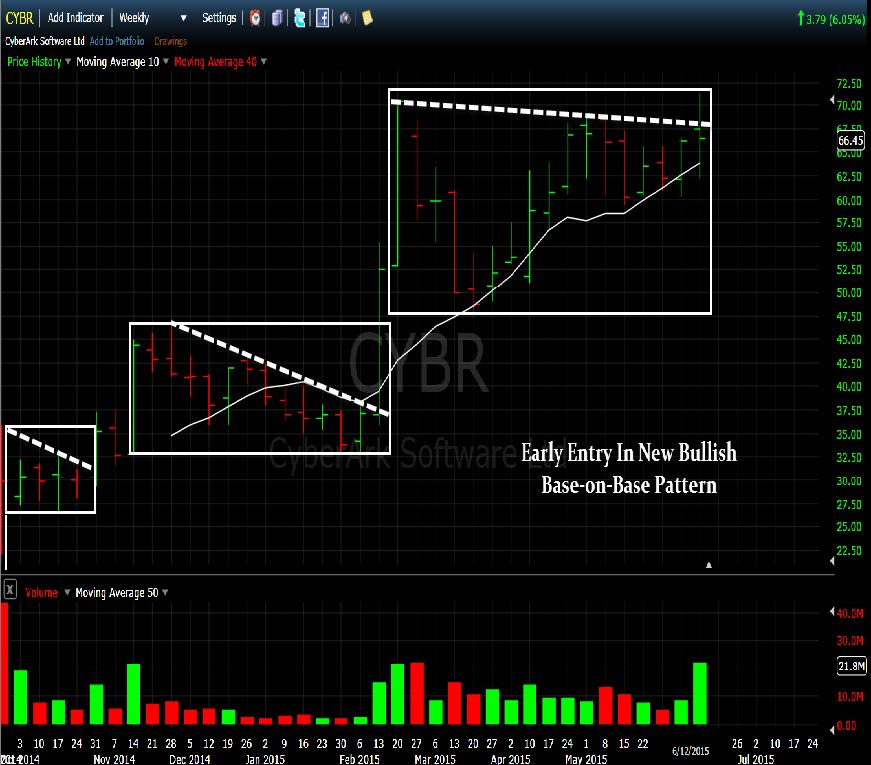
CYBR: New Early Entry In Bullish Base-on-Base Pattern
GLUU: New Early Entry Forming In Bullish High Tight Flag

DYAX: Early Entry Forming In Bullish High Tight Flag

[image]
[/su_spoiler]
[su_spoiler title=”Strongest Sectors, Groups, & Symbols” style=”fancy”]
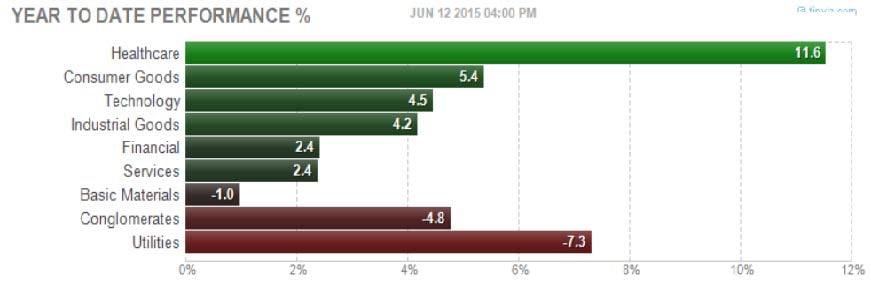
[su_heading style=”modern-1-dark” size=”18″]Strongest Sectors [/su_heading]
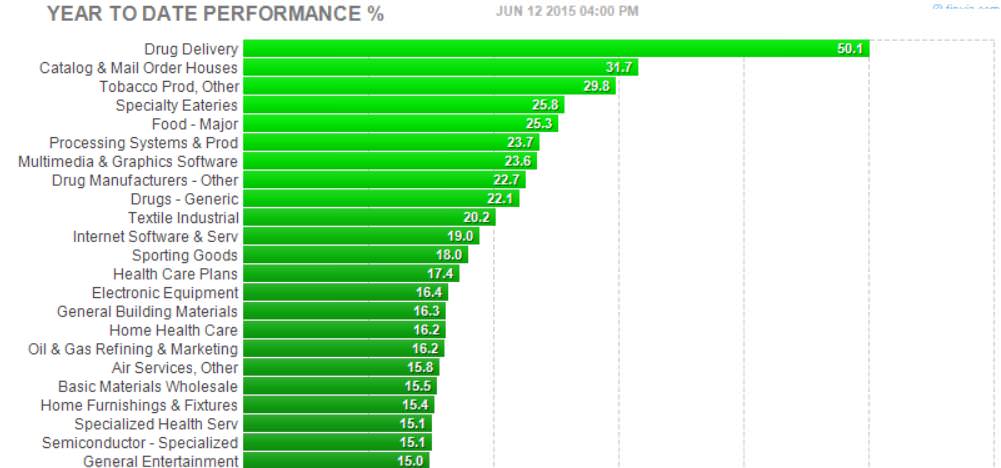
[su_heading style=”modern-1-dark” size=”18″]Strongest Groups [/su_heading]
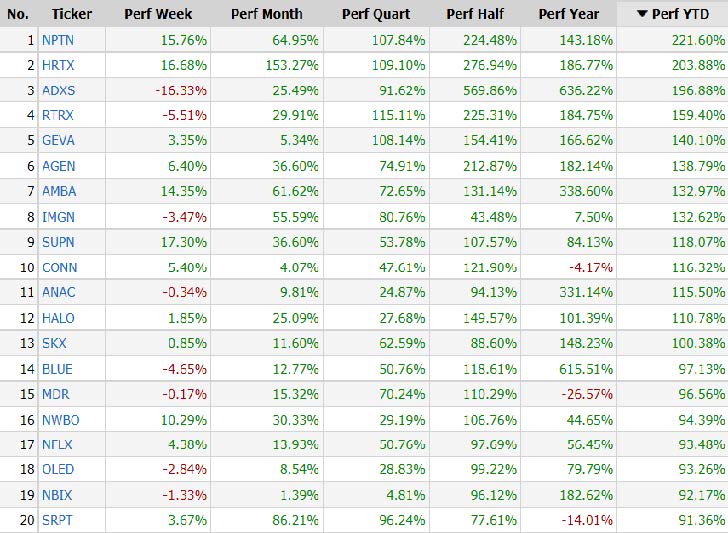
[su_heading style=”modern-1-dark” size=”18″]Strongest Stocks of the Year [/su_heading]
These are the top 20 strongest performing tickers on a year-to-date basis that are trading over $5, average daily volume over 500k and have a market cap >300M (Small cap-Mega Cap)
[/su_spoiler]


