

[su_spoiler title=”Monday-Wednesday’s Action: Stocks Plunge On Greek Woes” style=”fancy”]
Stocks fell hard across the globe on Monday after Greece said it will default on its debt and shut its banking system for the week. Over the weekend, Greece said they will impose capital controls – which means they are closing their banks for the week, limiting the amount of money people may withdraw from an ATM to 60 euros a day and shut their stock market on Monday. Greece’s Prime Minister issued a referendum to his people for July 5 to vote Yes or No to stay in the Eurozone. These are unprecedented measures for a developed nation and I can’t remember a time in modern history where a major developed country shut their banking system for an entire week! Late Monday, S&P rating agency cut Greece’s debt further into junk territory as the country approached default. In other debt/default related news, Puerto Rico said it may default on their debt as well. The VIX (volatility index) soared over 30% as fear picked up and stocks plunged. Over the weekend, China’s central bank cut its reserve requirement to help stimulate their economy. Chinese stocks officially entered a bear market (defined by a decline of 20% or more from a recent high) on Monday. In the U.S. pending home sales rose +0.9%, hitting the highest level in 9 years, missing estimates for a gain of +1.2%. The Dallas Fed Manufacturing Survey slid to -7, beating estimates for -13.5. On Tuesday the bulls showed up and defended the longer term 200 DMA line for the S&P 500 and the Dow Jones Industrial Average after optimism spread that a deal may get done in Greece. Later that day Greece officially defaulted on its 1.7B payment to the IMF making it the first developed nation to default in modern history. Economic data in the US was mixed, the Case-Shiller index slowed sharply to up +0.3%, missing estimates for a gain of 0.8%. The Chicago PMI remains sluggish and came in at 49.4, missing estimates for 50.6. Consumer confidence rose to 101.4 in June, beating estimates for 97.4.
Stocks rallied on Wednesday after news spread that Greece may accept new terms for a bailout and several Greek officials publicly urged the country to vote YES and stay in the Eurozone. Before the open, the ADP employment report showed private employers added 237k new jobs in June, beating estimates for 220k. The PMI manufacturing index came in at 53.6, barely missing estimates for 53.7. The ISM manufacturing index came in at 53.5, barely beating estimates for 53.2. Construction spending rose to 0.8%, beating estimates for 0.5%.
[/su_spoiler]
[su_spoiler title=”Thursday-Friday’s Action: Stocks Under Pressure As Greek Drama Continues” style=”fancy”]
Stocks fell on Thursday after the government said U.S. employers added 223k new jobs last month missing estimates for 233k and the situation in Greece remained front and center. The International Monetary Fund warned that Greece’s would need an extension of its European Union loans and a larger debt writeoff if growth slows more than expected and economic reforms are not implemented. Greece’s banking system has been shut down all week which adversely affects their economy and raises chances of continued economic and social duress. The IMF added that Athens needs about 51.9 billion euros between October 2015 and December 2018 which is not an insignificant sum. Factory orders fell 1%, missing estimates for -0.3%. Sweden’s central bank lowered its main interest rate to -0.35% from -0.25% to hold down its currency. Stocks in the U.S. were closed on Friday in observance of the July 4th holiday.
[/su_spoiler]
[su_spoiler title=”Market Outlook: The Central Bank Put Is Alive And Well” style=”fancy”]
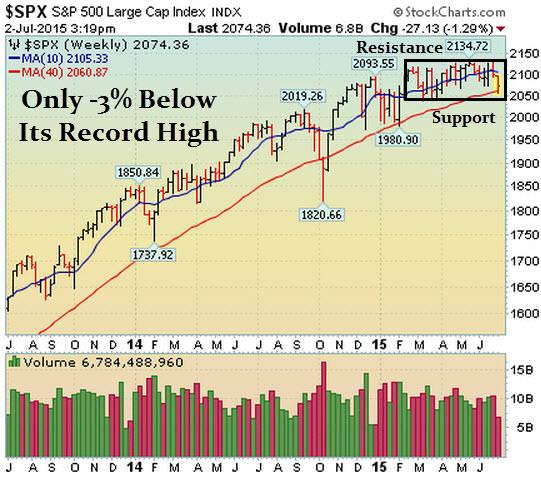
Remember, in bull markets surprises happen to the upside. This has been our primary thesis since the end of 2012. We would be remiss not to note that this very strong bull market is aging (celebrated its 6th anniversary in March 2015) and the last two major bull markets ended shortly after their 5th anniversary; 1994-2000 & 2002-Oct 2007). To be clear, the central bank put is very strong and until material damage occurs, the stock market deserves the longer-term bullish benefit of the doubt. As always, keep your losses small and never argue with the tape.
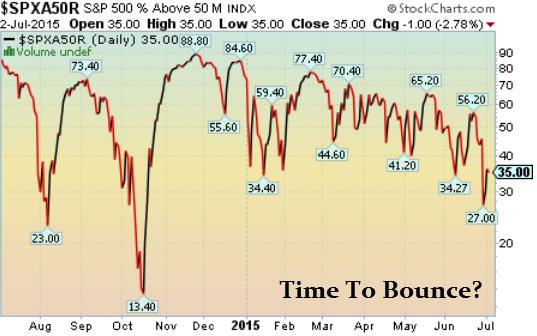
35% Of Stocks in the S&P 500 Are Above Their Respective 50 DMA
(Market Tends To Turn When This Reading Gets Above 70% or Below 40%)
Observation: Readings above 70% usually (not always) correspond with a short-term pullback
Conversely, reads below 40% usually (not always) correspond with a short-term bounce
[/su_spoiler]
[su_spoiler title=”Big Stock List” style=”fancy”]
- AAPL – Fell last week but closed near its highs for the week. Still in the middle of large 5 month base
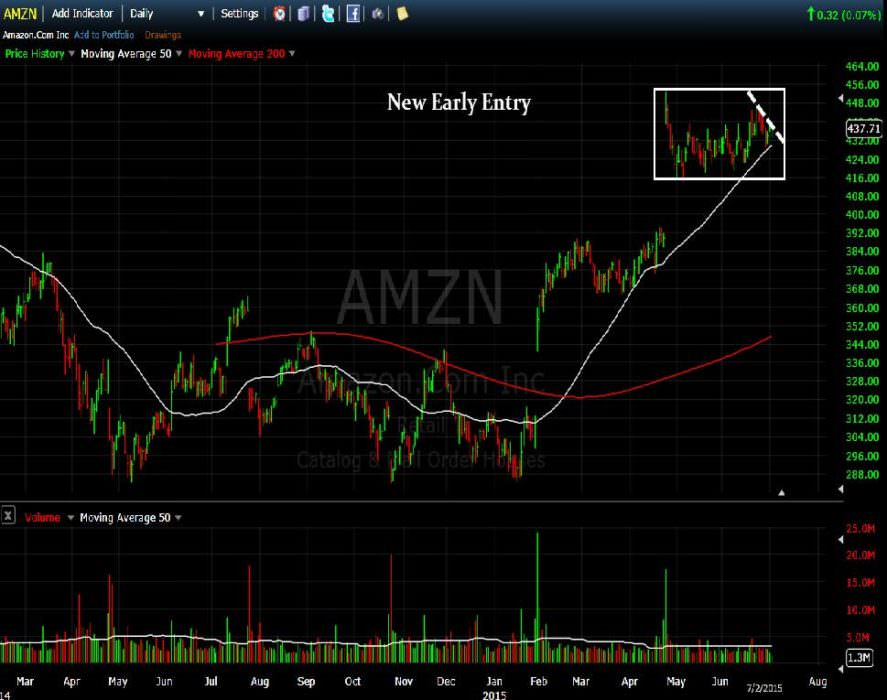
- AMZN – Ended lower last week but near its highs for the week after bouncing off support (50dma)
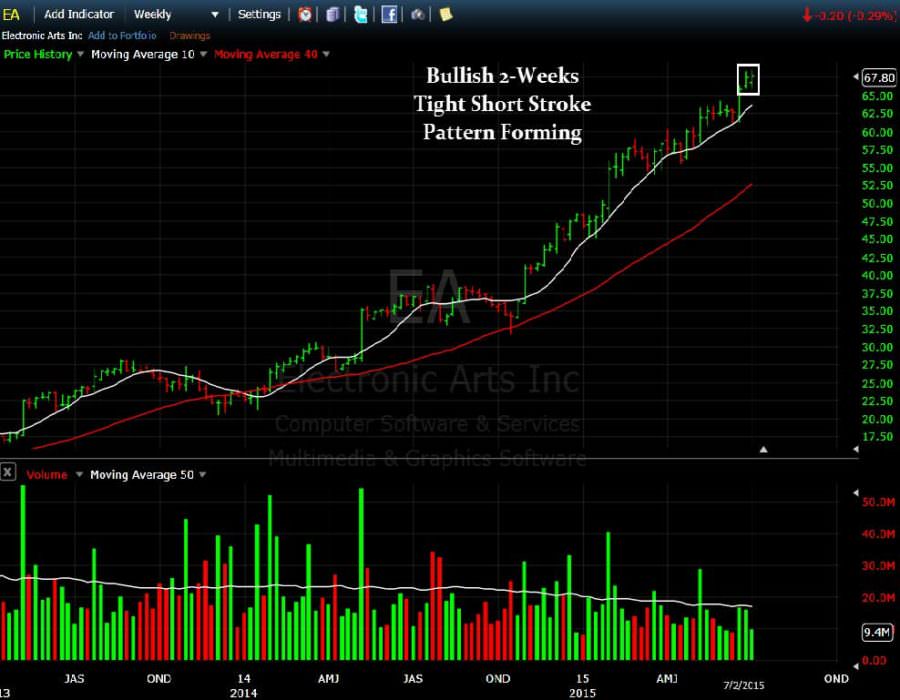
- EA – Forming bullish 2-weeks tight short-stroke pattern. Extended in near term
- FB – Nice action continues after huge breakout on monstrous volume. Prior chart highs are support
- FLT – Fell for third straight week and closed below 50 DMA line
- GOOGL – Fell last week as it continues going “nowhere” fast
- ILMN – Rallied last week and is now up in 9 of the past 10 weeks. Very strong action
- NFLX – Rallied last week after Icahn said he sold his position and walked away with a few billion
- SBUX – Tight closes over past 3 weeks. Very healthy action continues
- TSLA – Very strong action continues. Extended in near term
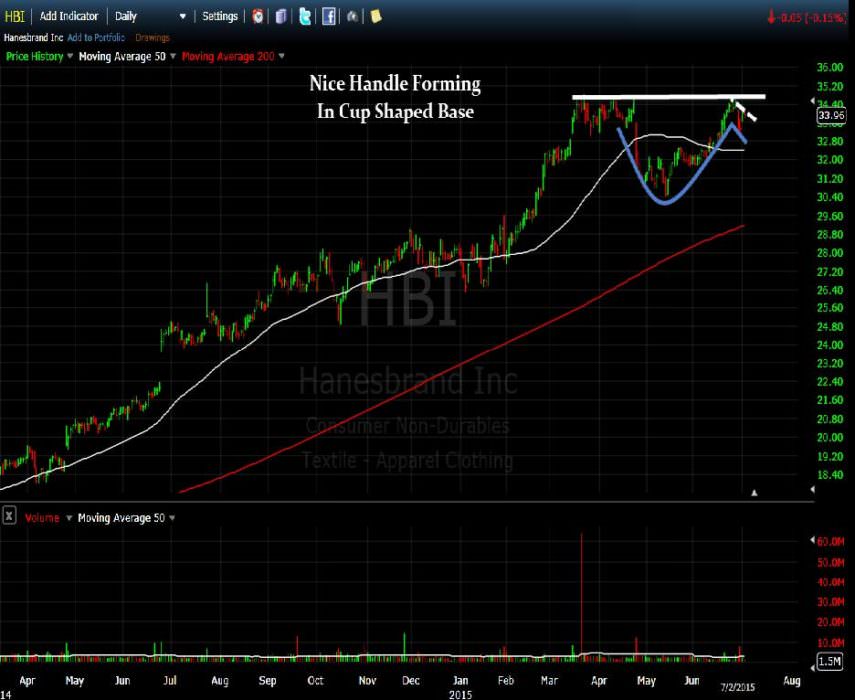
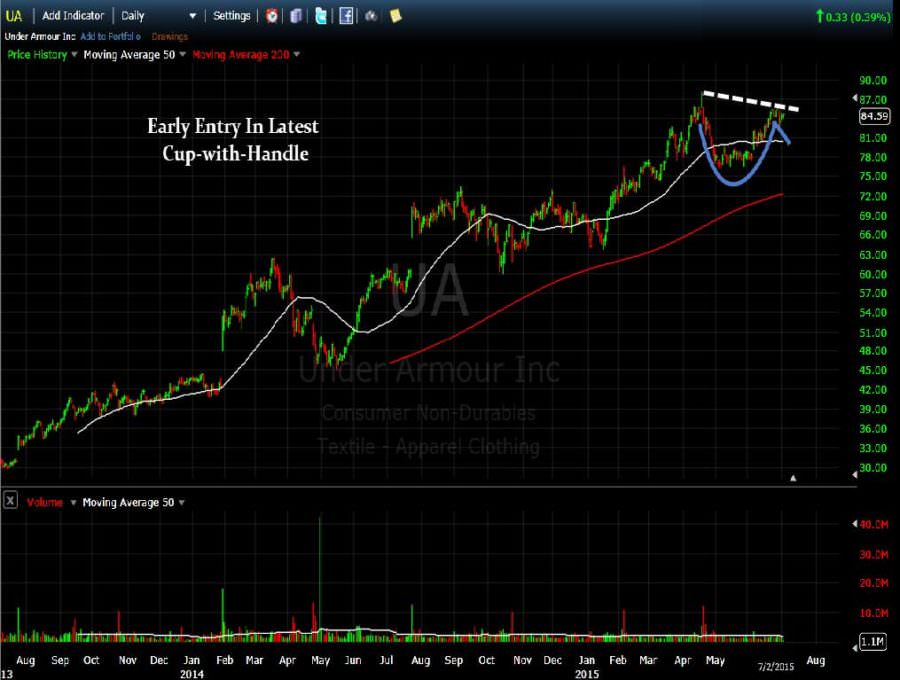
- UA – Continues forming right side of large cup shaped base. Now forming handle
- V – Fell last week and continues basing near its 50 DMA line
[/su_spoiler]
[su_spoiler title=”21 New Setups” style=”fancy”]
These hand-picked stocks are carefully selected to help with your idea generation and offer you additional setups each week. The setups are based on our proprietary criteria and offer advanced (dotted line) & classic long and short entry points (solid line). Short patterns are typically mirror images of long patterns.
Note: Please Verify All Earnings Dates/Data from Multiple Sources for Every Stock in all our report(s).
Charts Courtesy of FreeStockCharts.com and/or Stockcharts.com
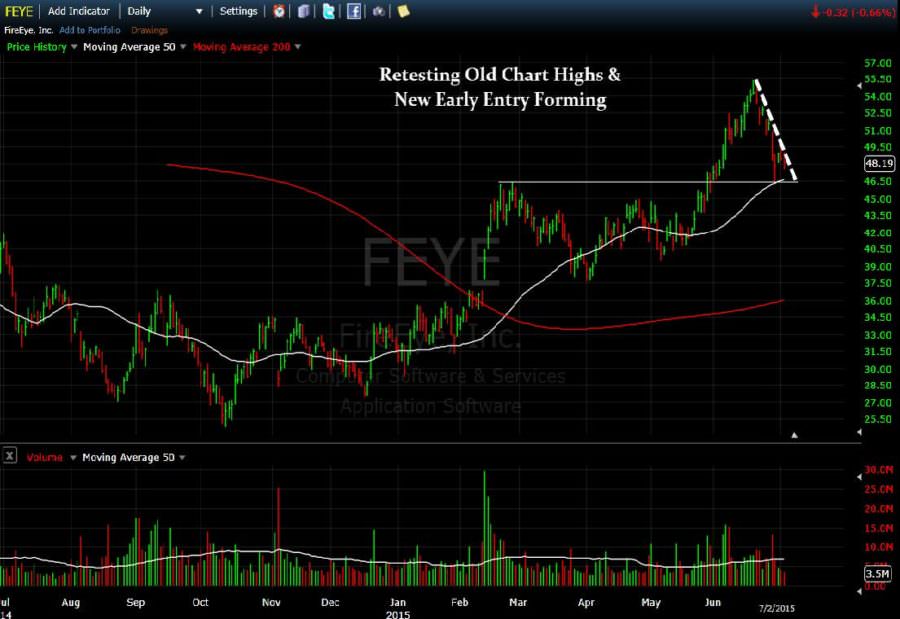
FEYE Working Order & Setup – Retesting Old Chart Highs & New Early Entry Forming
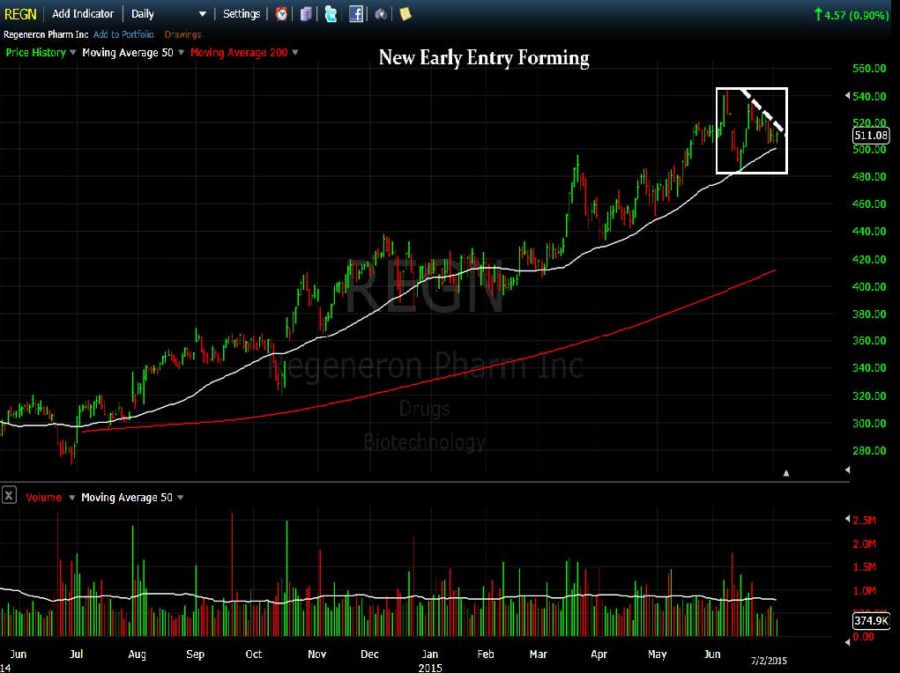
REGN Working Order & Setup: Early Entry & Nice Pullback Into 50DMA
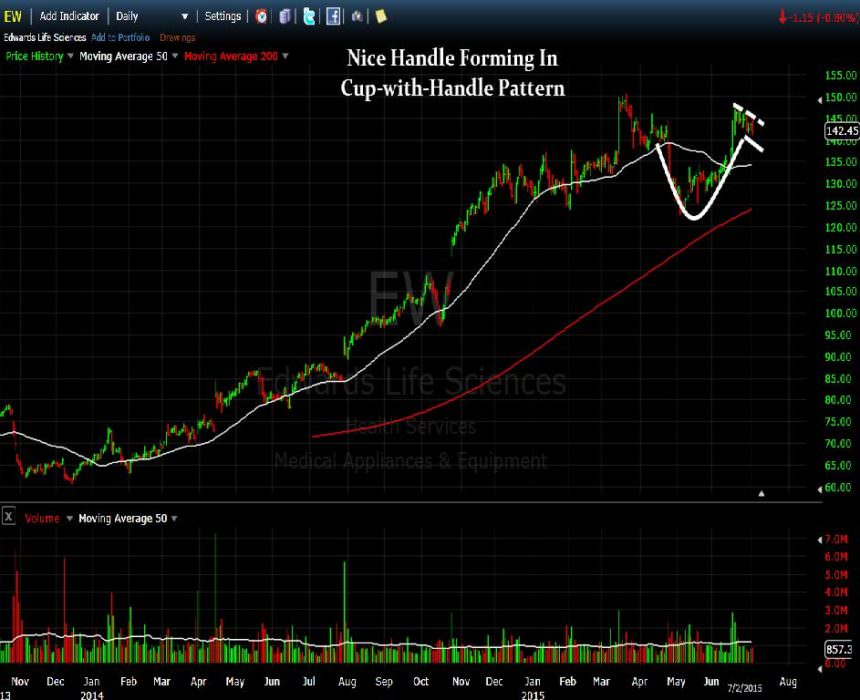
EW Setup: New Early Entry Forming In Cup-with-Handle Pattern
DATA Setup: New Early Entry

AMZN Setup: New Early Entry Forming
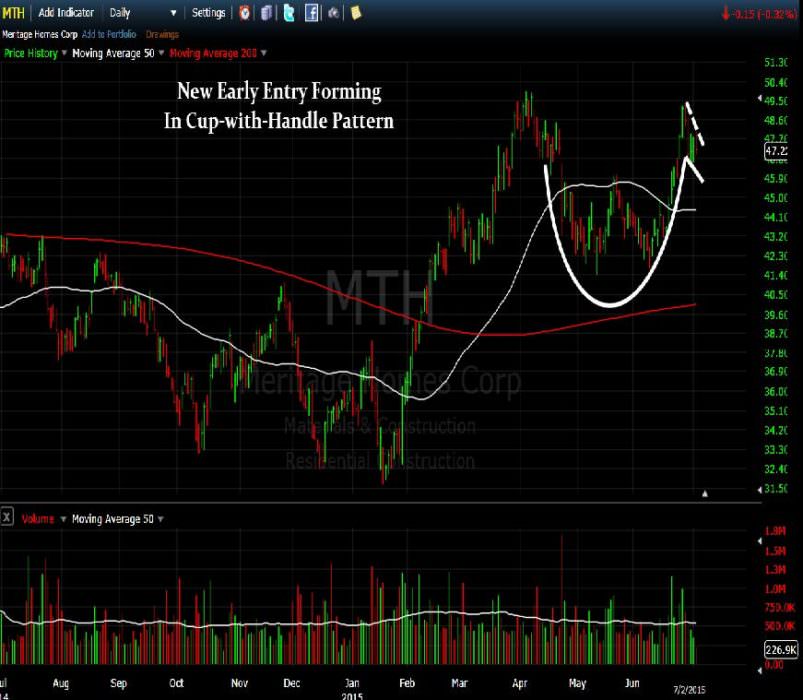
MTH Setup: Early Entry In Cup-with-Handle Pattern
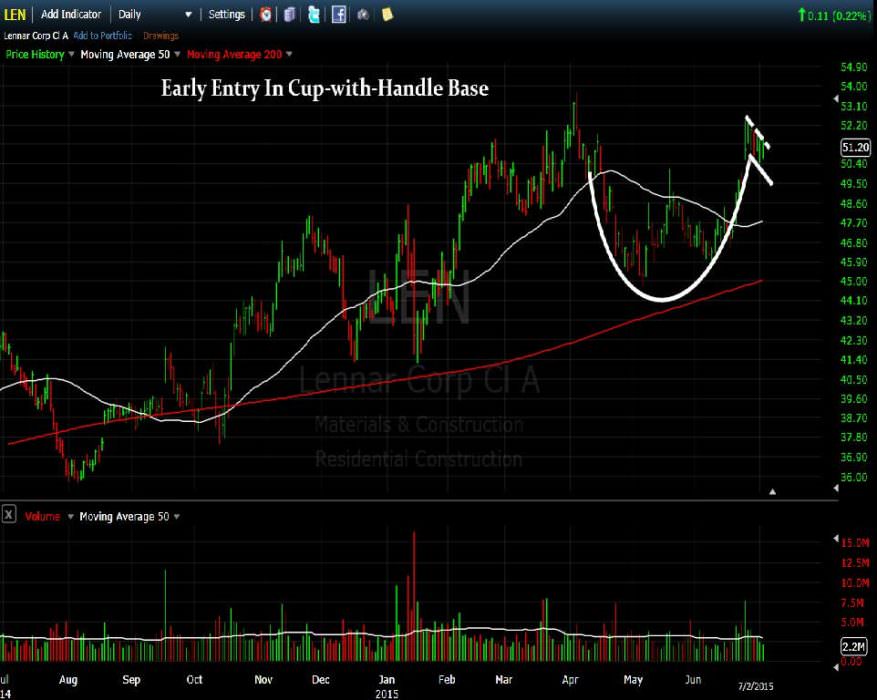
LEN Setup: New Early Entry Forming In Cup-with-Handle Pattern
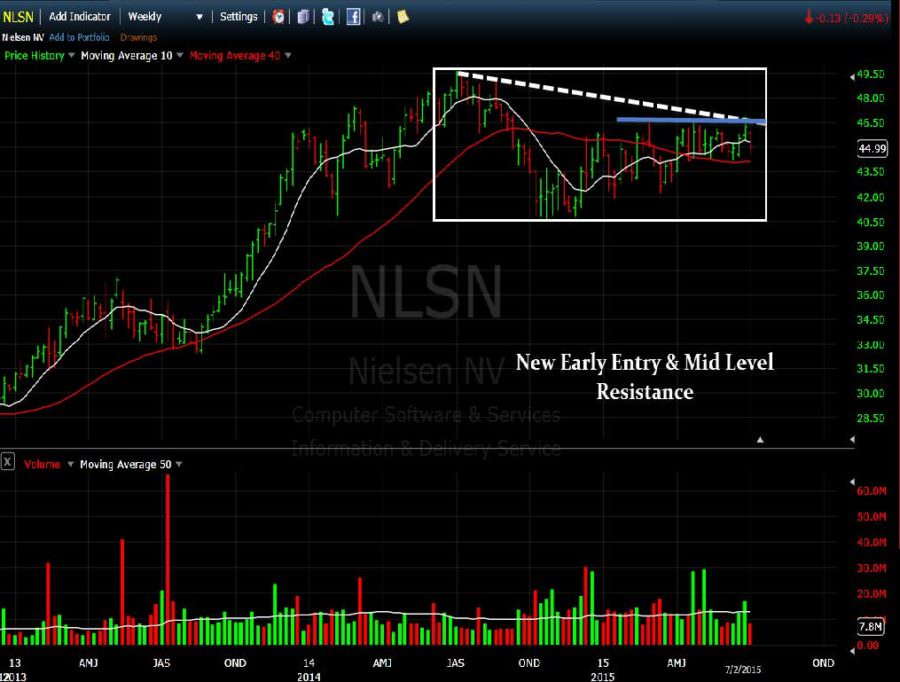
NLSN Setup: Nice Early Entry Forming
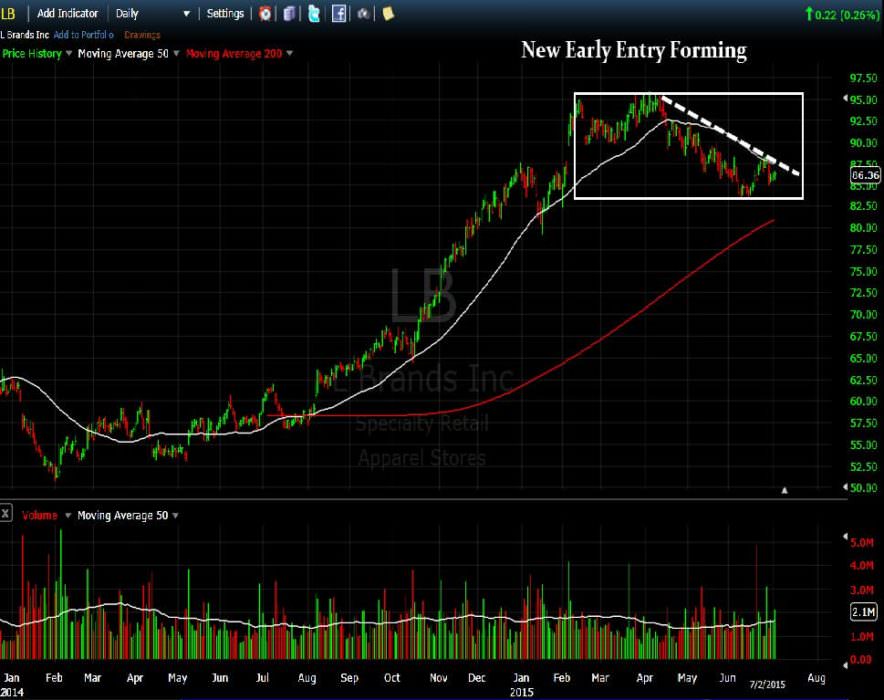
LB Setup: New Early Entry Forming
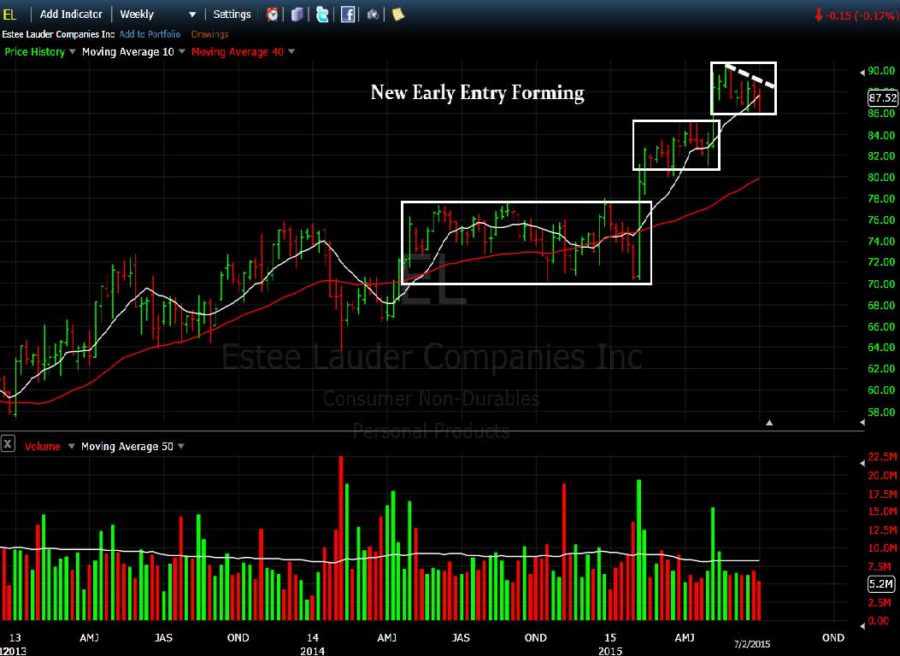
EL Setup: New Early Entry Forming
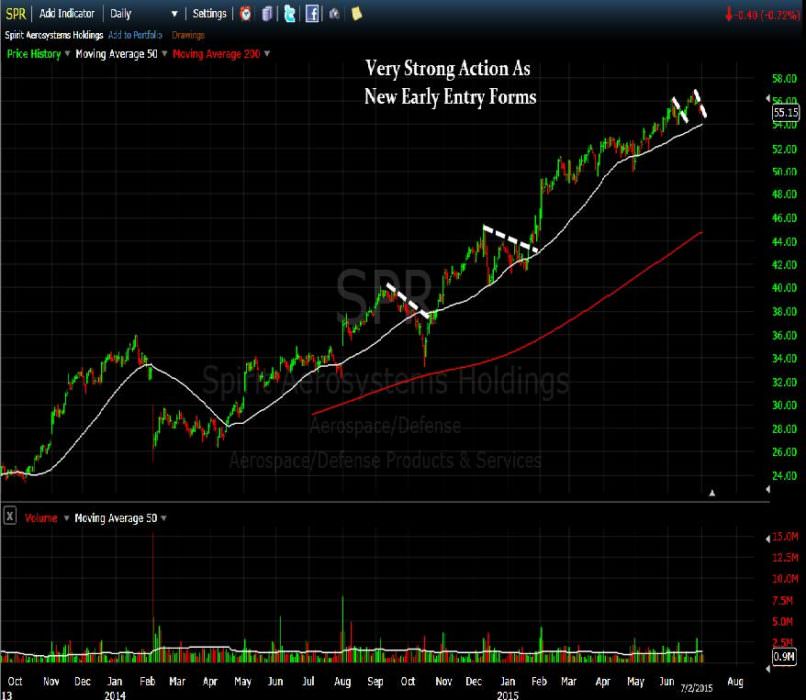
SPR SETUP: New Early Entry Forming
HBI Setup – Nice Handle Forming In Cup-Shaped Base
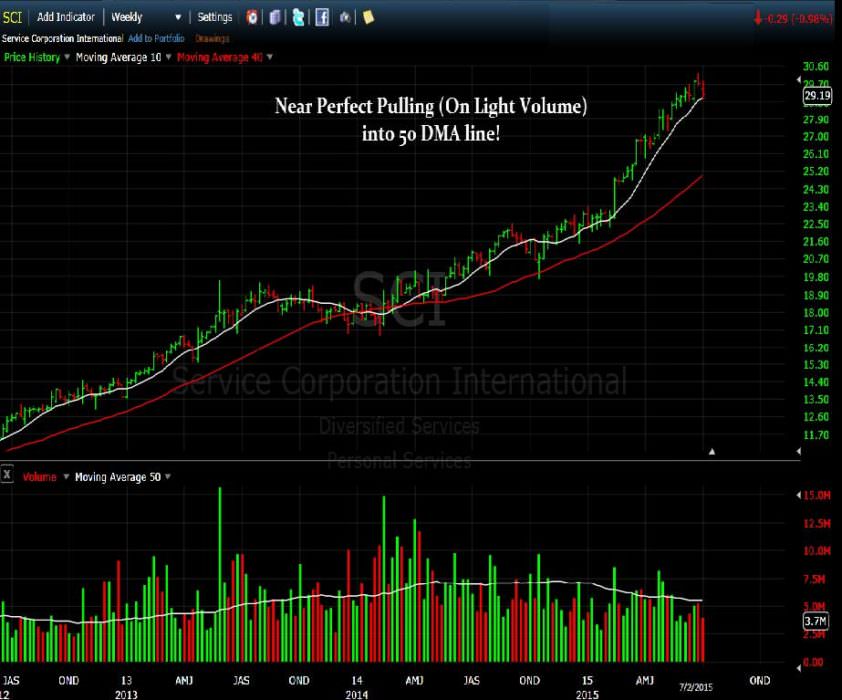
SCI Setup: Near Perfect Pullback Into 50 DMA line (on light volume)
UA Setup – Nice Early Entry Forming In Latest Cup-With-Handle Pattern
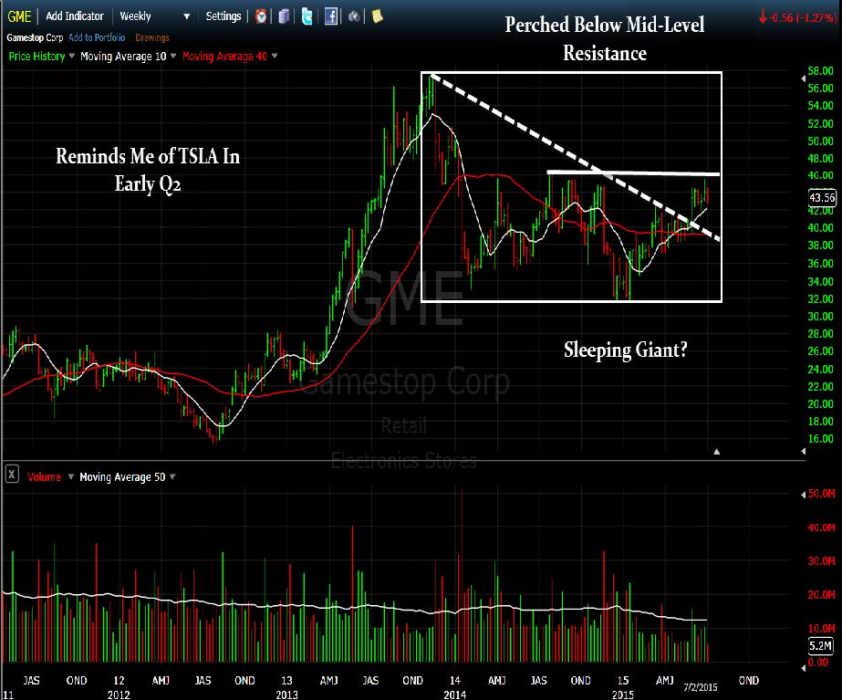
GME Setup – Perched Below Mid-Level Resistance
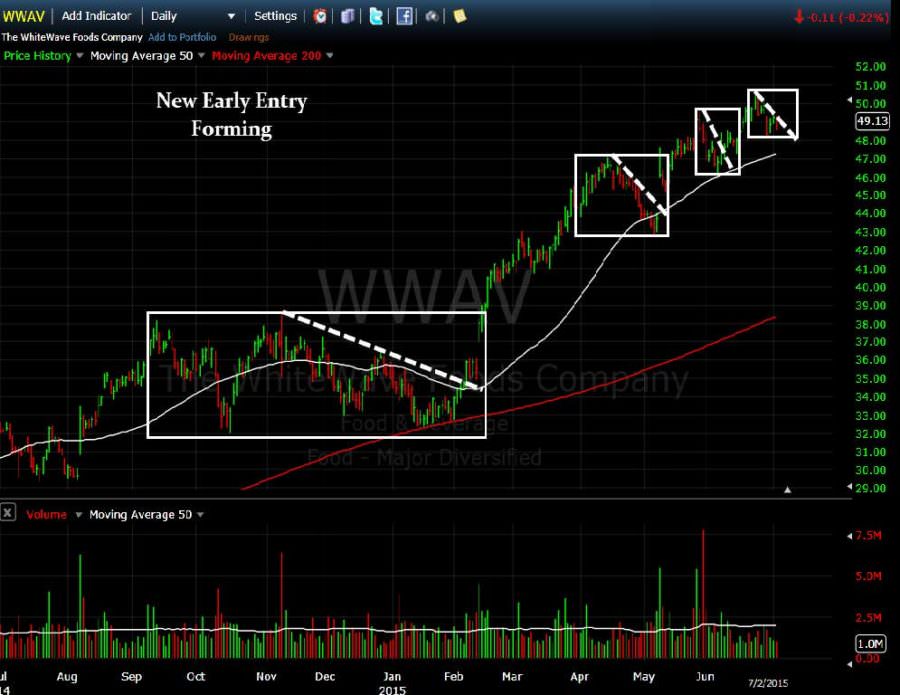
WWAV: New Early Entry Forming
EA: Bullish 2-Weeks Tight Short Stroke Pattern Forming
[/su_spoiler]
[su_spoiler title=”Strongest Sectors, Groups, & Symbols” style=”fancy”]
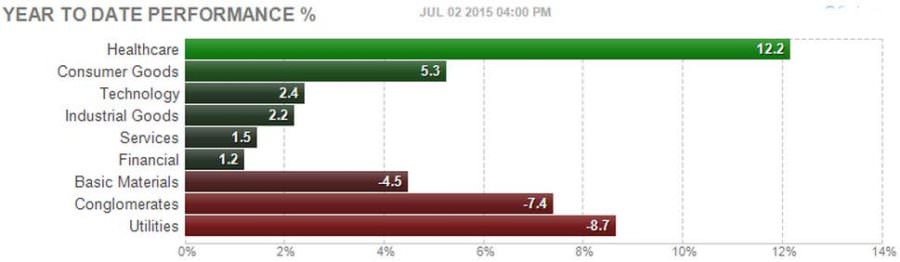
[su_heading style=”modern-1-dark” size=”18″]Strongest Sectors [/su_heading]
[su_heading style=”modern-1-dark” size=”18″]Strongest Groups [/su_heading]

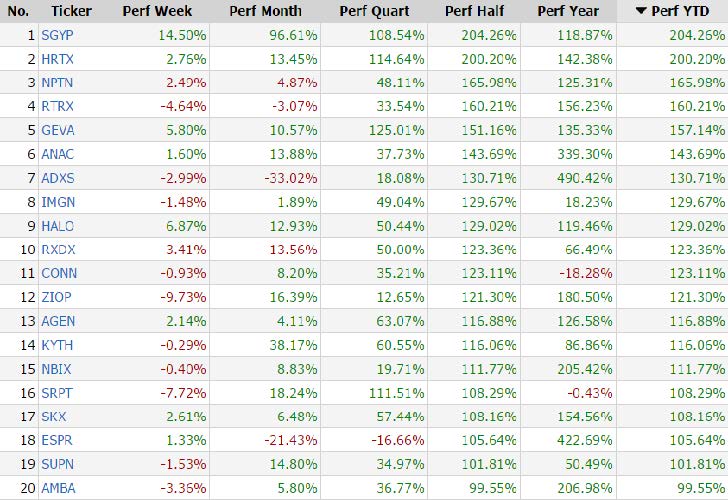
[su_heading style=”modern-1-dark” size=”18″]Strongest Performing Symbols This Year [/su_heading]
These are the top 20 strongest performing tickers on a year-to-date basis that are trading over $5, average daily volume over 500k and have a market cap >300M (Small cap-Mega Cap)
[/su_spoiler]


