

[su_spoiler title=”Socks Fall On Greek Woes” style=”fancy”]
Stocks closed lower on Monday after 61.3% of the Greek population voted ‘no’ and rejected the terms of the latest bailout. The European Central Bank adjusted haircuts on Greek collateral for the Emergency Liquidity Assistance (ELA), but the details were kept private and not revealed in the press release. In the U.S., economic data was mixed. The PMI Services Index slowed in June to 54.8, missing estimates for 55.1. The ISM service index held steady at 56.0, matching estimates for 56.0. Separately, Humana ($HUM) rallied after agreeing to be acquired by Aetna ($AET) as part of a transaction valued at $230/share. China’s Shanghai Composite continued to trade like a penny stock and rallied a +2.4%, down from an intra-day high of 8%, after China’s Central Bank (The People’s Bank of China) extended a lifeline to equity brokers through the China Finance Securities in an attempt to stem the recent decline.
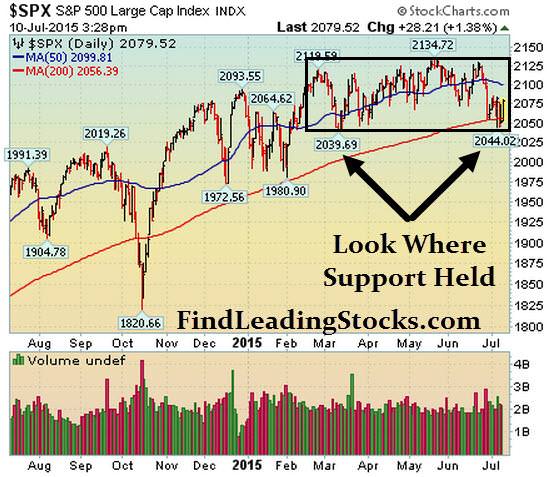
Tuesday was a very big support day for the major averages. The S&P 500 dipped into negative territory for the year and briefly broke below its 200 DMA line before the bulls showed up and defended that important level. Technically, it was a big support day for the market as the bulls defended important inflection points in all the major indices: the 200 DMA line for the S&P 500 and Dow Industrials and the 150 DMA line for the Nasdaq and the Russell 2000. Greece submitted a new proposal to get emergency funding for the month of July which would kick the can further down the road. Crude oil prices continued to plunge, falling over 10% in three trading sessions. Other commodities, like gold and silver also fell hard as the US Dollar rallied. Lots of areas of the market are breaking down which bodes poorly for this ongoing and aging 6.5 year bull market. China announced unprecedented measures to stop their market from crashing. They stopped trading in many of their stocks, banned short selling, threatened to arrest short sellers, printed more money to buy shares, and did everything in their power to further manipulate their equity market. It is important to note that a year ago, they created a huge bubble in their stock market, a.k.a. The Beijing Put, and are now doing their best to stop the inevitable crash that comes after a bubble bursts. This erodes investor confidence and causes many people to avoid China as an asset class. Separately, the IMF urged the Fed (again) not to raise rates in 2015. Stocks sold off hard on Wednesday, almost erasing all of Tuesday’s big rally, after a new deadline was set for Greece to stay in or leave the Eurozone. Outside of stocks, three rather odd major supposedly unrelated technical glitches occurred on Wednesday: United Airlines ($UAL) was forced to shut down all flights due to a technical glitch, the floor of the NYSE was shut down for almost 4 hours in the middle of the day due to a technical glitch, and the Wall Street Journal’s website was offline, also due to a technical glitch. We are being told that they were unrelated events and not due to a cyber attack. Electronic trading was not affected by the technical glitch so trading continued, just off the floor. These are the facts and, as always, we will let you decide. Needless to say, cyber security stocks, rallied sharply (and remain a favorite group of ours). The Fed released the minutes of their latest meeting which showed the Fed still remains data-dependent.
[/su_spoiler]
[su_spoiler title=”Thursday-Friday’s Action: Stocks Rally on Greek Optimism” style=”fancy”]
Overnight, shares in China soared after the government stepped in with another round of crazy interference to manipulate their stock market. Stocks opened sharply higher on Thursday but closed near their lows as the rally quickly faded. The Dow opened up 250 points and closed up 32 points. Elsewhere, optimistic-sounding remarks from top Eurozone officials also helped boost stock prices. Economic data was limited to weekly jobless claims. The Labor Dept said weekly claims rose to 297k, which missed estimates for 276k. The July 4th holiday was blamed for the distorted reading. Separately, earnings season officially began when Alcoa ($AA) rallied after reporting a bottom line miss on better than expected revenue. Stocks opened sharply higher on Fri after Greece submitted their latest proposal to stay in the Eurozone. In another technical glitch, TD Ameritrade ($AMTD) said they were experiencing a ‘widespread’ problems executing orders. The issue was resolved by 10am EST and the company said was due to a “software update.” The same reason given for the technical glitch at the NYSE on Wednesday. The transports opened up nicely, led by the airlines, as crude oil plunged -13% in the past two weeks. Janet Yellen gave a speech on Friday and largely reiterated her recent stance that rate hike remains in the cards in 2015..if the data improves.
[/su_spoiler]
[su_spoiler title=”Market Outlook: The Central Bank Put Is Alive And Well” style=”fancy”]
Remember, in bull markets surprises happen to the upside. This has been our primary thesis since the end of 2012. We would be remiss not to note that this very strong bull market is aging (celebrated its 6th anniversary in March 2015) and the last two major bull markets ended shortly after their 5th anniversary; 1994-2000 & 2002-Oct 2007). To be clear, the central bank put is very strong and until material damage occurs, the stock market deserves the longer-term bullish benefit of the doubt. As always, keep your losses small and never argue with the tape.
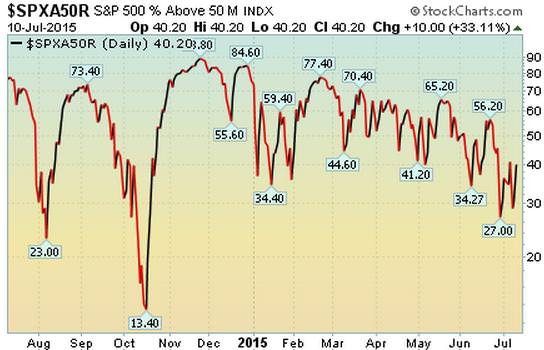
40.2% Of Stocks in the S&P 500 Are Above Their Respective 50 DMA
(Market Tends To Turn When This Reading Gets Above 70% or Below 40%)
Observation: Readings above 70% usually (not always) correspond with a short term pullback Conversely, reads below 40% usually (not always) correspond with a short term bounce
[/su_spoiler]
[su_spoiler title=”Big Stock List” style=”fancy”]
- AAPL – Broke below support of its latest 5 month base. Bulls defended 200 DMA line. Earning 7/21
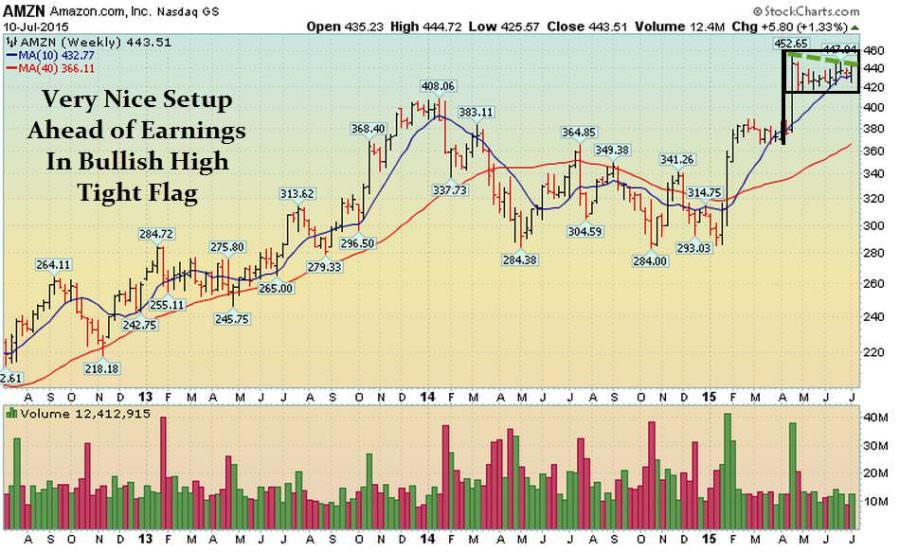
- AMZN – Very nice rally last week (weekly chart) after bulls defended 50 DMA. Earnings 7/23
- EA – Huge rally last week after breaking out of bullish 2-wks tight pattern. Extended. Earnings 7/30
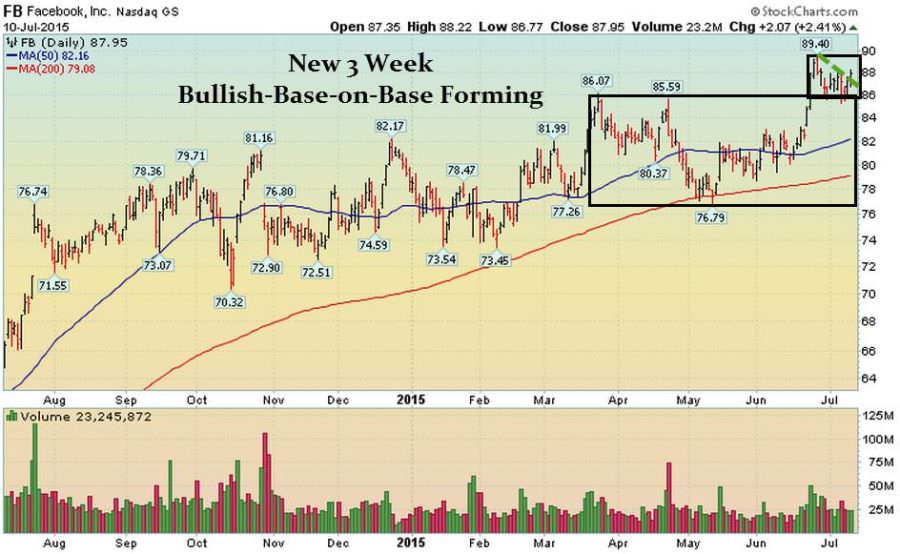
- FB – Forming very bullish 3 wk handle. Prior chart highs are support. Earnings 7/29
- FLT – Down 4th street week. 50 DMA line is resistance. Earnings 7/30
- GOOGL – Very nice rally last week. Earnings 7/16. Getting ready to breakout. Earnings 7/16
- ILMN – Very strong action continues. Only 2 down weeks in past 3 months. Earnings 7/21
- NFLX – Only 4 down weeks in past 14. Very strong action continues. Earnings 7/15
- SBUX – Very healthy action continues. Getting ready to breakout of latest 3 wk base. Earnings 7/23
- TSLA – Finally pulled back and found support just above 50 DMA line. Earnings 8/5
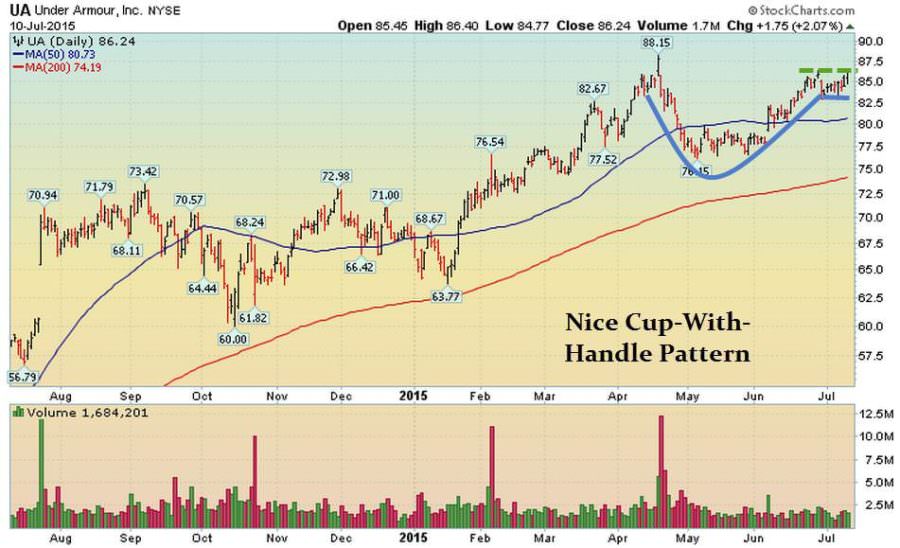
- UA – Continues forming right side of large cup shaped base. Forming bullish handle. Earnings 7/23
- V – Rallied last week but closed below its 50 DMA line. Earnings 7/23
[/su_spoiler]
[su_spoiler title=”17 New Setups” style=”fancy”]
These hand-picked stocks are carefully selected to help with your idea generation and offer you additional setups each week. The setups are based on our proprietary criteria and offer advanced (dotted line) & classic long and short entry points (solid line). Short patterns are typically mirror images of long patterns.
Note: Please Verify All Earnings Dates/Data from Multiple Sources for Every Stock in all our report(s).
Charts Courtesy of FreeStockCharts.com and/or Stockcharts.com
UA Working Order & Setup
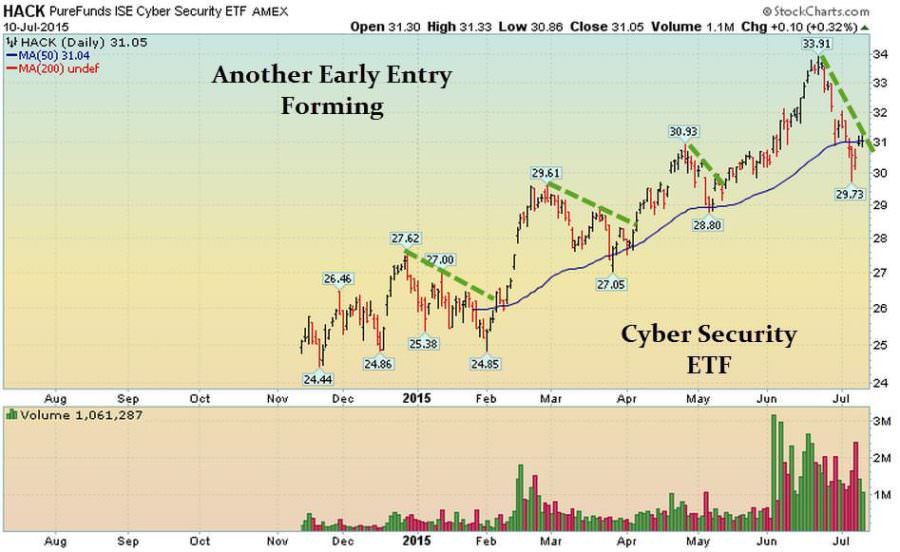
HACK Setup: Early Entry & Sitting On 50DMA
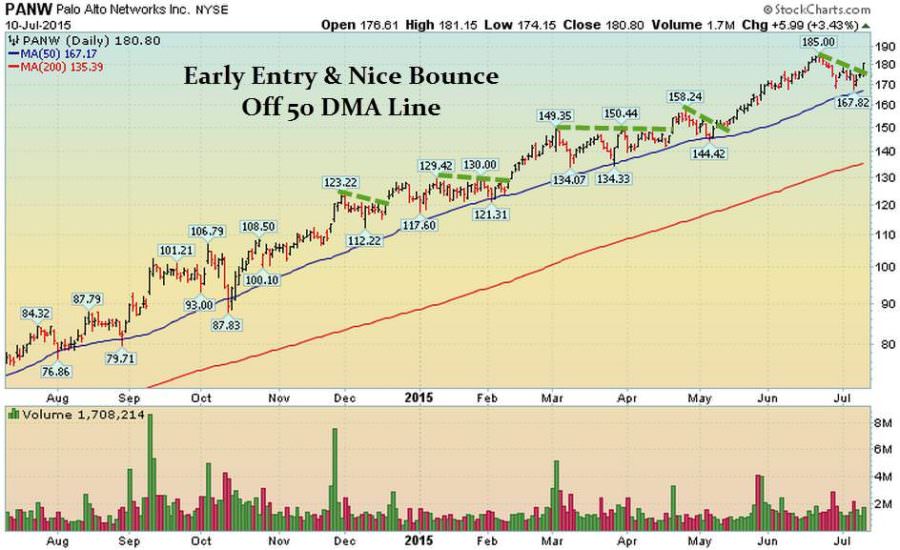
PANW Setup: New Early Entry Forming As It Bounces Off Its 50 DMA
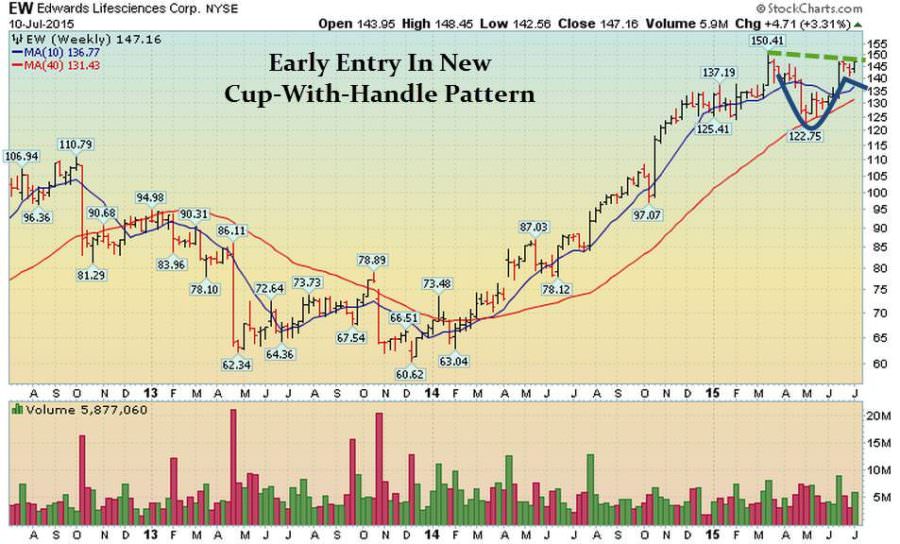
EW Setup: New Early Entry Forming In Bullish Cup-with-Handle Pattern
AMZN Setup: New Early Entry Forming In Bullish High Tight Flag
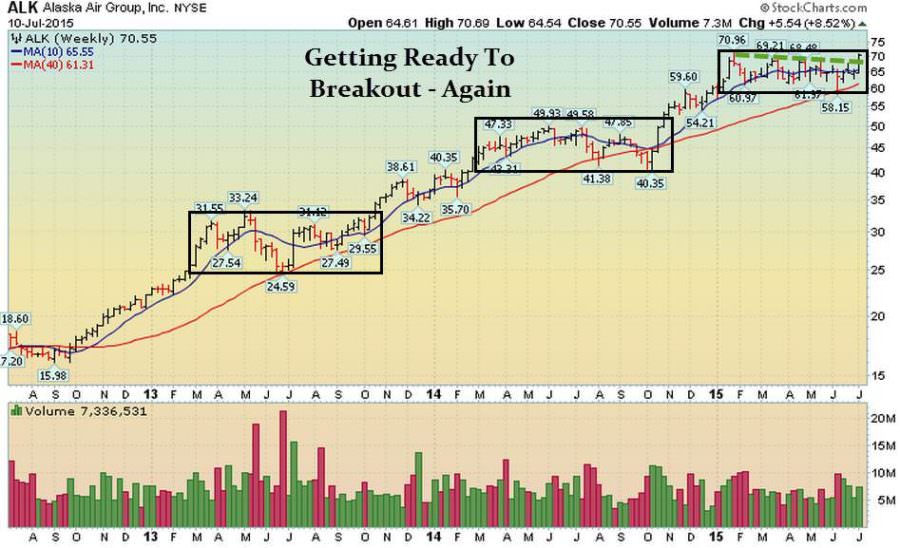
ALK Setup: Getting Ready To Breakout – Again
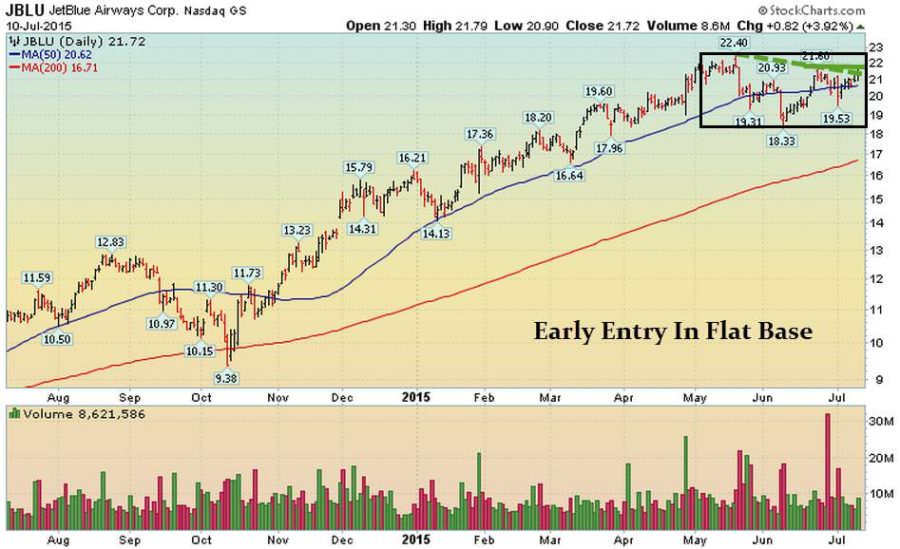
JBLU Setup: Early Entry In New Flat Base
FB Setup: Nice Early Entry Forming In New Bullish 3-Week Handle/Base
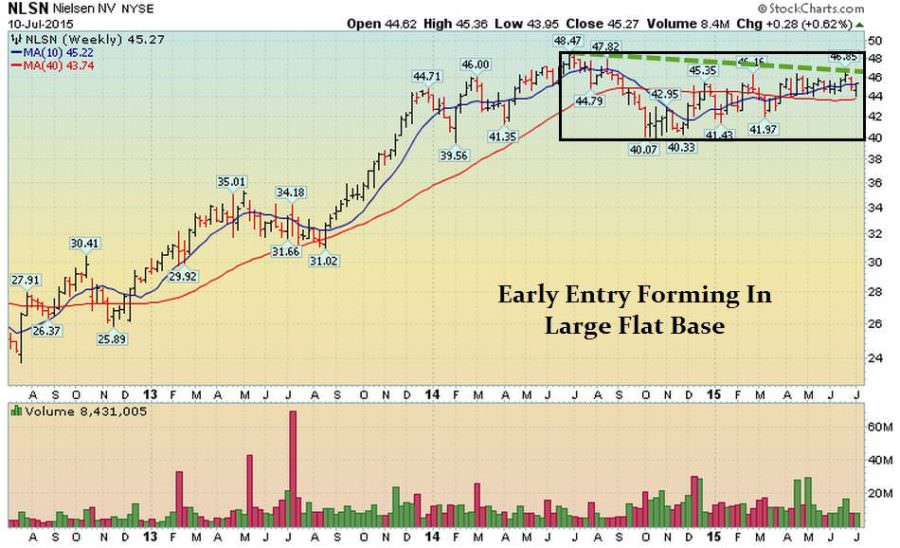
NLSN Setup: New Early Entry Forming
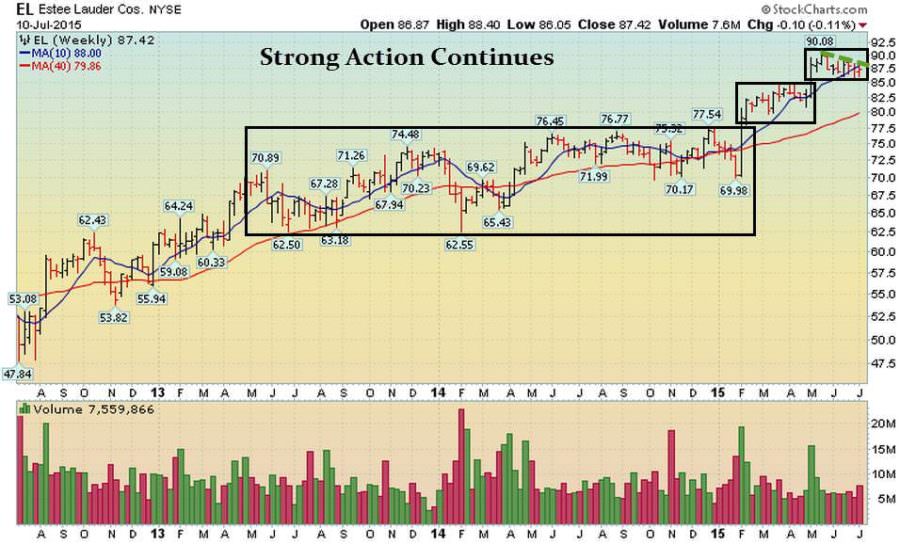
EL Setup: New Early Entry Forming
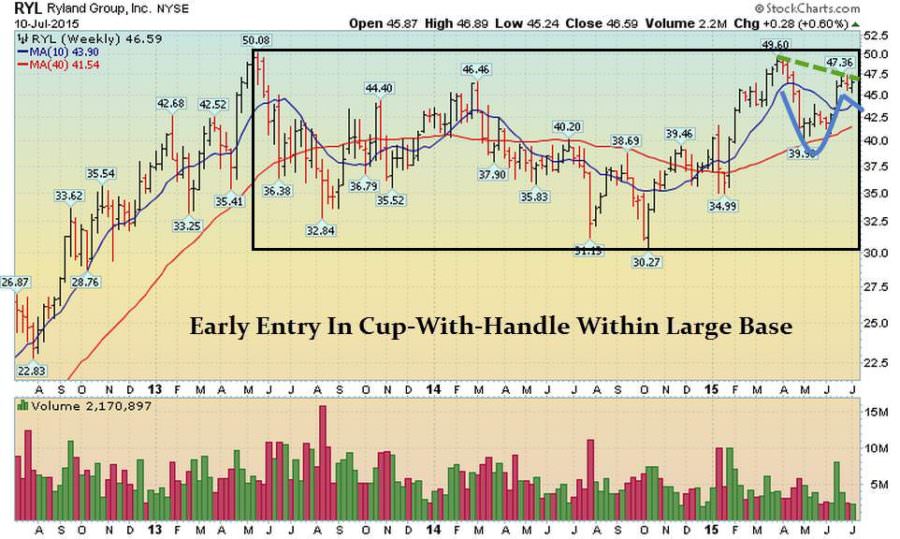
RYL SETUP: New Early Entry Forming In Cup-With-Handle
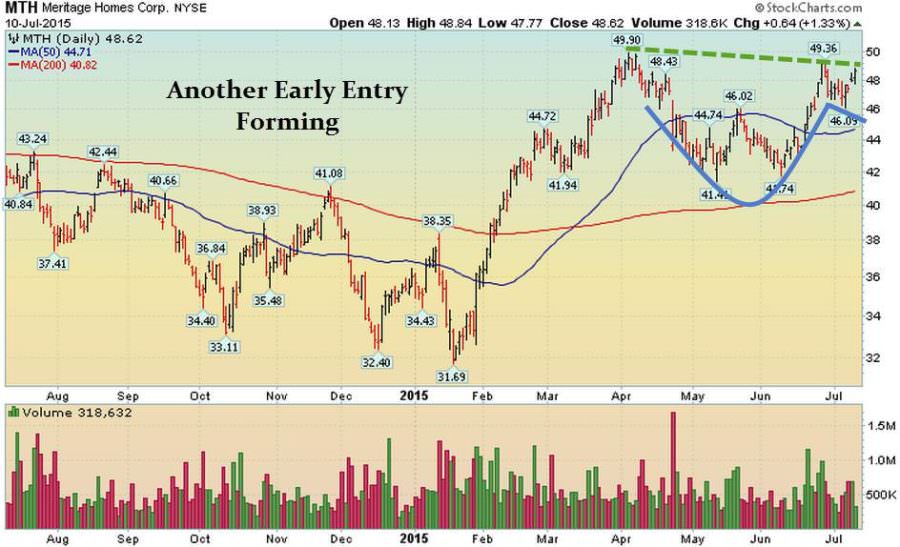
MTH Setup: Another Early Entry Forming
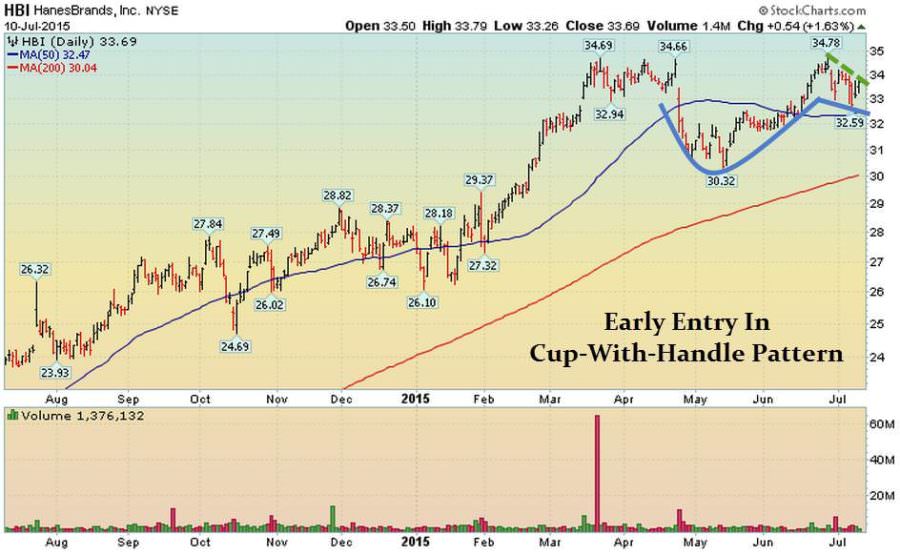
HBI Setup – Nice Handle Forming In Cup-Shaped Base
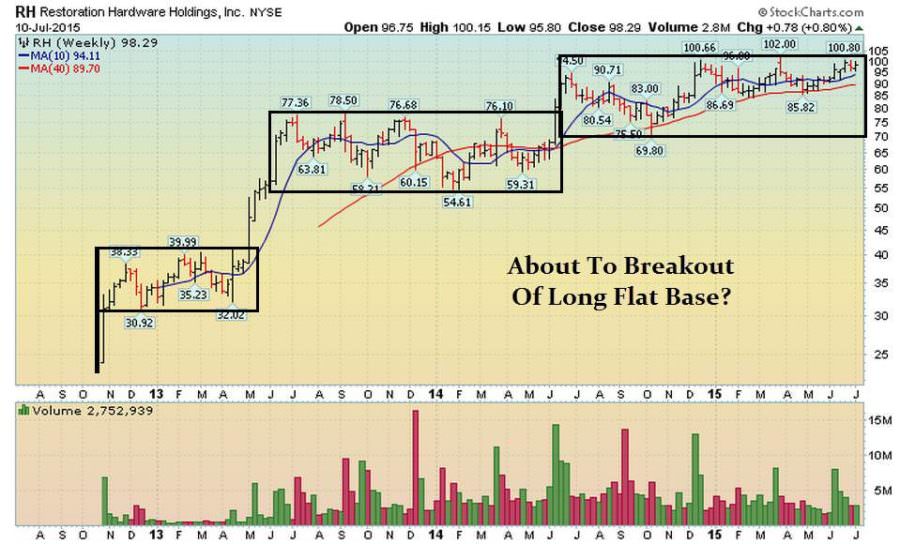
RH Setup – Perched Below Resistance Of Long Flat Base
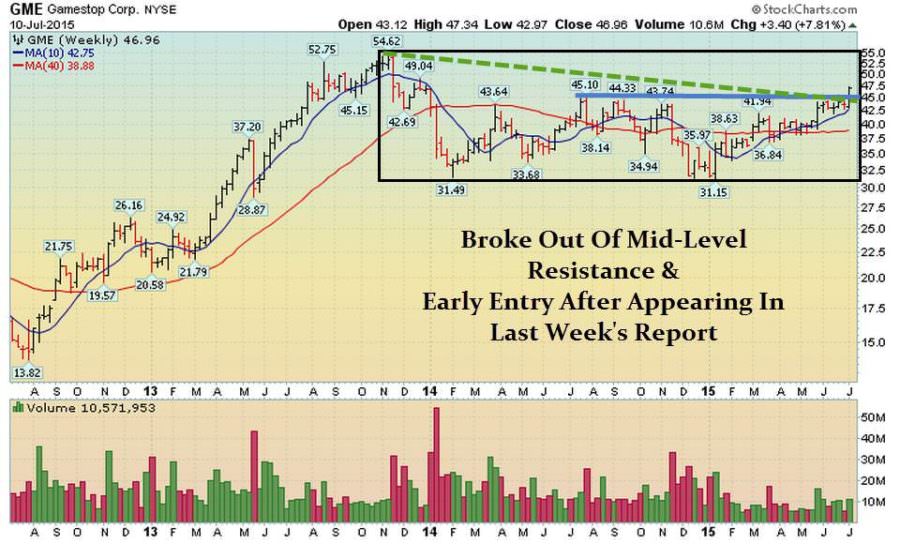
GME Setup – Forming Right Side Of New Base
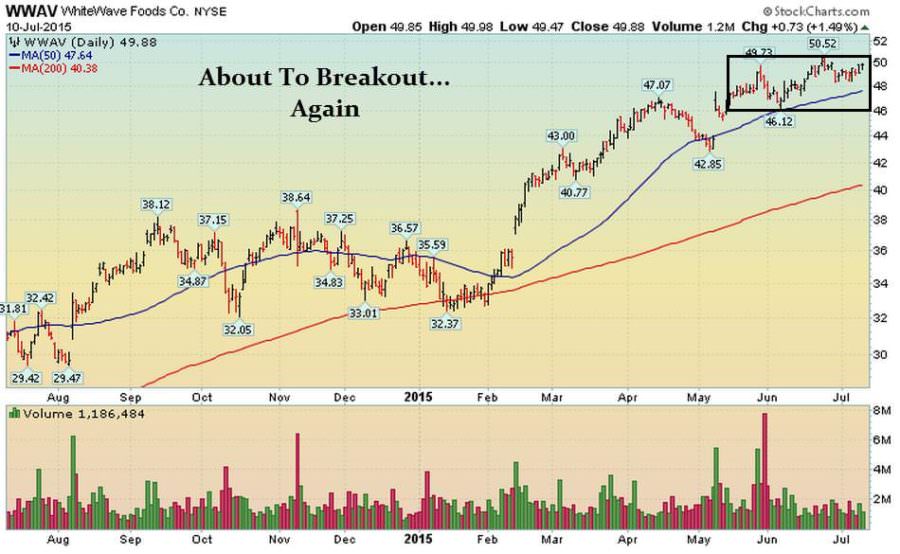
WWAV: Perched Below Resistance Of Latest Flat Base
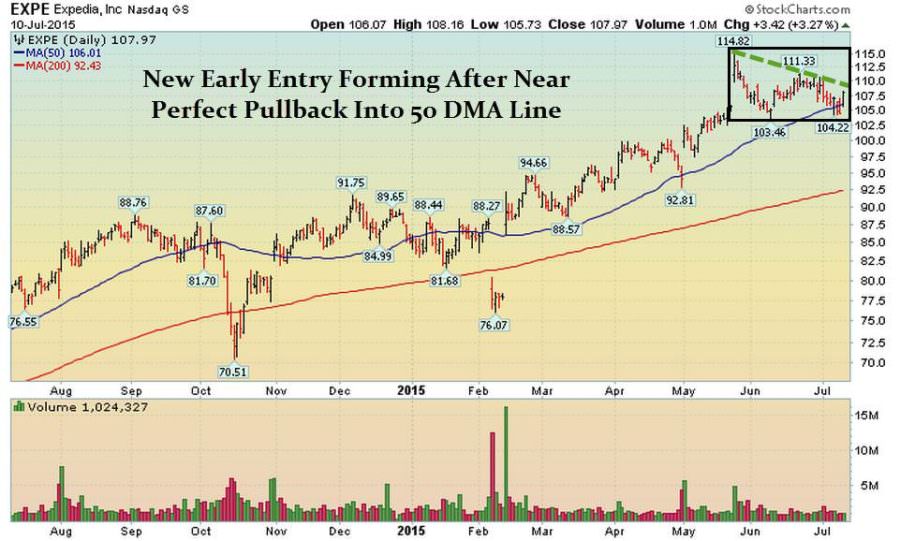
EXPE: New Early Entry Forming After Nice Pullback Into 50 DMA Line
[/su_spoiler]
[su_spoiler title=”Strongest Sectors, Groups, & Symbols” style=”fancy”]
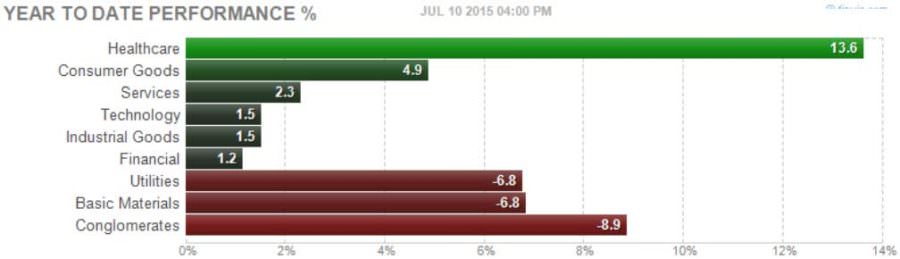
[su_heading style=”modern-1-dark” size=”18″]Strongest Sectors [/su_heading]
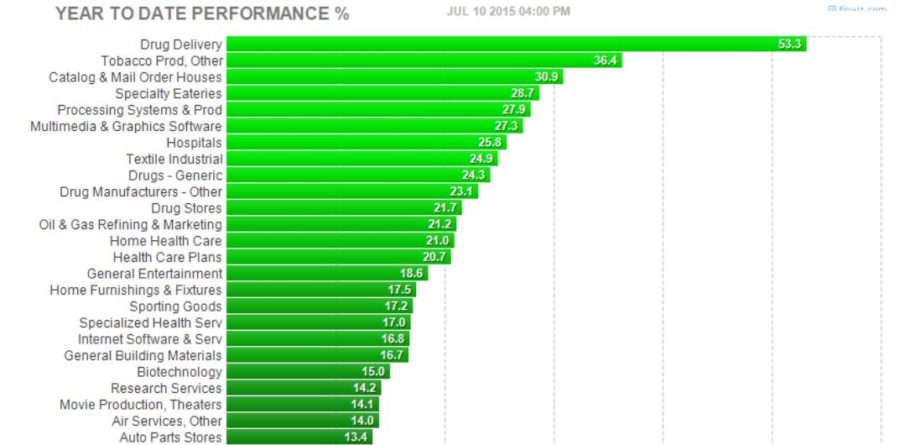
[su_heading style=”modern-1-dark” size=”18″]Strongest Groups [/su_heading]
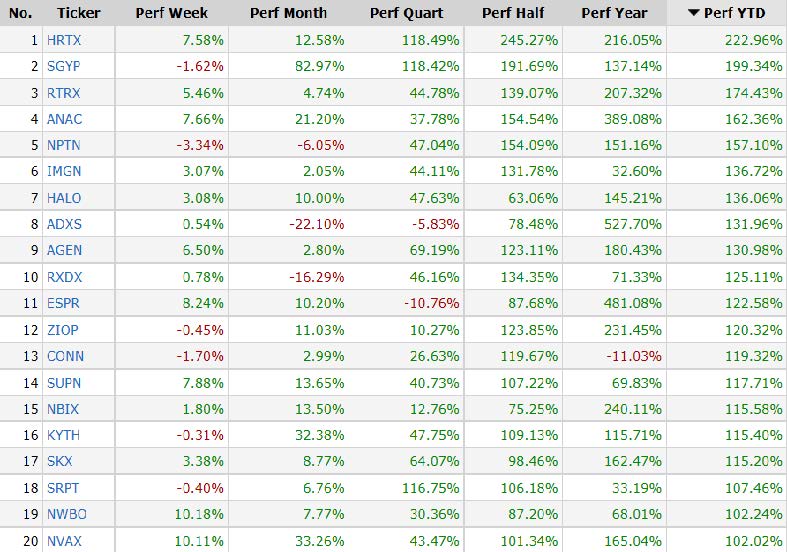
[su_heading style=”modern-1-dark” size=”18″]Strongest Performing Symbols This Year [/su_heading]
These are the top 20 strongest performing tickers on a year-to-date basis that are trading over $5, average daily volume over 500k and have a market cap >300M (Small cap-Mega Cap)
[/su_spoiler]


