

[su_heading style=”modern-2-dark” size=”20″] Market Update [/su_heading]
It was a historic and very wild week on Wall Street with record point moves (up and down) almost every day of the week. Typically, massive sell-offs do not recover overnight. Additionally, massive selloffs followed by record volatility normally leads to lower, not higher prices – especially when they occur in aging bull markets. Right now, nearly every major market around the world is trading like a penny stock (wild percent swings – up and down) and that typically bodes poorly for stocks. The only (& MAJOR) wild card remains the Fed and other government intervention. In the short term, the market bounced from extremely oversold levels and it was very impressive to see the bulls help the major indices close “up” on the week. As of Friday’s close, the S&P 500 is only 6.8% below its record high. We do not want to short until we see more damage on the downside and we see stocks stay down more than 48 hrs! Remember, the Fed has put on the perfect hedge by saying they are data dependent: If the data improves it gives them the option to raise rates and if the data deteriorates (present situation) they can easily justify not raising rates or another round of QE. The problem is that even with rates at zero and other central banks printing money, global economic demand remains lackluster at best. So the Fed’s conundrum is that Main Street is barely growing, even with rates at zero. At this point, markets around the world are clearly forecasting another global recession and not within standing more Fed easing. Market moves are very random in nature and we do not have an edge right now. We do know that we have A LOT OF setups if the market decides to rally from here and there will be a lot of bearish setups if the market decides to fall. Defense is king until the S&P 500 trades above 2040.
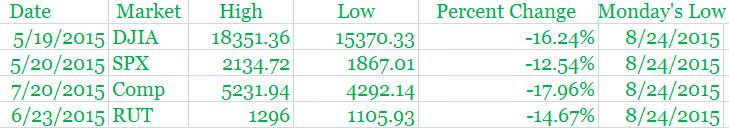
Here are the Percent Declines From the 2015 High to Last Monday’s Low
[su_heading style=”modern-2-dark” size=”20″] Portfolio Update [/su_heading]
The FLS portfolio is enjoying a very healthy 2015 and is in cash at this point. Our discipline requires us to let some more time pass before getting involved on either the long or short side. The moves right now are too random and we do not like to participate when the Dow swings 300+ points in under an hour. Thankfully, we’ve earned a decent cushion and have afforded the luxury of patience right now.
[su_heading style=”modern-1-dark” size=”18″] Positions & Working Orders: [/su_heading]
- There are no open positions or working orders right now
[su_heading style=”modern-2-dark” size=”20″] Analyzing The S&P 500’s Latest Moves (Up & Down) [/su_heading]
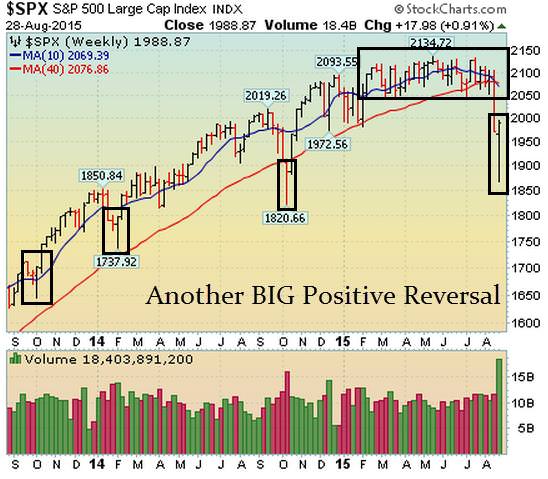
Nearly every pullback has been shallow in both size (small percent decline) and scope (short in duration) which is bullish for this ongoing and very powerful rally.
[su_table]
| Pullback | Rally | |||||
| High | Low | % Change | Low | High | % Change | |
| SPX | 2132.8 | 1970 | -7.63% | 1867 | 1993 | 6.75% |
| SPX | 2134.7 | 2044.02 | -4.25% | 2044 | 2126.64 | 4.04% |
| SPX | 2129.9 | 2056.32 | -3.45% | 2039.7 | 2134.72 | 4.55% |
| SPX | 2134.7 | 2085.67 | -2.30% | 1980.9 | 2119.59 | 7.00% |
| SPX | 2119.6 | 2039.69 | -3.77% | 1972.6 | 2093.55 | 6.13% |
| SPX | 2093.6 | 1980 | -5.42% | 1820 | 2079.47 | 14.26% |
| SPX | 2079.5 | 1972.56 | -5.14% | 1904 | 2019.26 | 6.05% |
| SPX | 2019 | 1820 | -9.86% | 1814 | 1991 | 9.76% |
| SPX | 1991 | 1904 | -4.37% | 1737 | 1897 | 9.21% |
| SPX | 1897 | 1814 | -4.38% | 1646 | 1850 | 12.39 |
| SPX | 1850 | 1737 | -6.11% | |||
| SPX | 1729 | 1646 | -4.80% | |||
| Avg Pullback | -5.12% | Avg Gain | 8.03% | |||
[/su_table]
[su_heading style=”modern-2-dark” size=”20″] Chart of the Week [/su_heading]
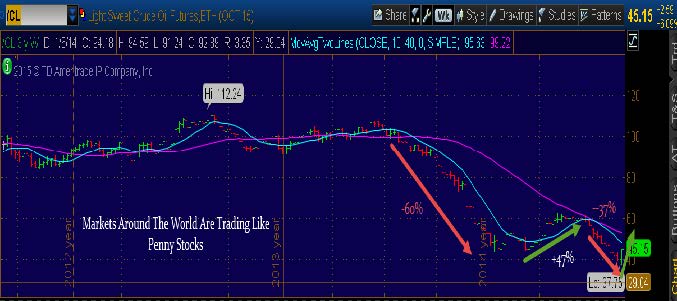
Markets Around The World Are Trading Like Penny Stocks. In the Last 11 Weeeks – Crude Oil Plunged -37%, Then Surged 21% In 4 Days!
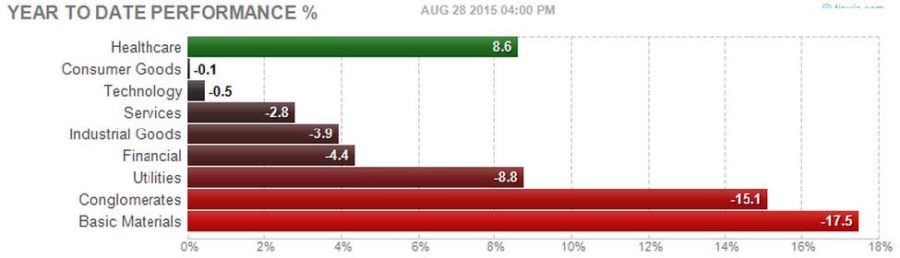
[su_heading style=”modern-2-dark” size=”20″] Year-To-Date Scorecard [/su_heading]
Nasdaq Comp +1.9%% YTD, S&P 500 -3.5% YTD, Russell 2k -3.6%, DJ Industrials -7.1%
[su_heading style=”modern-1-dark” size=”18″] Key Points [/su_heading]
- Uptrend: Short-Term Sideways, Intermediate Down & Long Term Up
- SPX Support, 1867.01
- SPX Resistance: 2040
- Sarhan’s Crowd Behavior Index: Neutral
(Properitary market indicator that measures crowd sentiment: Bullish Bearish or Neutral)
[su_heading style=”modern-1-dark” size=”18″] Global Macro Update [/su_heading]
[su_row]
[su_column size=”1/2″]
- Stocks: Sideways
- Bonds: Uptrend
- Currencies (Euro/USD): Sideways
- Softs: Downtrend
[/su_column]
[su_column size=”1/2″]
- Energy: Downtrend
- Metals: Downtrend
- Grains: Downtrend
[/su_column]
[/su_row]
[su_spoiler title=”Monday-Wednesday’s Action: Record Moves Up & Down On Wall Street” style=”fancy”]
U.S. stocks experienced their weakest open in history after Asian markets plunged on continued growth concerns. China’s Shanghai Composite tanked -8.5% overnight which sparked a global sell-off. Before Monday’s open, “fear took over” causing the Dow & S&P 500 futures were “limit-down” which means circuit breakers went off causing them to “stop” trading. Five minutes after the open, the Dow plunged 1,089 points – which was the largest point decline in history- and then immediately rallied almost 900 points – which was the largest intra-day rally in history before closing down over 500 points. This type of exaggerated and manic trading typically occurs during bearish, not bullish. phases. The CBOE Volatility Index (VIX) did not produce any quotes during the first 30 minutes of the session but once quotes resumed the index soared past levels seen during the May 2010 flash crash. The VIX is a great fear gauge because it rallies when the market falls (or when fear is elevated). Stocks gapped higher on Tuesday after China cut interest rates and lowered their reserve requirement to stimulate their markets. The FHFA rose by only 0.2% in June, missing estimates for 0.4%. The S&P Case-Shiller index slid -0.1%, missing estimates for 0.1% gain. The PMI service index came in at 55.2, beating estimates for 54.8. New homes ales rose to 507k, missing estimates for 516k. Year-over-year sales were up a very healthy 26%.Consumer confidence rose to 101.5, beating estimates for 94.0. The Richmond Fed Manufacturing index disappointed with a zero reading, missing estimates for 10. The oversold bounce finally occurred on Wednesday, helping the Dow surge a whopping 619 points to its largest single day rally since the 2008 financial crisis! The rally was attributed to FOMC Vice Chair William Dudley, who said a case for a September rate hike seems less compelling than it was a few weeks ago. Durable goods rose 2%, beating estimates for -0.4%.
[/su_spoiler]
[su_spoiler title=”Thursday-Friday’s Action: Wild Action Continues” style=”fancy”]
Thursday was another volatile session on Wall Street after China intervened again in their markets. Bloomberg reported, “Less than an hour before the close today the Shanghai Composite Index turned negative, dropping almost 1 percent before going on an astonishing rally in the last 45 minutes of trading to finish the session 5.3 percent higher. According to people familiar with the matter, the late-day rally was sparked by Chinese government intervention, which aimed to stabilize the equity market ahead of a military parade on September 3.” Central bankers around the world met in their annual Jackson Hole conference in Wyoming. This year’s conference, titled “Inflation dynamics and monetary policy” will focus on helping increase inflation around the globe. U.S. GDP rose 3.7%, beating estimates for 3.2%. Jobless claims came in at 271k, barely missing estimates for 270k. Pending home sales rose 0.5%, missing estimates for 1%. The Kansas City Fed Manufacturing Index plunged to -9, missing estimates for -4. Stocks were relatively quiet on Friday as investors paused to digest this week’s wild action. Personal income matched estimates for 0.4%. Finally consumer confidence came in 91.9, missing estimates for 93.3.
[/su_spoiler]
[su_spoiler title=”Market Outlook:” style=”fancy”]
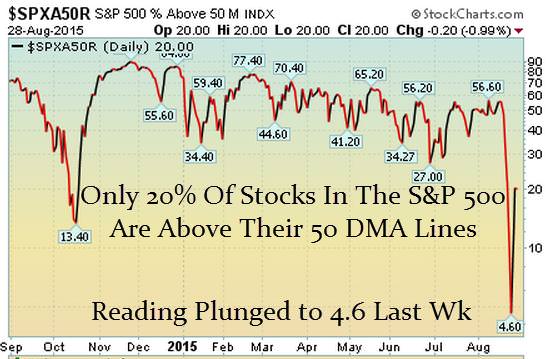
20% Of Stocks in the S&P 500 Are Above Their Respective 50 DMA
(Market Tends To Turn When This Reading Gets Above 70% or Below 40%)
Observation: Readings above 70% usually (not always) correspond with a short-term pullback
Conversely, reads below 40% usually (not always) correspond with a short-term bounce
[/su_spoiler]
[su_spoiler title=”FLS Conviction Leaders List” style=”fancy”]
The damage last week was severe. The market is now on the cusp of rolling over and forming a new downtrend. We do not like to buy new stocks during a downtrend and “leadership” changes drastically during a downtrend. This list will be updated to reflect the “changing” landscape over the next few weeks.
- AAPL – HUGE positive reversal last week. More time needed before entry point emerges
- AMZN – Big support week – remains one of the strongest performing stocks in the market
- EA – Plunged and closed below its 50 DMA line last week for the first time since Oct 2014
- FB – HUGE positive reversal last week. 50 DMA line is resistance
- FLT – Big reversal last week closed near upper half of weekly range and near its 200 DMA line
- GOOG – Very large positive reversal last week and remains one of the strongest stocks in the market
- NFLX – Huge positive reversal last week and remains one of the strongest stocks in the market
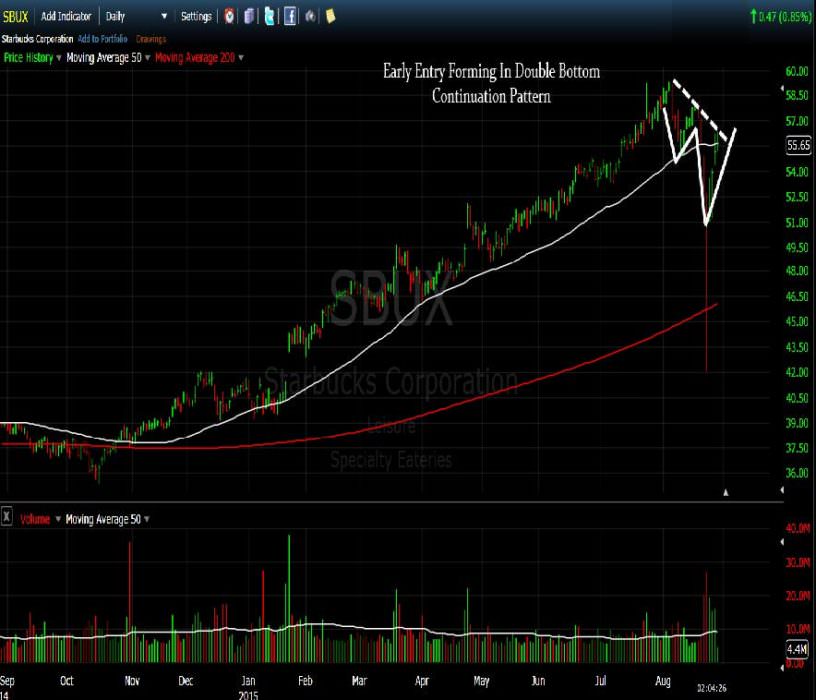
- SBUX – Extremely large weekly range
- TSLA – Big weekly range. Closed in b/w 200 and 50 dma lines
- UA – Big positive reversal last week and closed above 50 DMA line. Remains a very strong stock
- V – Another wild positive reversal last week. Closed near 50 DMA line and remains strong stock
[/su_spoiler]
[su_spoiler title=”7 New Setups” style=”fancy”]
(We like to be aligned with “BIG” trends. Right now, the big trend is UP – weekly and monthly charts). Once a new downtrend forms – there will more bearish setups)
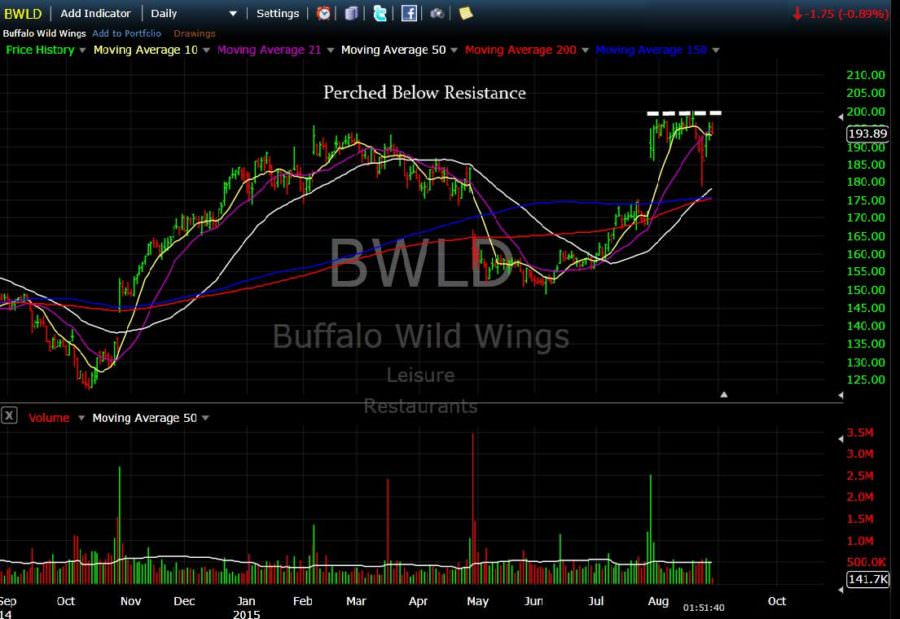
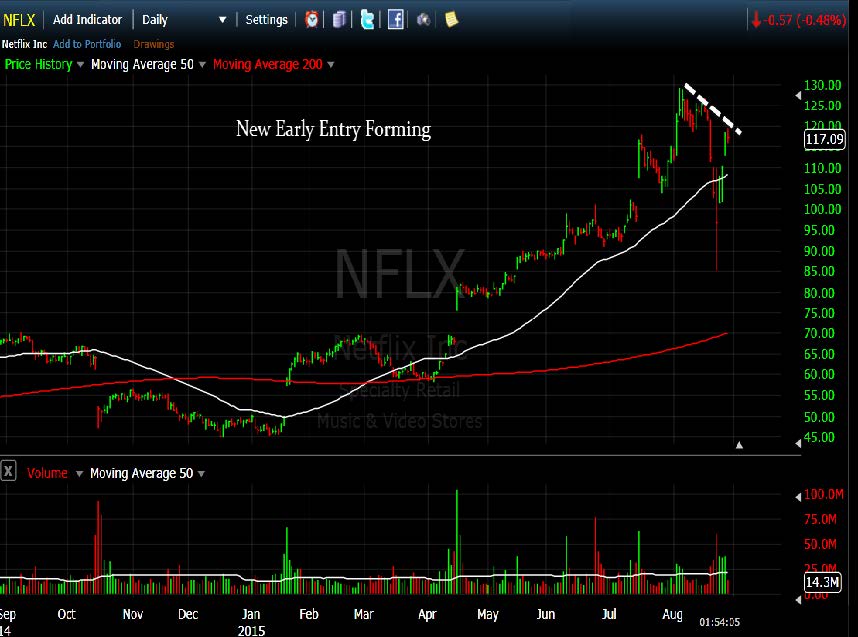
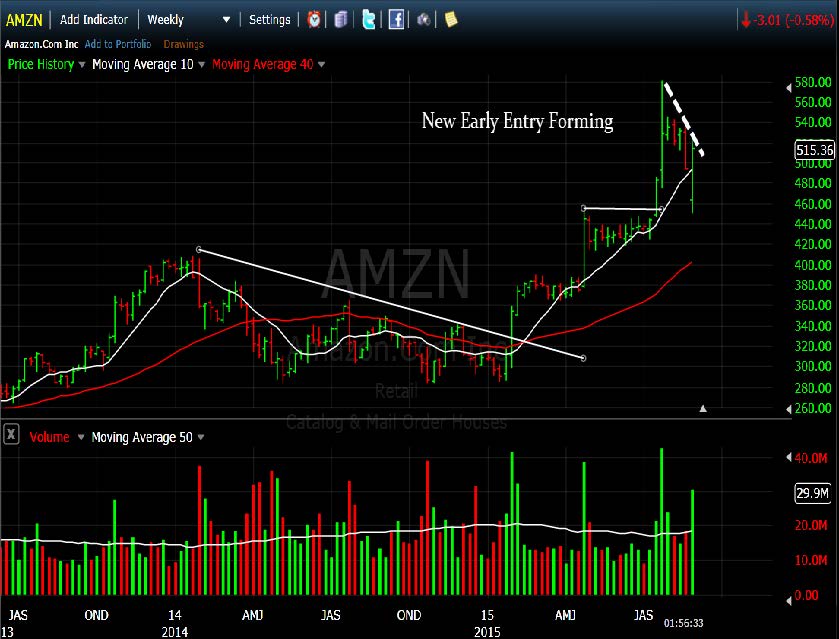
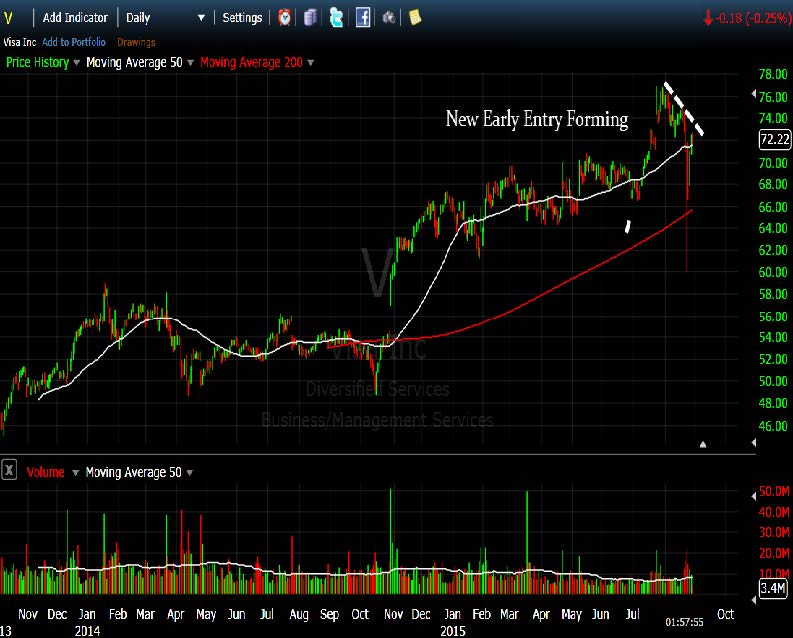
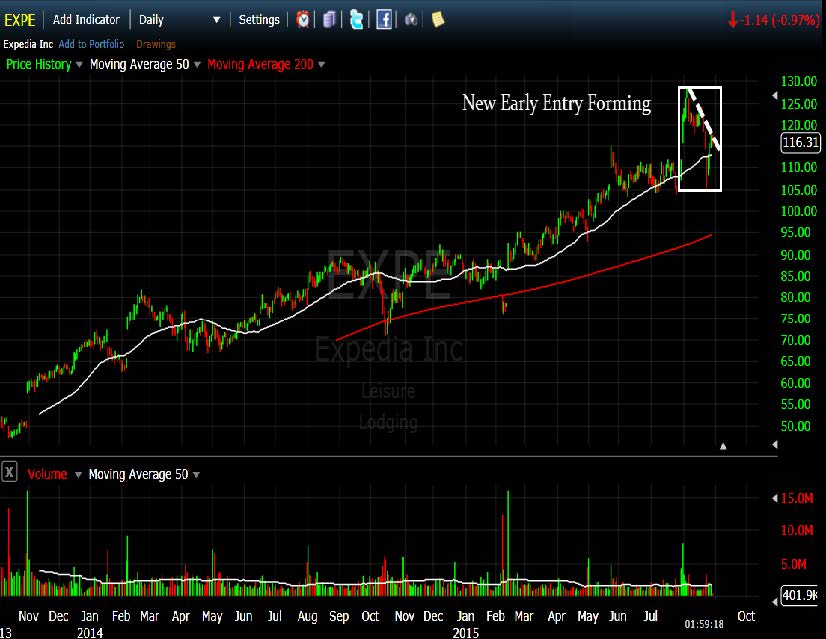
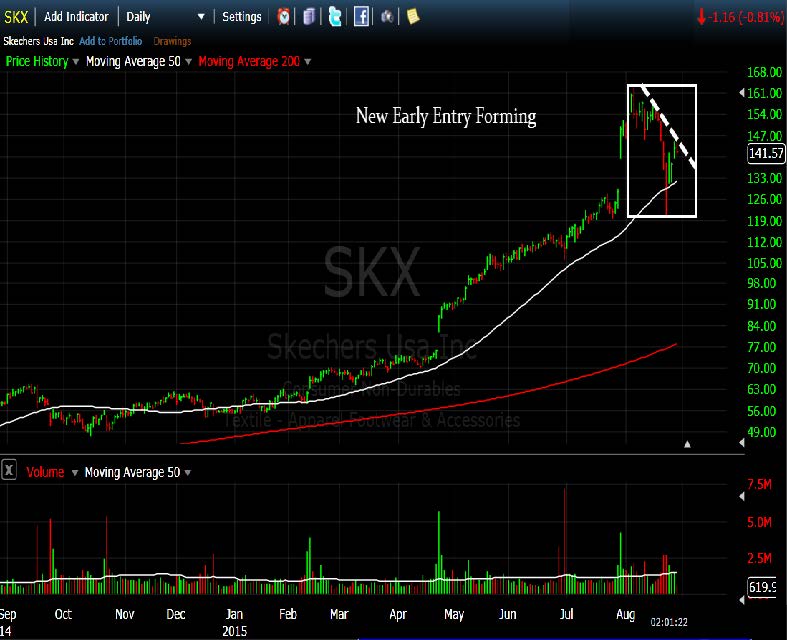
These hand-picked stocks are carefully selected to help with your idea generation and offer you additional setups each week. The setups are based on our proprietary criteria and offer advanced (dotted line) & classic long and short entry points (solid line). Short patterns are typically mirror images of long patterns.
Note: Please Verify All Earnings Dates/Data from Multiple Sources for Every Stock in all our report(s).
Charts Courtesy of FreeStockCharts.com and/or Stockcharts.com
BWLD: Perched Below Resistance
NFLX: New Early Entry Forming
AMZN: New Early Entry Forming
V: New Early Entry Forming
EXPE: New Early Entry Forming
SKX: New Early Entry Forming
SBUX: New Early Entry Forming
[/su_spoiler]
[su_spoiler title=”Strongest Sectors, Groups, & Symbols” style=”fancy”]
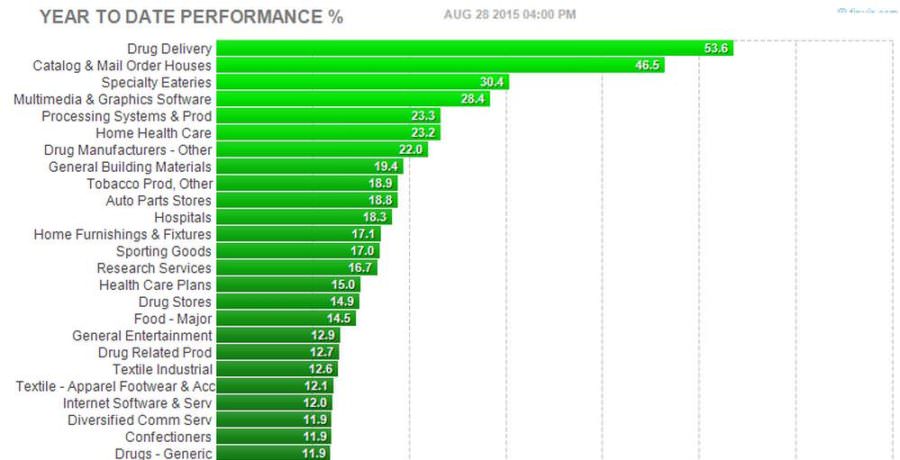
[su_heading style=”modern-1-dark” size=”18″]Strongest Sectors [/su_heading]
[su_heading style=”modern-1-dark” size=”18″]Strongest Groups [/su_heading]
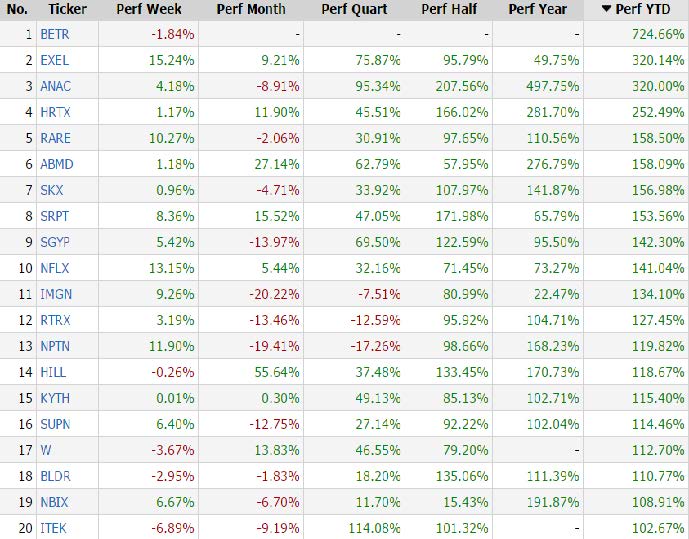
[su_heading style=”modern-1-dark” size=”18″]Strongest Stocks Of The Year[/su_heading]
These are the top 20 strongest performing tickers on a year-to-date basis that are trading over $5, average daily volume over 500k and have a market cap >300M (Small cap-Mega Cap) –pls ignore BETR—
[/su_spoiler]


