

[su_heading style=”modern-2-dark” size=”20″] Market Update [/su_heading]
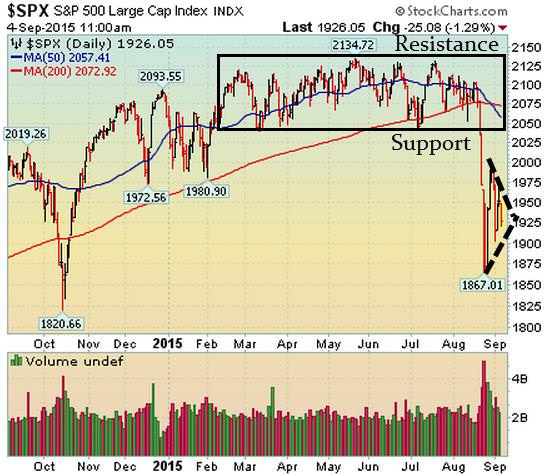
In the short term, the next level of support is 1867 in the S&P 500 and the next level of resistance is 1993. By definition, until either level is breached we expect sideways action to continue. Stocks ended lower last week ahead of the long holiday weekend. In our last FLS weekly report we wrote, “Typically, massive sell-offs do not recover overnight. Additionally, massive selloffs followed by record volatility leads to lower, not higher, prices – especially when they occur in aging bull markets. Right now, nearly every major market around the world is trading like a penny stock (wild percent swings – up and down) and that typically bodes poorly for stocks. The only wild card remains the Fed and other government intervention.” We would be remiss not to note that the major indices are very extended to the downside and a slight bounce higher (in normal periods) should be expected. The inability for the market to bounce illustrates how weak it is. Now that the jobs report is behind us – the next “big” data point will come on September 17 when Fed concludes its next meeting and holds a press conference. Until then, economic data remains relatively light. Remember, the Fed has put on the perfect hedge by saying they are data dependent: If the data improves it gives them the option to raise rates and if the data deteriorates (present situation) they can easily justify not raising rates and/or another round of QE (printing money). The problem is that even with rates at zero and other central banks printing money, global economic demand remains lackluster at best. So the Fed’s conundrum is that Main Street is barely growing, even with rates at zero. The “data” does not justify a rate hike at this point. Canada, Japan and Australia are in recessions and global economic growth is slowing markedly. Intermediate and longer term, markets around the world are clearly forecasting another global recession and, notwithinstanding more Fed easing, the path of least resistance is lower for stocks. Defense is king until the S&P 500 trades above 2040. On the downside, if 1867 is breached we have to expect another BIG leg lower for stocks.
Here are the Percent Declines From the 2015 High to Aug 2015’s Low
[su_table]
| Date | Market | High | Low | % Change | Monday’s Low |
| 05/19/15 | DJIA | 18351.36 | 15370.33 | -16.24% | 08/24/15 |
| 05/20/15 | SPX | 2134.72 | 1867.01 | -12.54% | 08/24/15 |
| 07/20/15 | Comp | 5231.94 | 4292.15 | -17.96% | 08/24/15 |
| 06/23/15 | RUT | 1296 | 1105.93 | -14.67% | 08/24/15 |
[/su_table]
[su_heading style=”modern-2-dark” size=”20″] Portfolio Update [/su_heading]
The FLS portfolio is enjoying a very healthy 2015 and is in cash at this point. Our discipline requires us to let some more time pass before getting involved on either the long or short side.
[su_heading style=”modern-1-dark” size=”18″] Positions [/su_heading]
- [dummy_text]
[su_heading style=”modern-1-dark” size=”18″] Positions & Working Orders [/su_heading]
There are no open positions or working orders right now
[su_heading style=”modern-2-dark” size=”20″] Analyzing The S&P 500’s Latest Moves (Up & Down) [/su_heading]
[dummy_text]
[su_table]
| Pullback | Rally | |||||
| High | Low | % Change | Low | High | % Change | |
| SPX | 2132.8 | 1970 | -7.36% | 1867 | 1993 | 6.75% |
| SPX | 2134.7 | 2044.02 | -4.25% | 2044 | 2126.64 | 4.04% |
| SPX | 2129.9 | 2056.32 | -3.45% | 2039.77 | 2134.72 | 4.66% |
| SPX | 2134.7 | 2085.67 | -2.30% | 1980.9 | 2119.59 | 7.00% |
| SPX | 2119.6 | 2039.69 | -3.77% | 1972.6 | 2093.55 | 6.13% |
| SPX | 2093.6 | 1980 | -5.42% | 1820 | 2079.47 | 14.26% |
| SPX | 2079.5 | 1972.56 | -5.14% | 1904 | 2019.26 | 6.05% |
| SPX | 2019 | 1820 | -9.86% | 1814 | 1991 | 9.76% |
| SPX | 1991 | 1904 | -4.37% | 1737 | 1897 | 9.21% |
| SPX | 1897 | 1814 | -4.38% | 1646 | 1850 | 12.39% |
| SPX | 1850 | 1737 | -6.11% | |||
| SPX | 1729 | 1646 | -4.80 | |||
| Avg Pullback | -5.12% | Avg Gain | 8.03% | |||
[/su_table]
[su_heading style=”modern-2-dark” size=”20″] Chart of the Week: Does This Data Look “Strong?” [/su_heading]
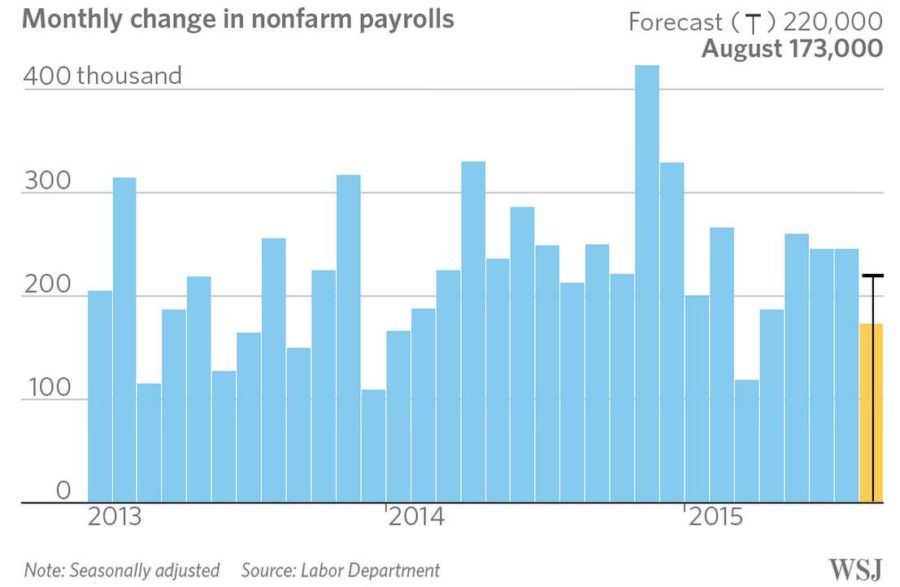
[image]
[su_heading style=”modern-2-dark” size=”20″] Year-To-Date Scorecard [/su_heading]
Nasdaq Composite -1.1%, S&P 500 -6.7% YTD, Russell 2k -5.6%, DJ Industrials -9.7%
[su_heading style=”modern-1-dark” size=”18″] Key Points [/su_heading]
- Uptrend: Short-Term & Intermediate Sideways & Long-Term Up
- SPX Support, 1867.01
- SPX Resistance: 1993, 2040
- Sarhan’s Crowd Behavior Index: Neutral
(Properitary market indicator that measures crowd sentiment: Bullish Bearish or Neutral)
[su_heading style=”modern-1-dark” size=”18″] Global Macro Update [/su_heading]
[su_row]
[su_column size=”1/2″]
- Stocks: Sideways
- Bonds: Uptrend
- Currencies (Euro/USD): Sideways
- Softs: Downtrend
[/su_column]
[su_column size=”1/2″]
- Energy: Downtrend
- Metals: Downtrend
- Grains: Downtrend
[/su_column]
[/su_row]
[su_spoiler title=”Monday-Wednesday’s Action: Wild Swings Continue” style=”fancy”]
Stocks fell on Monday on the latest trading day of the month. The major U.S. indices fell over 6% in August, posting their worth monthly decline in several years. The big news came from Oil. Oil prices continued their week-long surge. Over the past 5 days oil surged a whopping +29%, after falling -37% in the past 10 weeks! It’s not just crude, stocks, currencies and commodities are trading all over the map. The fact that global markets are trading like penny stocks bodes poorly for our market and suggests lower prices will follow.
The Dow fell 469 points on Tuesday after China’s official Purchasing Managers Index slid to 49.7, the lowest level in three years and reignited growth concerns. The reading missed estimates and fell below July’s reading of 50. Remember a reading below 50 indicates contraction and bodes poorly for the global growth story. In the US, the PMI manufacturing index slid to 53 which matched the low end of estimates. The ISM manufacturing index slid to 51.1, missing estimates for 52.8. Crude oil plunged nearly 10% on the news for its largest decline in 7 months. This followed its largest advance in 25 years! As previously mentioned, the fact that global markets are trading like penny stocks is typically not a good sign.
Stocks rallied nicely on Wednesday after China’s Shanghai composite ended down 0.2% after falling nearly 5% intraday. The very powerful late day reversal to the upside set the stage for US stocks to rally and was believed to be from people supported directly by the government. Very fun times we live in! The Markets in China will be closed on Thursday and Friday due to a World War II anniversary holiday. In the US, the ADP private employment index came in at 190k, missing estimates for around 200k. Factory orders came in at 0.4%, missing estimates for 0.9%. At 2pm EST, the Fed’s Beige Book, which will be used in their next meeting on September 17, 2015, showed moderate to modest growth in 11 of the 12 districts across the country.
[/su_spoiler]
[su_spoiler title=”Thursday-Friday’s Action: Stocks Fall Ahead Of The Long Weekend” style=”fancy”]
Stocks were quiet on Thursday as the market paused to digest the wild swings we have seen nearly everyday for the past few weeks. Economic data was light. In the US, the PMI service index came in at 56.1, beating estimates for 55.2. The ISM service index came in at 59, barely beating estimates for 58.5. Stocks opened lower on Friday after August’s jobs report was released and the headline number missed estimates. Before Friday’s open, the Labor Department said U.S. employers added 173k new jobs in August, missing Bloomberg’s estimate for 223k. The unemployment rate slid to 5.1%, beating estimates for 5.2%. 15 minutes before the report was released Fed official Jeffrey Lacker said in a pre-scheduled speech, that “It’s Time for Fed to End Era of Zero Interest Rates and that August’s jobs report is unlikely to “materially alter” the picture. For the last few weeks, we have seen conflicting opinions from within the Fed on when they should raise rates. That uncertainty continues to hurt investor confidence. The U.S. stock market will be closed on Monday in observance of the Labor Day Holiday.
[/su_spoiler]
[su_spoiler title=”Market Outlook” style=”fancy”]
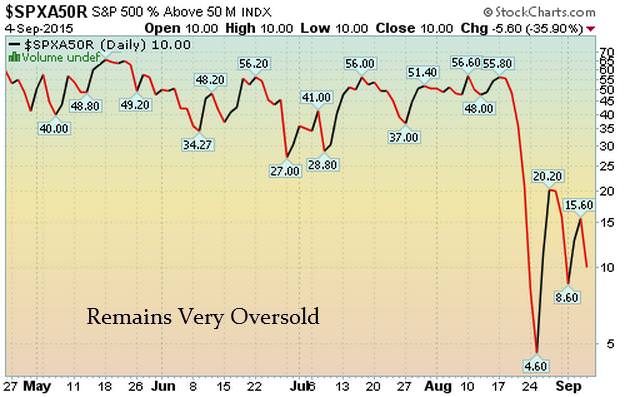
Only 10% Of Stocks in the S&P 500 Are Above Their Respective 50 DMA
(Market Tends To Turn When This Reading Gets Above 70% or Below 40%)
Observation: Readings above 70% usually (not always) correspond with a short-term pullback
Conversely, reads below 40% usually (not always) correspond with a short-term bounce
[/su_spoiler]
[su_spoiler title=”FLS Conviction Leaders List” style=”fancy”]
The damage last week was severe. The market is now on the cusp of rolling over and forming a new downtrend. We do not like to buy new stocks during a downtrend and “leadership” changes drastically during a downtrend. This list will be updated to reflect
- AAPL – Fell last week as it continues trading near 109…
- AMZN – Continues flirting with its 50 DMA line
- EA – Continues “living” below its 50 DMA line. New downtrend forming
- FB – 50 DMA line is resistance
- FLT – Second week below 200 DMA line
- GOOG – Slid last week as it continues to trade near its 50 DMA line
- NFLX – Fell hard last week and closed below 50 DMA line
- SBUX – Fell last week. 50 DMA line is resistance
- TSLA – Closed between 200 and 50 dma line. 50 dma is resistance and 200 is near-term support
- UA – Continues exhibiting very strong relative strength
- V – Forming nice downtrend line as it pulls back alongside the market
[/su_spoiler]
[su_spoiler title=”7 New Setups” style=”fancy”]
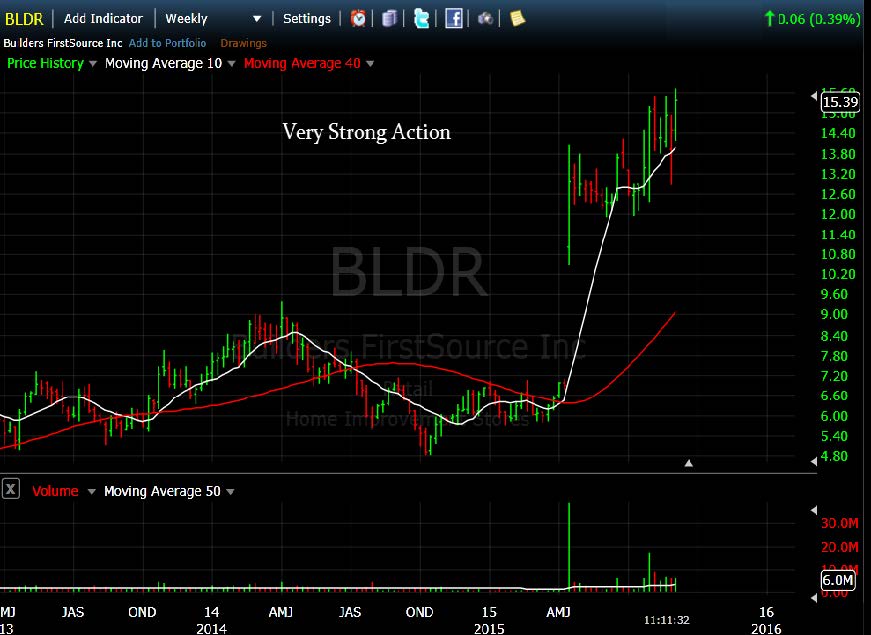
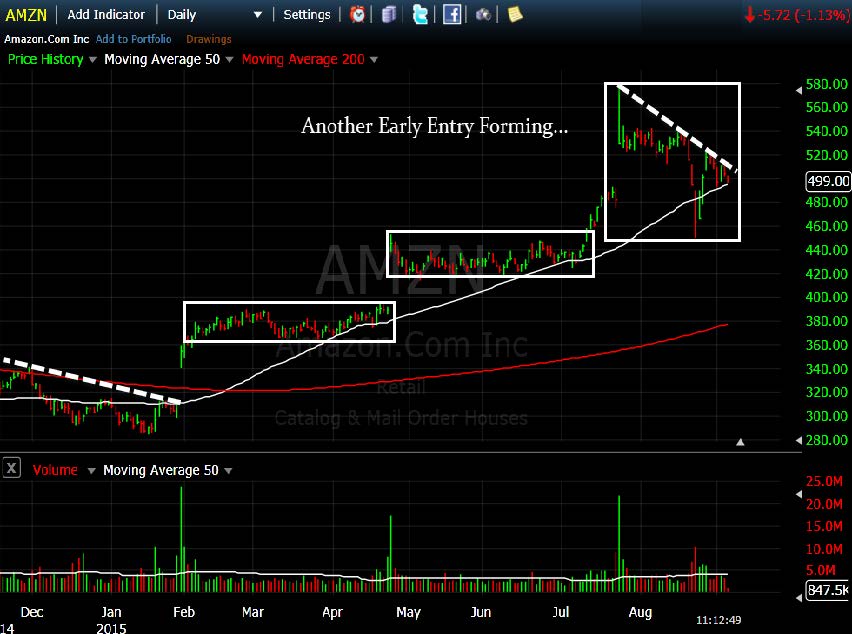
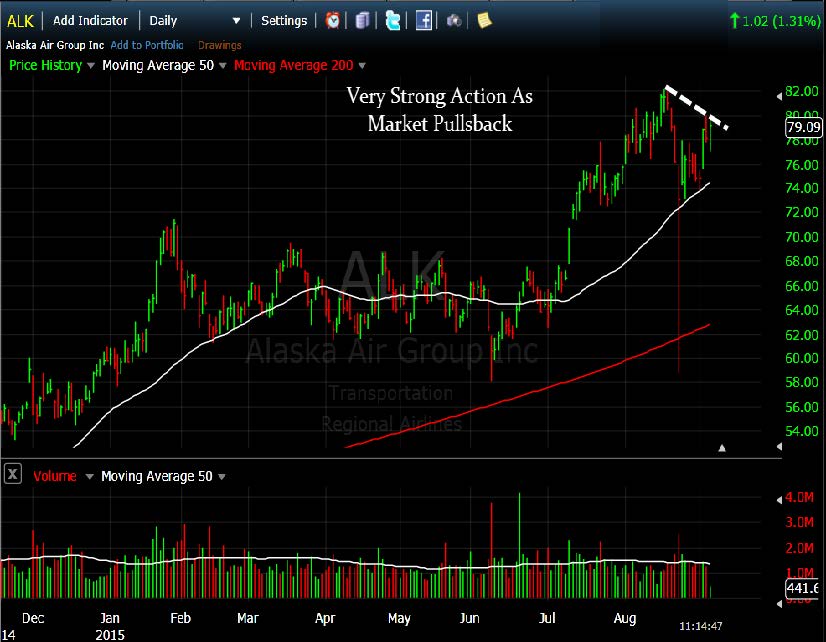
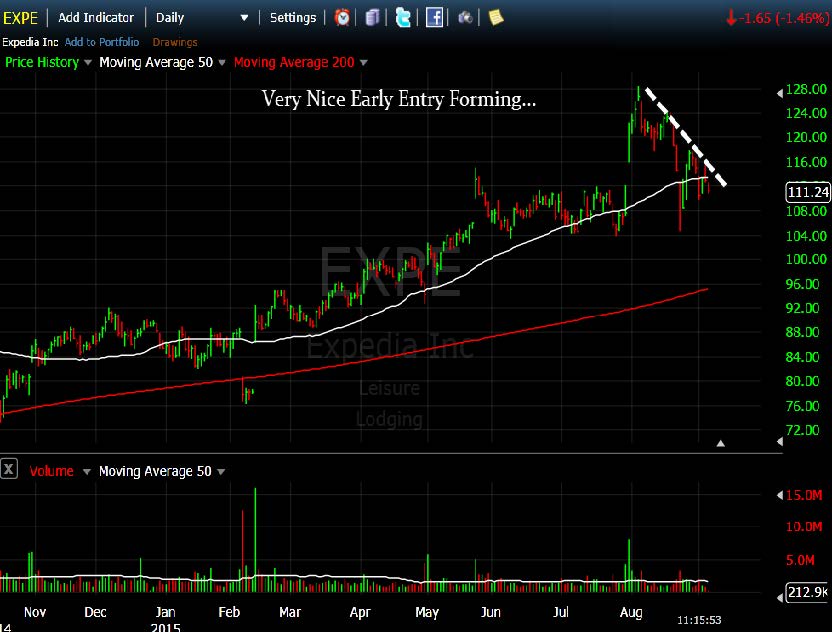
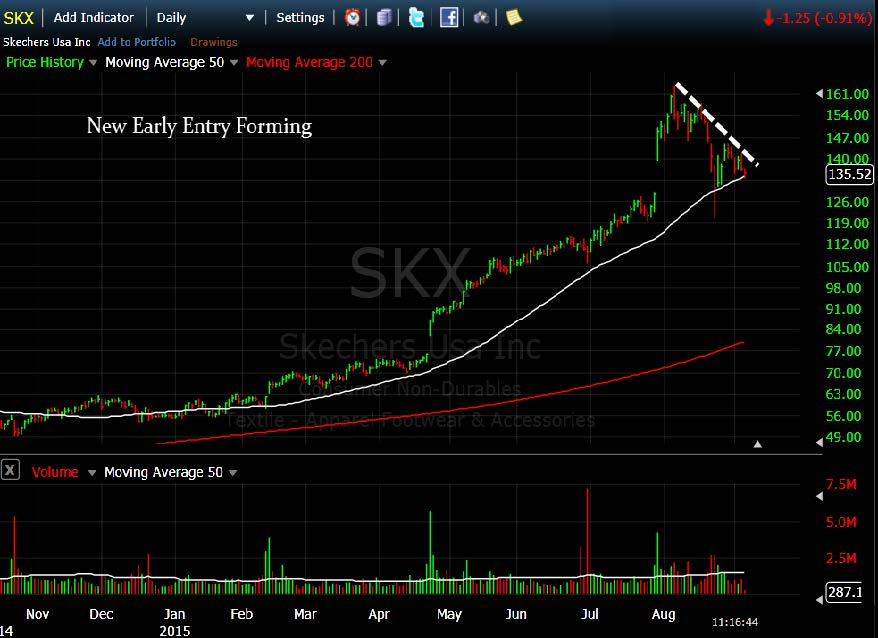
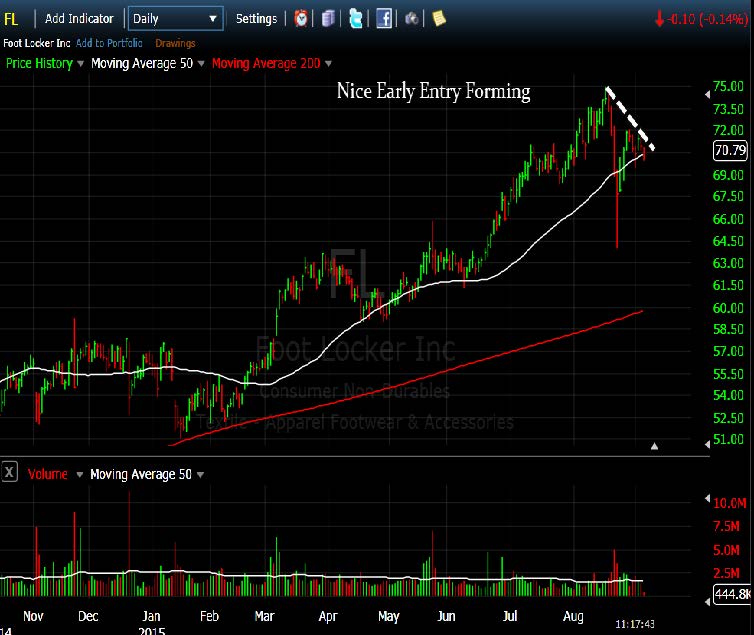
These hand-picked stocks are carefully selected to help with your idea generation and offer you additional setups each week. The setups are based on our proprietary criteria and offer advanced (dotted line) & classic long and short entry points (solid line). Short patterns are typically mirror images of long patterns.
Note: Please Verify All Earnings Dates/Data from Multiple Sources for Every Stock in all our report(s).
Charts Courtesy of FreeStockCharts.com and/or Stockcharts.com
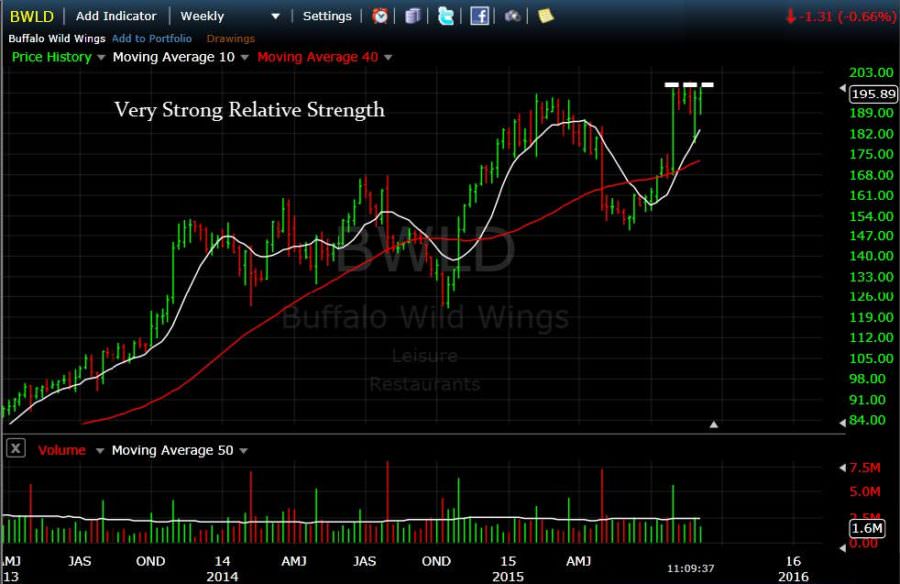
BWLD: Perched Below Resistance
BLDR: Very Strong Action
AMZN: New Early Entry Forming
ALK: New Early Entry Forming
EXPE: New Early Entry Forming
SKX: New Early Entry Forming
FL: New Early Entry Forming
[/su_spoiler]
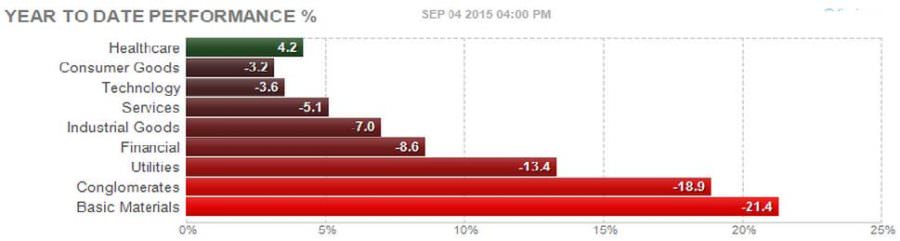
[su_spoiler title=”Strongest Sectors, Groups, & Symbols” style=”fancy”]
[su_heading style=”modern-1-dark” size=”18″]Year To Date Sector Performance [/su_heading]
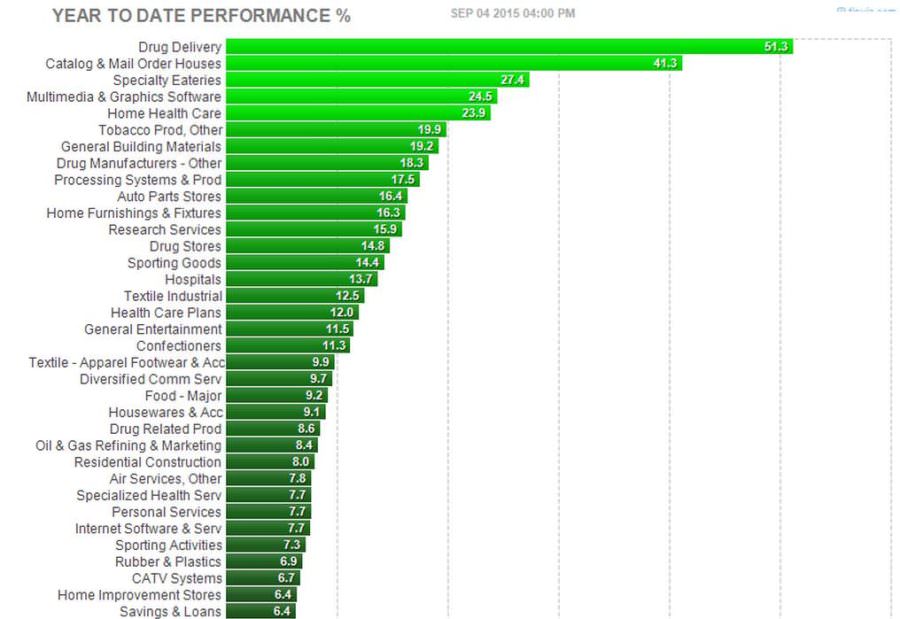
[su_heading style=”modern-1-dark” size=”18″]Year To Date Group Performance [/su_heading]
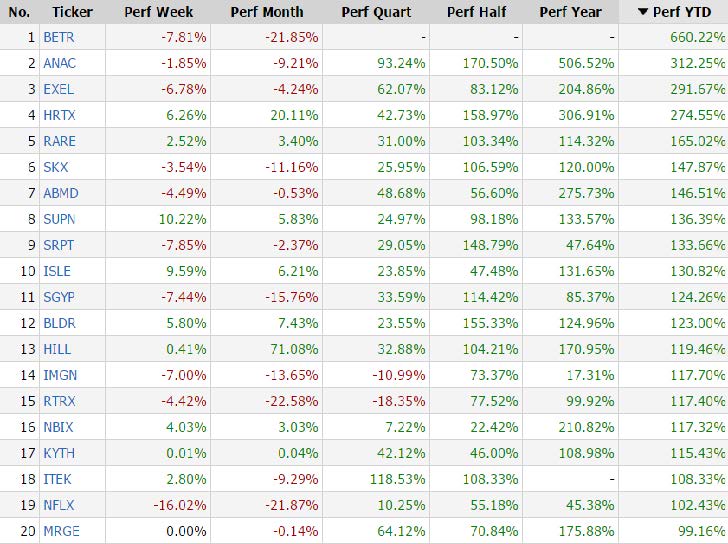
[su_heading style=”modern-1-dark” size=”18″]Strongest Performing of the Year [/su_heading]
These are the top 20 strongest performing tickers on a year-to-date basis that are trading over $5, average daily volume over 500k and have a market cap >300M (Small cap-Mega Cap) –Pls ignore BETR—
[/su_spoiler]


