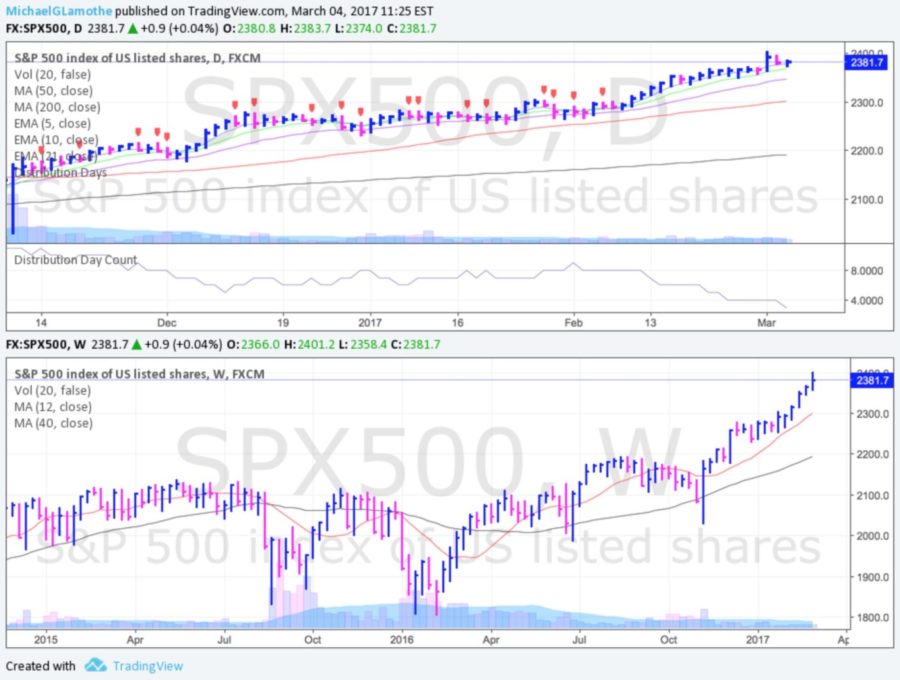
Stocks ended mixed to mostly higher for a sixth straight week, literally every week Trump has been in office. Small caps lagged and ended lower which is a sign of near-term fatigue. Remember, markets do not go straight up. At this point, it is perfectly normal to see the market pause and digest the recent and very strong rally.
Under the surface, not much as changed. The more we scan the market and look at leading stocks, sectors and industry groups, the more this feels like the very early stages of a 1999/1929 style climax/blow-off top. Of course, we are open for any possible scenario that may unfold but, for now, we are in a very strong bull market and weakness should be bought, not sold.
The strength is broad based as big money continues to flow into the major indices and several important sectors: Financials ($XLF), Materials ($XLB), Industrials ($XLI), Steel ($SLX), and Technology, just to name a few. As long as pullbacks remain very shallow in both size (small % decline) and scope (short in duration), the bulls remain in clear control of this market. The first level of support to watch is 10 day moving average, then the 21 DMA, then the 50 DMA for the major indices.
A Closer Look at What Happened Last Week…
Mon-Wed Action:
 Stocks were relatively quiet on Monday as the world waited for President Trump to address Congress. Over the weekend, Warren Buffett said he was still bullish on U.S. stocks and said America’s best days are ahead of us. Elsewhere, David Tepper, billionaire hedge fund manager, said he’s still long stocks and short bonds.
In economic news, durable goods orders rose +1.8% in January, slightly above the expected 1.7% estimate. Separately, Pending home sales, fell -2.8% in January and hit their lowest level in a year.
 Stocks fell on Tuesday as the world waited for President Trump to deliver his first official speech to Congress. Economic news was mixed. The second reading on Q4 2016 GDP came in at 1.9%, missing estimates for 2.1%. The S&P Corelogic Case-Shiller Home Price Index came in at 0.9%, beating estimates for 0.7%. Elsewhere, Chicago PMI came in at 57.4, beating estimates for 53.0. The Richmond Fed Manufacturing index came in at 17, higher than the last reading of 12. Finally, consumer confidence jumped to 114.8, easily beating the Street’s estimate for 111.3. After Tuesday’s close, Trump gave a speech to Congress and stocks soared on Wednesday. The Dow vaulted above 21,000 and soared over 300 points! Clearly, the market continues to give Trump the bullish benefit of the doubt.
Thur & Fri Action:
 Stocks fell on Thursday as the market finally pulled back from deeply overbought conditions. Snap — the parent company for social media platform Snapchat — finally IPO’d and its stock jumped over 40% from the IPO price of $17 a share. Separately, Attorney General Sessions said he will recuse himself from investigations related to Trump’s campaign and Russia. Separately, Caterpillar’s stock fell after a few government agencies raided three of its offices. Stocks were very quiet on Friday after Yellen left the door open for a rate hike in March.
Market Outlook: Strong Action Continues
The market remains strong as the major indices continue to hit fresh record highs. The bulls have a very strong fundamental backdrop of monetary and now fiscal policy. The ECB extended QE in December and will print another 2.4T to stimulate markets and the global economy. The U.S. Fed only raised rates once in 2016, by a quarter point to 0.50%, which, historically, is still very low. On the fiscal side, Trump’s pro-growth policies are received well. As always, keep your losses small and never argue with the tape.


