

[su_heading style=”modern-2-dark” size=”20″] Market Update: Bulls Remain In Control [/su_heading]
Stocks ended mixed last week as investors digested the latest round of mixed economic and earnings data. In the short term, the market looks a little extended and due for a little pullback to digest its recent gain. The big take-away is that the stock market remains strong as we have yet to see any conclusive “data” that suggests the Fed should raise rates anytime soon. In fact, most of the data continues to be lackluster at best which means the “data-dependent” Fed will likely not raise rates anytime soon (which, for now, is bullish for stocks). Looking at earnings, so far, approximately 481 companies in the S&P 500 (96%) have reported Q1 results and 63% have had a positive EPS surprise and 33% had a negative EPS surprise with the reminder meeting estimates. The fact that the market has edged higher since earnings season began bodes well for this aging bull market and suggests higher prices will likely follow, for now. History shows us that some of the market’s strongest performers occur from big gaps up on earnings and some of the weakest stocks gap down after reporting numbers. The big winners (so far) from earnings season include: Amazon.com ($AMZN), Netflix ($NFLX), Hasbro ($HAS), Domino’s Pizza ($DPZ), Skechers ($SKX), Dunkin (Donuts) Brands Group ($DNKN), Microsoft Corp ($MSFT), O’Reilly Automotive ($ORLY), and YUM Brands ($YUM), Skywest ($SKYW), Web.com ($WWWW), Equinix ($EQIX), Styngenta ($SYT), Nutri System ($NTRI), Brink’s Co ($BCO), Teradyne Inc ($TER), Skyworks Solutions ($SWKS), GoPro ($GPRO), Estee Lauder ($EL), Abiomed Inc ($ABMD), Golar LNG ($GLNR), Energizer Holdings ($ENR), RetailMeNot, Inc ($SALE), Herbalife ($HLF), BlueBird Bio ($BLUE), HubSpot Inc ($HUBS), Alibaba Group ($BABA), Qorvo Inc ($QRVO), Visteon Copr ($VC), Norwegian Cruise Line Holdings ($NCLH).
[su_heading style=”modern-2-dark” size=”20″] Portfolio Update [/su_heading]
Thankfully, FLS has navigated the market rather well. To protect our portfolio, we are moving our stops up wherever possible. Here is a snapshot of the FLS portfolio as of Friday’s close.
[su_heading style=”modern-1-dark” size=”18″] Positions [/su_heading]
- The service owns: TSLA +21.03%, GDX -1.25%, AAPL +1.95%, NFLX +7.94%, REGN +5.71%, SWKS +5.14%, XLF -0.04%, MTH -1.86%, HACK 0.16%
- The service will exit: TSLA @ 234.87, GDX @ 19.24, AAPL @ 128.26, NFLX @ 576.13, REGN @ 486.10, SWKS @ 99.57, XLF @24.03, MTH @ 43.25, HACK @ 28.69
[su_heading style=”modern-1-dark” size=”18″] Working Buy Orders [/su_heading]
There are no new orders…
[su_heading style=”modern-2-dark” size=”20″] Analyzing The S&P 500’s Latest Moves (Up & Down) [/su_heading]
[dummy_text]
[su_table]
| Pullback | Rally | |||||
| High | Low | % Change | Low | High | % Change | |
| SPX | 2119.59 | 2039.69 | -3.77% | 2039.69 | 2134.72 | 4.66% |
| SPX | 2093.55 | 1980 | -5.42% | 1980.9 | 2119.59 | 7.00% |
| SPX | 2079.46 | 1972.56 | -5.14% | 1972.56 | 2093.55 | 6.13% |
| SPX | 2019 | 1820 | -9.86% | 1820 | 2079.47 | 14.26% |
| SPX | 1991 | 1904 | -4.37% | 1904 | 2019.26 | 6.05% |
| SPX | 1897 | 1814 | -4.38% | 1814 | 1991 | 9.76% |
| SPX | 1850 | 1737 | -6.11% | 1737 | 1897 | 9.21% |
| SPX | 1729 | 1646 | -4.80% | 1646 | 1850 | 12.39% |
| Avg Pullback | -5.48% | Avg Gain | 9.63% | |||
[/su_table]
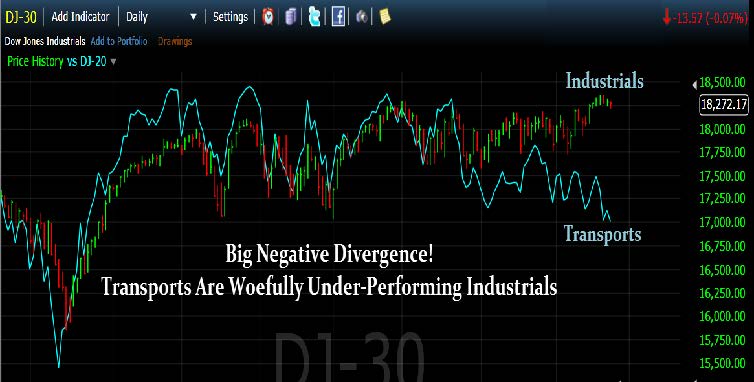
[su_heading style=”modern-2-dark” size=”20″] Chart of the Week [/su_heading]
Dow Industrials vs Dow Transports
[su_heading style=”modern-2-dark” size=”20″] 2015 Scorecard [/su_heading]
[dummy_text]
[su_heading style=”modern-1-dark” size=”18″] Key Points [/su_heading]
- Uptrend: Short-Term, Intermediate & Long Term Remain Strong
- SPX Support = 2119, 2039, 1980, 1972, 1904, 1820
- SPX Resistance = N/A
- Sarhan’s Crowd Behavior Index: Neutral
(Proprietary market indicator that measures crowd sentiment: Bullish Bearish or Neutral)
[su_heading style=”modern-1-dark” size=”18″] Global Macro Update [/su_heading]
[su_row]
[su_column size=”1/2″]
- Stocks: Uptrend
- Bonds: Looks Toppy
- Currencies (Euro/USD): Sideways
- Softs: Downtrend
[/su_column]
[su_column size=”1/2″]
- Energy: Uptrend
- Metals: Sideways
- Grains: Downtrend
[/su_column]
[/su_row]


