

[su_heading style=”modern-2-dark” size=”20″] Market Update [/su_heading]
Stocks Fall As Incoming “Data” Is Mixed
Stocks fell last week as the incoming “data” remained mixed which does not provide more clarity regarding when the Fed will raise rates. Remember the Fed has a dual mandate: help the economy and keep inflation near its 2% target. Right now, both objectives are not being met which reduces the chance of an imminent rate hike from the Fed. We would argue that more “data” needs to be released before the Fed can raise rates. The Fed has made it abundantly clear that they remain data-dependent and will not raise rates until the “data” improves. Remember, the Fed has a dual mandate: Help the economy and keep inflation near its 2% target. Right now, neither objective is being met which is why we do not think the Fed will raise rates until the “data” improves.
[su_heading style=”modern-2-dark” size=”20″] Portfolio Update [/su_heading]
Thankfully, FLS has navigated the market rather well. Here is a snapshot of the FLS portfolio as of Friday’s close.
[su_heading style=”modern-1-dark” size=”18″] Positions [/su_heading]
- The service owns: TSLA +21.72%, AAPL -1.04%, NFLX +9.91%, REGN +10.96%, SWKS +6.20%, XLF -0.32%, HACK +4.07%
- The service will exit: TSLA @ 234.87, AAPL @ 128.26, NFLX @ 576.13, REGN @ 486.10, SWKS @ 99.57, XLF @24.03, HACK @ 28.69
[su_heading style=”modern-1-dark” size=”18″] Working Buy Orders [/su_heading]
[su_table]
| Status | Order | Ticker | Buy Stop | Protective Sell Stop | Risk from Entry |
| Working | BUY | AMZN | 439 | 414.55 | -5.57% |
| Working | BUY | DPZ | 111.43 | 105.14 | -5.64% |
| Working | BUY | MTH | 46.05 | 43.13 | -6.34% |
[/su_table]
[su_heading style=”modern-2-dark” size=”20″] Analyzing The S&P 500’s Latest Moves (Up & Down) [/su_heading]
Nearly every pullback has been shallow in both size (small percent decline) and scope (short in duration) which is bullish for this ongoing and very powerful rally.
[su_table]
| Pullback | Rally | |||||
| High | Low | % Change | Low | High | % Change | |
| SPX | 2134.7 | 2085.67 | -2.30% | 2039.7 | 2134.72 | 4.66% |
| SPX | 2119.6 | 2039.69 | -3.77% | 1980.9 | 2119.59 | 7.00% |
| SPX | 2093.6 | 1980 | -5.42% | 1972.6 | 2093.55 | 6.13% |
| SPX | 2079.5 | 1972.56 | -5.14% | 1820 | 2079.47 | 14.26% |
| SPX | 2019 | 1820 | -9.86% | 1904 | 2019.26 | 6.05% |
| SPX | 1991 | 1904 | -4.37% | 1814 | 1991 | 9.76% |
| SPX | 1897 | 1814 | -4.38% | 1737 | 1897 | 9.21% |
| SPX | 1850 | 1737 | -6.11% | 1646 | 1850 | 12.39% |
| SPX | 1729 | 1646 | -4.80 | |||
| Avg Pullback | -5.48% | Avg Gain | 9.63% | |||
[/su_table]
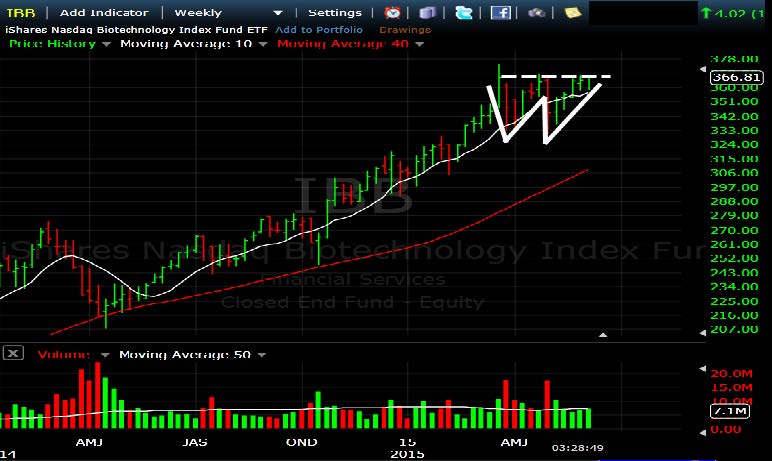
[su_heading style=”modern-2-dark” size=”20″] Chart of the Week [/su_heading]
Biotech ETF $IBB – About To Breakout Of A Bullish Double Bottom Continuation Pattern
[su_heading style=”modern-2-dark” size=”20″] 2015 Scorecard [/su_heading]
Nasdaq Comp +6.6% YTD, Russell 2k +4.6%, S&P 500 +1.6% YTD, DJ Industrials +0.2%
[su_heading style=”modern-1-dark” size=”18″] Key Points [/su_heading]
- Uptrend: Short-Term Pulling Back, Intermediate & Long Term Remain Strong
- SPX Support = 2067, 2039, 1980, 1972, 1904, 1820
- SPX Resistance = 2134.72
- Sarhan’s Crowd Behavior Index: Neutral
(Proprietary market indicator that measures crowd sentiment: Bullish Bearish or Neutral)
[su_heading style=”modern-1-dark” size=”18″] Global Macro Update [/su_heading]
[su_row]
[su_column size=”1/2″]
- Stocks: Uptrend
- Bonds: Downtrend
- Currencies (Euro/USD): Sideways
- Softs: Downtrend
[/su_column]
[su_column size=”1/2″]
- Energy: Uptrend
- Metals: Sideways
- Grains: Downtrend
[/su_column]
[/su_row]


