

[su_heading style=”modern-2-dark” size=”20″] Market Update [/su_heading]
A Big Top & Markets Are Forecasting A Global Recession
The damage last week was severe. The market is now on the cusp of rolling over and forming a new downtrend. We do not like to buy new stocks during a downtrend and “leadership” changes drastically during a downtrend. The sellers are clearly in control as stocks, currencies and a slew of commodities plunged across the globe last week and are now forecasting a global recession (if not worse). The selling finally spilled over to the major U.S. indices, sending them below very important support levels that we have highlighted repeatedly over the past few months (2,040 in the S&P 500). In a “normal” (non Easy Money) world, we would say without a shadow of a doubt that the market formed a major top over the past six months and we are now headed into a steep correction, if not worse. The major wild card remains the Fed and other central banks. The Fed still has rates at zero and we believe they stand ready to embark on another round of QE (printing money) if conditions worsen. Remember, the Fed has put on the perfect hedge by saying they are data dependent: If the data improves it gives them the option to raise rates and if the data deteriorates (present situation) they can easily justify another round of QE. The problem is that even with rates at zero and other central banks printing money, global economic demand remains lackluster at best. So the Fed’s conundrum is that Main Street is barely growing, even with rates at zero. At this point, markets around the world are clearly forecasting another global recession and notwithinstanding more Fed easing, the path of least resistance is lower for stocks. Defense is king until the S&P 500 trades above 2040.
[su_heading style=”modern-2-dark” size=”20″] Portfolio Update [/su_heading]
The FLS portfolio continues acting very well and is having a great year. The FLS portfolio and has been steadily trimming its holdings and locking in very nice gains over the past few months. We have received qutie a few emails thanking us for navigating an otherwise difficult period with grace and ease. Here are our last 10 trades going back to May and the results speak for themselves: UA +6.52%, XLF -3.38%, TSLA +20.07%, and NFLX +30.70%, FEYE -6.77%, DPZ -0.26%, & broke even with MTH, HACK, REGN, & SWKS. These are very good stats considering all the major indices are down year-to-date and the Dow is down 7%. When you have a chance, take a look at our report over the past few months and you will see how we successfully navigated this period. Over the past 6-8 weeks we exercised caution and a lot of patience and knew it was not an ideal environment to be aggressively buying stocks. Thankfully, our patience was rewarded and we will begin looking for new shorts in the near future – if this decline continues. Here is a snapshot of the FLS portfolio as of Friday’s close,
[su_heading style=”modern-1-dark” size=”18″] Positions [/su_heading]
- The service owns: AMZN +12.64%, REGN +1.19%
- The service will exit: AMZN @482, REGN @ 521
[su_heading style=”modern-1-dark” size=”18″] Working Orders [/su_heading]
The market is extended to the downside so there are no new orders today
[su_heading style=”modern-2-dark” size=”20″] Analyzing The S&P 500’s Latest Moves (Up & Down) [/su_heading]
Nearly every pullback has been shallow in both size (small percent decline) and scope (short in duration) which is bullish for this ongoing and very powerful rally.
[su_table]
| Pullback | Rally | |||||
| High | Low | % Change | Low | High | % Change | |
| SPX | 2132.8 | 1970 | -7.63% | 2044 | 2126.64 | 4.04% |
| SPX | 2134.7 | 2044.02 | -4.25% | 2039.73.45 | 2134.72 | 4.66% |
| SPX | 2129.9 | 2056.32 | -3.45% | 1980.9 | 2119.59 | 7.00% |
| SPX | 2134.7 | 2085.67 | -2.30% | 1972.6 | 2093.55 | 6.13% |
| SPX | 2119.6 | 2039.69 | -3.77% | 1820 | 2079.47 | 4.26% |
| SPX | 2093.6 | 1980 | -5.42% | 1904 | 2019.26 | 6.05% |
| 2079.5 | 1972.56 | -5.14% | 1814 | 1991 | 9.76% | |
| 2019 | 1820 | -9.86% | 1737 | 1897 | 9.21% | |
| 1991 | 1904 | -4.37% | 1646 | 1850 | 12.39% | |
| 1897 | 1814 | -4.38% | ||||
| SPX | 1850 | 1737 | -6.11% | |||
| SPX | 1729 | 1646 | -4.80% | |||
| Avg Pullback | -5.12% | Avg Gain | 8.17% | |||
[/su_table]
[su_heading style=”modern-2-dark” size=”20″] Chart of the Week [/su_heading]
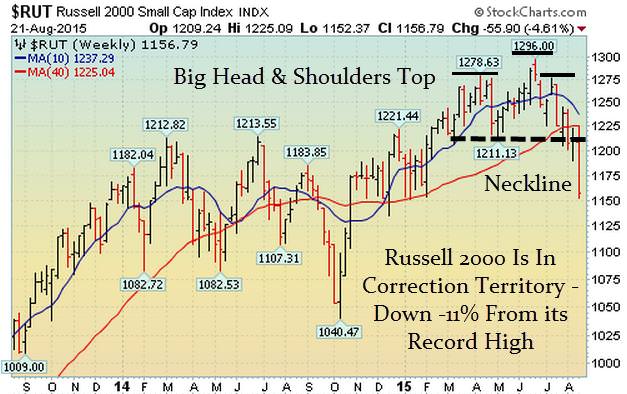
Small Cap Russell 2000 Is In Correction Territory & Down 11% From Its Record High
[su_heading style=”modern-2-dark” size=”20″] Year-To-Date Scorecard [/su_heading]
Nasdaq Comp -0.6% YTD, S&P 500 -4.3% YTD, Russell 2k -3.9%, DJ Industrials -7.7%
[su_heading style=”modern-1-dark” size=”18″] Key Points [/su_heading]
- Uptrend: Short-Term, Intermediate Down & Long Term Up
- SPX Support, 1904, 1820
- SPX Resistance: 1980, 2039, 2134.72
- Sarhan’s Crowd Behavior Index: Bearish
(Properitary market indicator that measures crowd sentiment: Bullish Bearish or Neutral)
[su_heading style=”modern-1-dark” size=”18″] Global Macro Update [/su_heading]
[su_row]
[su_column size=”1/2″]
- Stocks: Downtrend
- Bonds: Uptrend
- Currencies (Euro/USD): Sideways
- Softs: Downtrend
[/su_column]
[su_column size=”1/2″]
- Energy: Downtrend
- Metals: Downtrend
- Grains: Downtrend
[/su_column]
[/su_row]
[su_spoiler title=”Monday-Wednesday’s Action: Sellers Are In Control” style=”fancy”]
Stocks opened lower on Monday but quickly turned higher as investors digested the latest round of economic data. Before the open, the empire state manufacturing index plunged to negative -14.92, missing consensus for a positive 4.75. The housing market index rose to 61, matching estimates for 61 and signaling optimism from the National Association of Home Builders about the general economy and housing market conditions. Japan’s GDP shrank by a -1.6% annualized rate in Q2 2015 which bodes poorly for the global economy.
Stocks slid on Tuesday after China’s Shanghai Composite plunged by 6.2% (over 1,000 Dow Points). In the U.S., housing starts inched higher to 1.206M, beating estimates for 1.180M. This sent a slew of housing stocks sharply higher on the news. Separately, building permits fell by 16% to 1.119M in July. Permits missed estimates for 1.230M. On Wednesday stocks were clobbered after Crude Oil plunged to a fresh 6-year low. The consumer price index rose to 0.1%, missing estimates for 0.2% and continued to signal deflation remains more of a threat than inflation. In the afternoon, the Fed released the minutes of their latest meeting which continued to show they remain “data dependent.”
[/su_spoiler]
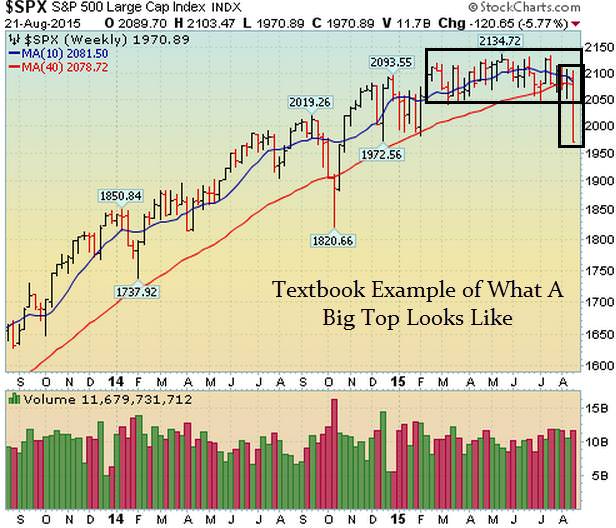
[su_spoiler title=”Thursday-Friday’s Action: Stocks Plunge Below Important Support” style=”fancy”]
Stocks plunged on Thursday sending the major U.S. indices below very important support. For the past six months the S&P 500 has been trading in a long trading range between 2,040 (support) and 2,134 (resistance). The S&P 500 sliced, and closed, below support on Thursday and turned negative for the year as sellers remained in control. China devalued their currency in the middle of August and then last week we saw Vietnam and Kazakhstan devalue their currencies. Kazakhstan allowed its currency to float freely and it plunged nearly 30% against he USD. That’s A MAJOR move for a currency. The selling continued on Friday as investors dumped stocks ahead of the weekend. To be clear, defense is king right now.
[/su_spoiler]
[su_spoiler title=”Market Outlook: A Major Top?l” style=”fancy”]
Every bull market in history has a definitive beginning and an end. It is important to note that with each day that passes, we are getting closer to the end and further away from the beginning. This bull market is aging by any normal definition and celebrated its 6th anniversary in March 2015. The last two major bull markets ended shortly after their 5th anniversary; 1994-2000 & 2002-Oct 2007. As always, keep your losses small and never argue with the tape.
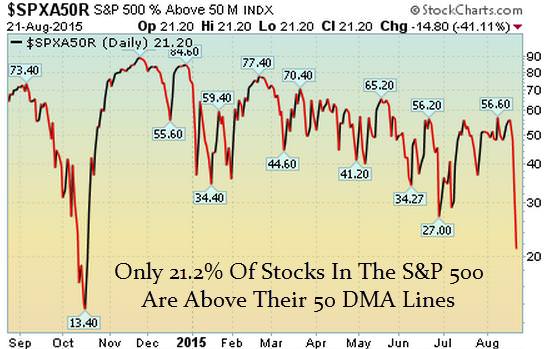
21.2% Of Stocks in the S&P 500 Are Above Their Respective 50 DMA
(Market Tends To Turn When This Reading Gets Above 70% or Below 40%)
Observation: Readings above 70% usually (not always) correspond with a short term pullback
Conversely, reads below 40% usually (not always) correspond with a short term bounce
[/su_spoiler]
[su_spoiler title=”FLS Conviction Leaders List” style=”fancy”]
The damage last week was severe. The market is now on the cusp of rolling over and forming a new downtrend. We do not like to buy new stocks during a downtrend and “leadership” changes drastically during a downtrend. This list will be updated to reflect the “changing” landscape over the next few weeks.
- AAPL – Fell hard last week and will be removed from this list on further weakness
- AMZN – Fell hard last. 50 DMA line is next level of support
- EA – Plunged and closed below its 50 DMA line last week for the first time since Oct 2014
- FB – Fell sharply last week and sliced below its 50 DMA line
- FLT – Huge decline last week. 200 DMA line is next level of resistance
- GOOG – Large decline last week 50 DMA line is next level of resistance
- NFLX – Steep decline last week and closed below 50 DMA. next level of support 200 dma line near 69
- SBUX – Large sell off last week and broke below 50 DMA line
- TSLA – Failed at 50 DMA line and closed just above 200 DMA line
- UA – Big gap down last week and closed below 50 DMA
- V – Acting a little better on a relative basis but closed below 50 DMA line
[/su_spoiler]
[su_spoiler title=”0 New Setups” style=”fancy”]
There are no new setups this week because the market is very oversold and could easily gap up or gap down a few hundred points in a blink of an eye. We only like to participate when we have a definable edge (the odds are in our favor).
We believe a new downtrend is beginning (notwithstanding more easy money from the Fed/other central banks) and over the next few weeks we will have a lot more short setups for you.
Knowing when not to be involved is just as important as knowing when to be involved in this business. Most importantly, investing/trading is a marathon, not a sprint and our biggest winners are ahead of us.
[/su_spoiler]
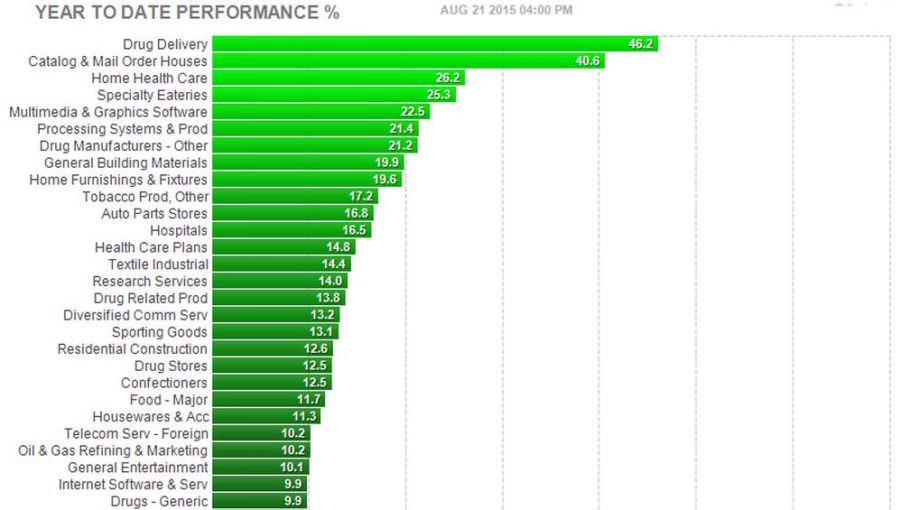
[su_spoiler title=”Strong Sectors, Groups, & Symbols” style=”fancy”]
[su_heading style=”modern-1-dark” size=”18″]Strong Sectors [/su_heading]
[su_heading style=”modern-1-dark” size=”18″]Strong Groups [/su_heading]
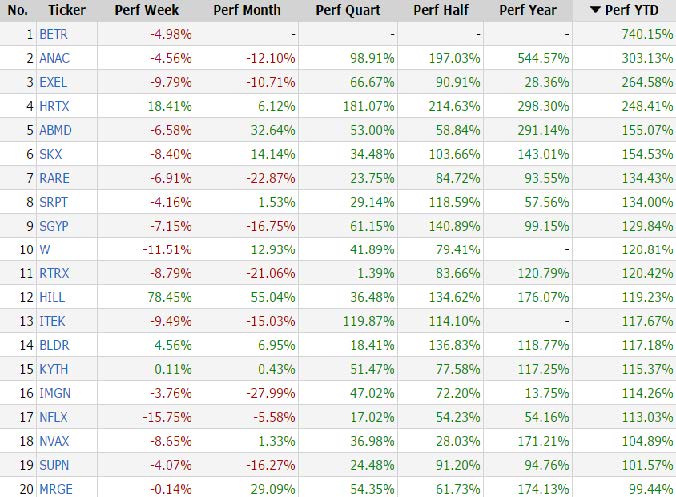
[su_heading style=”modern-1-dark” size=”18″]Strongest Stocks Of The Year[/su_heading]
These are the top 20 strongest performing tickers on a year-to-date basis that are trading over $5, average daily volume over 500k and have a market cap >300M (Small cap-Mega Cap)
[/su_spoiler]


