

[su_heading style=”modern-2-dark” size=”20″] Market Update [/su_heading]
Stocks ended mixed last week as investors look forward to next week’s Fed meeting (Tues/Wed) and the
on-going drama with Greece. The latest round of incoming economic “data” failed to “impress” which
means the Fed will likely not raise rates in the near future. It is important to note that the Fed has a dual
mandate: help the economy and keep inflation near its 2% target. Right now, neither objective is being
met which is why we do not think the Fed will raise rates until the “data” improves. We do not expect the
Fed to do anything substantial next week – if anything, just change its rhetoric. The simple fact is that they
remain “data-dependent” which means, by definition, no one in the world (including the Fed) knows
when they will raise rates. Conversely, if the “data” weakens, we would not be surprised to see the Fed
announce QE 4 (print more money). Interestingly, the small-cap Russell 2000 index led its peers and
closed with decent gains last week. Looking forward, the bulls remain in control as long as the major
indices remain perched below their 2015/record highs and we see any material selling/damage occur.
[su_heading style=”modern-2-dark” size=”20″] Portfolio Update [/su_heading]
Every position in the FLS portfolio is profitable ahead of the Fed meeting. Our stops were moved up
recently (where possible) and we are comfortable with our exposure at this juncture. Here is a snapshot of
the FLS portfolio as of Friday’s close.
[su_heading style=”modern-1-dark” size=”18″] Positions [/su_heading]
- The service owns: TSLA +22.47%, NFLX +14.72%, REGN +1.27%, XLF +0.68%, HACK +5.51%, DPZ +0.77%
- The service will exit: TSLA @ 234.87, NFLX @ 576.13, REGN @ 486.10, XLF @24.03, HACK @ 28.69, DPZ @ 105.14
[su_heading style=”modern-1-dark” size=”18″] Working Buy Orders [/su_heading]
[su_table]
| Status | Order | Ticker | Buy Stop | Protective Sell Stop | Risk from Entry |
| Working | BUY | AMZN | 439 | 414.55 | -5.57% |
| Working | BUY | MTH | 46.05 | 43.13 | -6.34% |
[/su_table]
[su_heading style=”modern-2-dark” size=”20″] Analyzing The S&P 500’s Latest Moves (Up & Down) [/su_heading]
Nearly every pullback has been shallow in both size (small percent decline) and scope (short in duration) which is bullish for this ongoing and very powerful rally.
[su_table]
| Pullback | Rally | |||||
| High | Low | % Change | Low | High | % Change | |
| SPX | 2134.7 | 2085.67 | -2.30% | 2039.7 | 2137.72 | 4.66% |
| SPX | 2119.6 | 2039.69 | -3.77% | 1980.9 | 2119.59 | 7.00% |
| SPX | 2093.6 | 1980 | -5.42% | 1972.6 | 2093.55 | 6.13% |
| SPX | 2079.5 | 1972.56 | -5.14% | 1820 | 2079.47 | 14.26% |
| SPX | 2019 | 1820 | -9.86% | 1904 | 2019.26 | 6.05% |
| SPX | 1991 | 1904 | -4.37% | 1814 | 1991 | 9.76% |
| SPX | 1897 | 1814 | -4.38% | 1737 | 1897 | 9.21% |
| SPX | 1850 | 1737 | -6.11% | 1646 | 1850 | 12.39% |
| SPX | 1729 | 1646 | -4.80% | |||
| Avg Pullback | -5.48% | Avg Gain | 9.63% | |||
[/su_table]
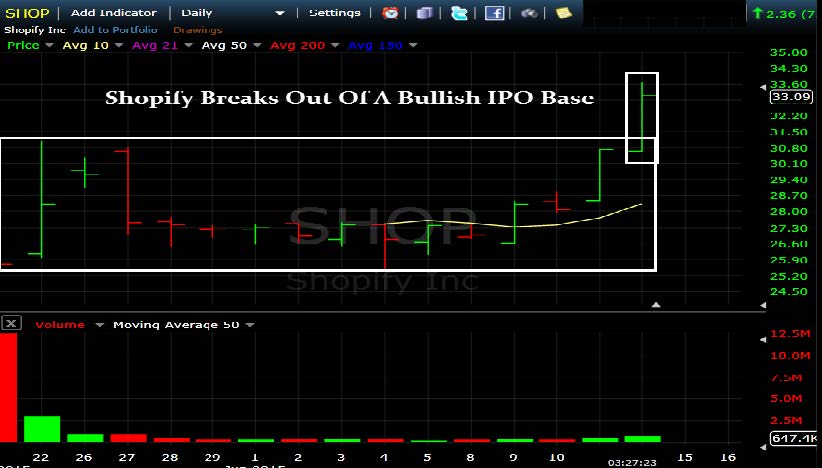
[su_heading style=”modern-2-dark” size=”20″] Chart of the Week [/su_heading]
Shopify $SHOP – Breaks out of a new bullish IPO Base
[su_heading style=”modern-2-dark” size=”20″] 2015 Scorecard [/su_heading]
Nasdaq Comp +6.7% YTD, Russell 2k +5.0%, S&P 500 +1.8% YTD, DJ Industrials +0.5%
[su_heading style=”modern-1-dark” size=”18″] Key Points [/su_heading]
- Uptrend: Short-Term Pulling Back, Intermediate & Long Term Remain Strong
- SPX Support = 2067, 2039, 1980, 1972, 1904, 1820
- SPX Resistance = 2134.72
- Sarhan’s Crowd Behavior Index: Neutral
(Proprietary market indicator that measures crowd sentiment: Bullish Bearish or Neutral)
[su_heading style=”modern-1-dark” size=”18″] Global Macro Update [/su_heading]
[su_row]
[su_column size=”1/2″]
- Stocks: Uptrend
- Bonds: Downtrend
- Currencies (Euro/USD): Sideways
- Softs: Downtrend
[/su_column]
[su_column size=”1/2″]
- Energy: Uptrend
- Metals: Sideways
- Grains: Downtrend
[/su_column]
[/su_row]


