

[su_heading style=”modern-2-dark” size=”20″] Market Update [/su_heading]
Stocks rallied nicely last week helping the tech-heavy Nasdaq 100 breakout of its year-long range and hit a fresh 15-year high. The market was able to breathe a collective sigh of relief when the two big threats (Greece and China) were temporarily resolved. Stocks rallied after it became clear that Greece would not leave the euro zone. Separately, the panic selling in China eased a bit after the Chinese government literally shut down a big chunk of their stock market, printed money to buy stocks, banned and arrested short sellers in an attempt to curb the selling. The real kicker is that neither situation has been permanently resolved. That’s why it is important to note that in bull markets (present market included), stocks rally regardless of the news. From where we sit, the reaction to the news, matters a lot more than the news itself. For now, we are still in a very strong (but aging) bull market which, by definition, means the path of least resistance remains higher (until any material technical damage emerges).
[su_heading style=”modern-2-dark” size=”20″] Portfolio Update [/su_heading]
The FLS portfolio continues acting well. The service sold DPZ last week for a very small -0.26% loss. Here is a snapshot of the FLS portfolio as of Friday’s close,
[su_heading style=”modern-1-dark” size=”18″] Positions [/su_heading]
- The service owns: TSLA +34.18%, NFLX +39.45%, XLF +2.09%, MTH +3.19%, AMZN +10.03%, REGN +5.95%, FEYE -3.73%, UA +0.15%
- The service will exit: TSLA @ 245.77, NFLX @ 97.04, XLF @24.03, MTH @ 46.05, AMZN @439, REGN @ 521, FEYE @ 46.53, UA @ 83.65
[su_heading style=”modern-1-dark” size=”18″] Working Buy Orders [/su_heading]
We are comfortable with our current exposure and are entering the heard of earnings season so there are no new orders today
[su_heading style=”modern-2-dark” size=”20″] Analyzing The S&P 500’s Latest Moves (Up & Down) [/su_heading]
[dummy_text]
[su_table]
1897
| Pullback | Rally | |||||
| High | Low | % Change | Low | High | % Change | |
| SPX | 2134.7 | 2044.02 | -4.25% | 2044 | 2126.64 | 4.04% |
| SPX | 2129.9 | 2056.32 | -3.45% | 2039.7 | 2134.72 | 4.66% |
| SPX | 2134.7 | 2085.67 | -2.30% | 1980.9 | 2119.59 | 7.00% |
| SPX | 2119.6 | 2039.69 | -3.77% | 1972.6 | 2093.55 | 6.13% |
| SPX | 2093.6 | 1980 | -5.42% | 1820 | 2079.47 | 14.26% |
| SPX | 2079.5 | 1972.56 | -5.14% | 1904 | 2019.26 | 6.05% |
| SPX | 2019 | 1820 | -9.86 | 1814 | 1991 | 9.76% |
| SPX | 1991 | 1904 | -4.37% | 1737 | 1897 | 9.21% |
| 850 | -4.38% | -4.38% | 1646 | 1850 | 12.39% | |
| 1850 | 1737 | -6.11% | ||||
| 1729 | 1646 | -4.80% | ||||
| Avg Pullback | -4.89% | Avg Gain | 8.17% | |||
[/su_table]
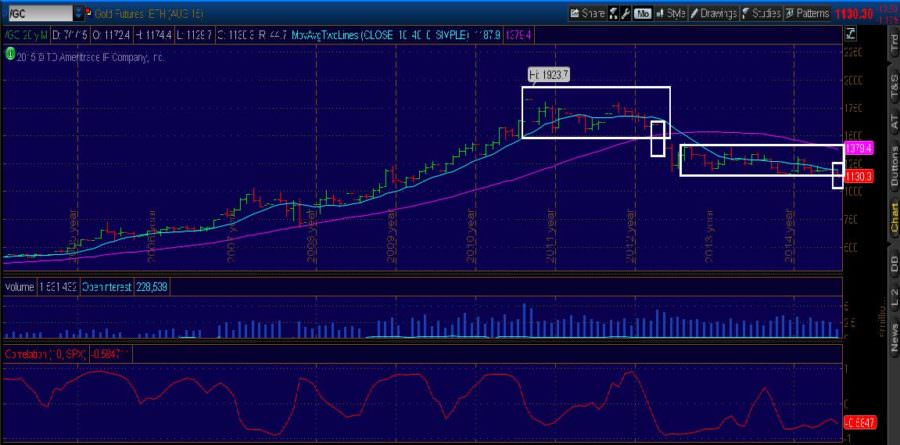
[su_heading style=”modern-2-dark” size=”20″] Chart of the Week [/su_heading]
Gold Breaks Support & Plunges To 5-Year Low
[su_heading style=”modern-2-dark” size=”20″] 2015 Scorecard [/su_heading]
Nasdaq Comp +10.0% YTD, Russell 2k +5.2%, S&P 500 +3.3% YTD, DJ Industrials +1.5%
[su_heading style=”modern-1-dark” size=”18″] Key Points [/su_heading]
- Uptrend: Short-Term, Intermediate & Long Term Remain Strong
- •SPX Support: 2044, 2039, 1980, 1972, 1904, 1820
- •SPX Resistance: 2134.72
- •Sarhan’s Crowd Behavior Index: Bullish
(Properitary market indicator that measures crowd sentiment: Bullish Bearish or Neutral)
[su_heading style=”modern-1-dark” size=”18″] Global Macro Update [/su_heading]
[su_row]
[su_column size=”1/2″]
- Stocks: Uptrend
- Bonds: Sideways
- Currencies (Euro/USD): Sideways
- Softs: Downtrend
[/su_column]
[su_column size=”1/2″]
- Energy: Downtrend
- Metals: Downtrend
- Grains: Sideways
[/su_column]
[/su_row]


