

[su_heading style=”modern-2-dark” size=”20″] Market Update [/su_heading]
The stock market is getting weaker, not stronger. Over the past few months we have mentioned the disconcerting (bearish) signals that were emerging on our radar. Notwithstanding more easy money from the Fed/other central banks, the market appears to be forming a major top. Leadership has narrowed substantially over the past few months, fewer and fewer stocks are acting well, more areas continue to fall by the wayside, only 7 (23%) stocks in the Dow are acting well and 23 (77%) are in poor technical shape, Apple Inc ($AAPL) the most well known sliced below major support last week, and demand is waning across the globe (Transportation stocks and major global commodities – both very dependent on demand – a.k.a. economic activity) are getting disseminated. That directly contradicts the Fed’s narrative (that the economy is improving and they must raise rates later this year). So far, even with rates at zero, economic activity, measured by GDP, continues to miss estimate and deflation remains more of a threat than inflation (The Fed’s dual mandate). So why would the Fed want to raise rates when neither one of its mandates are being met. From where we sit, the Fed is not going to raise rates until the “data” forces their hand but that doesn’t matter, what matters is perception. The next level of support to watch is 2039 in the S&P 500. If that level is taken out we have to expect lower prices to follow. Longer term, it is important to note that we are still in a bull market. It’s an aging bull but a bull nonetheless. It is also healthy to see even with all the bearish signals mentioned above – the major indices are still single digit percentage points below their record highs – so a few strong up weeks will change the playing field. Until that happens, the market is getting weaker, not stronger, and the major indices appear to be forming a major top.
[su_heading style=”modern-2-dark” size=”20″] Portfolio Update [/su_heading]
Thankfully, the FLS portfolio continues acting well. Thankfully, we have avoided a lot of “damage” over the past few weeks as the market continues to deteriorate. We are very happy with our current exposure and will look to revisit in the near future. Remember, knowing when not to buy is just as important as knowing when to buy. Here is a snapshot of the FLS portfolio as of Friday’s close,
[su_heading style=”modern-1-dark” size=”18″] Positions [/su_heading]
- A. The service owns: AMZN +19.05%, XLF +1.33%, REGN +11.14%, UA +12.45%
- The service will exit: AMZN @482, XLF @24.03, REGN @ 521, UA @ 92.77
[su_heading style=”modern-1-dark” size=”18″] Working Buy Orders [/su_heading]
There are no new orders today. The market is not trending well right now. We will look to add risk when a new trend (up or down) emerges.
[su_heading style=”modern-2-dark” size=”20″] Analyzing The S&P 500’s Latest Moves (Up & Down) [/su_heading]
Nearly every pullback has been shallow in both size (small percent decline) and scope (short in duration) which is bullish for this ongoing and very powerful rally.
[su_table]
| Pullback | Rally | |||||
| High | Low | % Change | Low | High | % Change | |
| SPX | 2132.8 | 2067.91 | -3.04% | 2044 | 2126.64 | 4.04% |
| SPX | 2134.7 | 2044.02 | -4.25% | 2039.7 | 2134.72 | 4.66% |
| SPX | 2129.9 | 2056.32 | -3.45% | 1980.9 | 2119.59 | 7.00% |
| SPX | 2134.7 | 2085.67 | -2.30% | 1972.6 | 2093.55 | 6.13% |
| SPX | 2119.6 | 2039.69 | -3.77% | 1820 | 2079.47 | 14.26% |
| SPX | 2093.6 | 1980 | -5.42% | 1904 | 2019.26 | 6.05 |
| SPX | 2079.5 | 1972.56 | -5.14% | 1814 | 1991 | 9.76% |
| SPX | 2019 | 1820 | -9.86% | 1737 | 1897 | 9.21% |
| SPX | 1991 | 1904 | -4.37% | 1646 | 1850 | 12.39% |
| SPX | 1897 | 1814 | -4.38% | |||
| SPX | 1850 | 1737 | -6.11% | |||
| SPX | 1729 | 1646 | -4.80% | |||
| Avg Pullback | -4.74% | Avg Gain | 8.17% | |||
[/su_table]
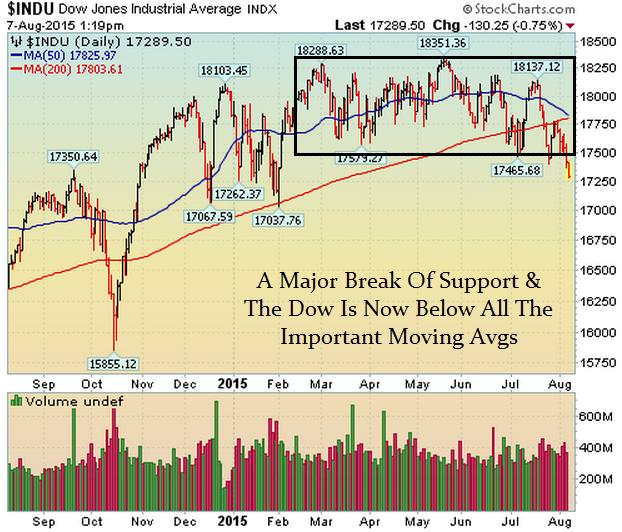
[su_heading style=”modern-2-dark” size=”20″] Chart of the Week [/su_heading]
The Dow Broke Below Major Support Last Week
[su_heading style=”modern-2-dark” size=”20″] 2015 Scorecard [/su_heading]
Nasdaq Comp +6.1% YTD, S&P 500 +0.9% YTD, Russell 2k +0.2%, DJ Industrials -2.6%
[su_heading style=”modern-1-dark” size=”18″] Key Points [/su_heading]
- • Uptrend: Short-Term Weak, Intermediate Sideways & Long Term Strong
- SPX Support: 2044, 2039, 1980, 1972, 1904, 1820
- SPX Resistance: 2134.72
- Sarhan’s Crowd Behavior Index: Neutral
(Properitary market indicator that measures crowd sentiment: Bullish Bearish or Neutral)
[su_heading style=”modern-1-dark” size=”18″] Global Macro Update [/su_heading]
[su_row]
[su_column size=”1/2″]
- Stocks: Sideways
- Bonds: Uptrend
- Currencies (Euro/USD): Downtrend
- Softs: Downtrend
[/su_column]
[su_column size=”1/2″]
- Energy: Downtrend
- Metals: Downtrend
- Grains: Downtrend
[/su_column]
[/su_row]


