[su_heading style=”modern-2-dark” size=”20″] Market Update [/su_heading]
The market continues to look weak and moves are very erratic in nature (both up and down). The market is bouncing from very oversold levels and still remains very extended to the downside. This has been a record (and very wild week) on Wall Street. Volatility soared and we have seen record point swings every day this week! On Monday, we saw the weakest open in history (Dow plunged 1,089 points)… 5 minutes after the open, we saw the largest single day point gain in history, which quickly faded and caused the major indices to end lower and experience one of their largest single day declines in history. On Tuesday, the market melted down in the final hour after being up for most of the day. The Dow swung over 400 points in a few hours. Then on Wednesday, the Dow surged over 600 points and enjoyed its largest single day advance since 2008! As previously mentioned, the biggest concern we have is that nearly ever major market in the world is trading like a penny stock and the extreme volatility we are seeing now in the major averages – AFTER a 6.5 year rally… is classic bear market action after a big top. Until the technical damage is repaired (S&P 500 trades above 2040), this is the beginning stages of a bear market. If this turns into a full bear—- the selling we have seen over the past week – is just the beginning and it will get a lot worse. The only wild card is the Fed and we’ll see how the market acts in the near future. For those of you who think the market is not tied to the Fed – take a look at this great chart on GaryK.com today. Remember, some of the largest moves in history (both up and down) occur during bear markets/downtrends. As always, we will have a full report for you this weekend.
[su_heading style=”modern-2-dark” size=”20″] FLS Special Report [/su_heading]
For those of you who are looking for leading stocks (in case this market continues to bounce)- we put this special report together for you of the strongest performing stocks of 2015 broken down by market cap.
[su_heading style=”modern-2-dark” size=”20″] FLS Portfolio [/su_heading]
We prefer to risk our capital when the odds are in our favor. Right now the market is very random, we are very happy to be in cash, and will revisit down the road.
[su_heading style=”modern-1-dark” size=”18″] Positions [/su_heading]
- The FLS Portfolio is 100% in Cash
[su_heading style=”modern-1-dark” size=”18″] Working Buy Orders [/su_heading]
There are no working orders today
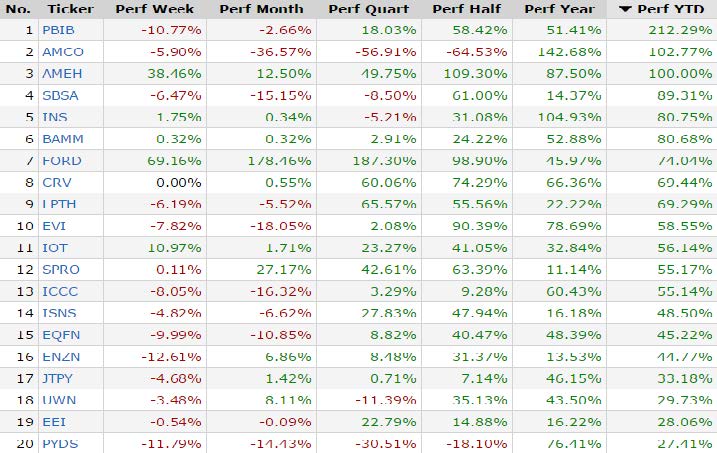
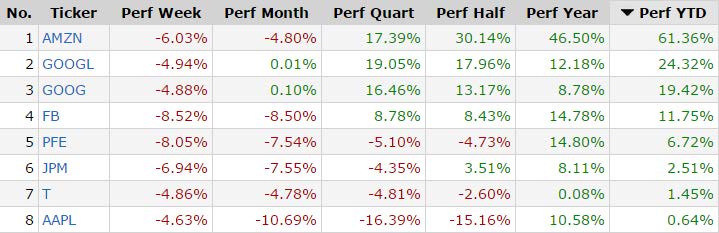
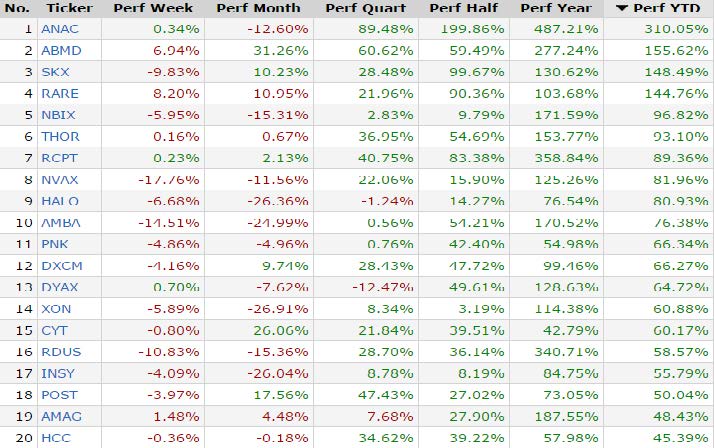
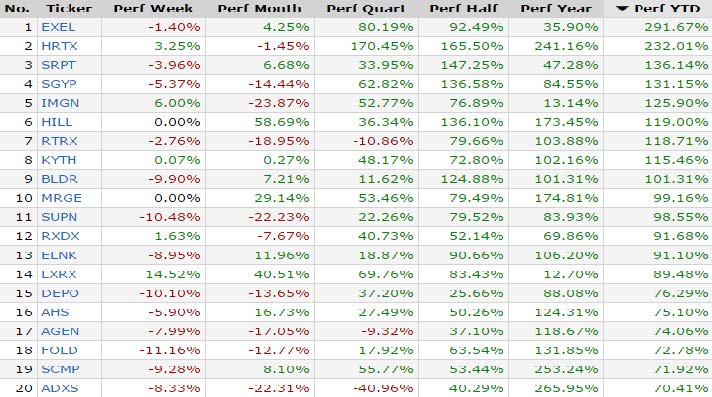
[su_heading style=”modern-1-dark” size=”18″] Top 20 Largest YTD % Gainers Stocks of 2015
(Ignore BETR) [/su_heading]
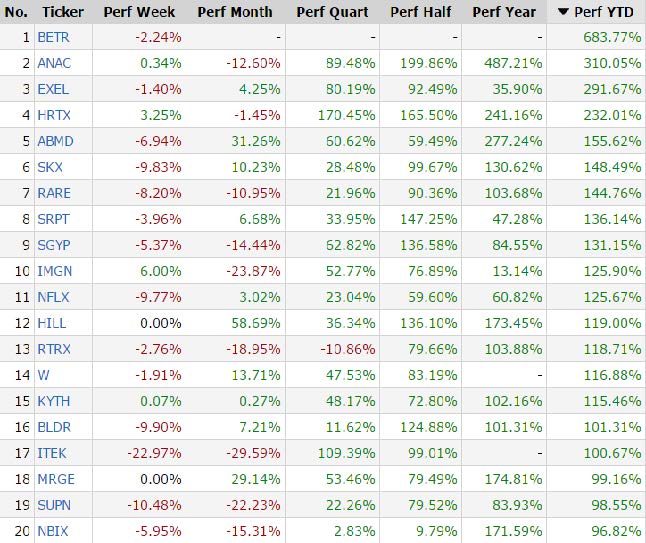
[su_heading style=”modern-1-dark” size=”18″] Mega-Cap: >$200B & Average Volume >500K [/su_heading]
[su_heading style=”modern-1-dark” size=”18″] Large Cap: $10B-$200B & Average Volume >500K [/su_heading]
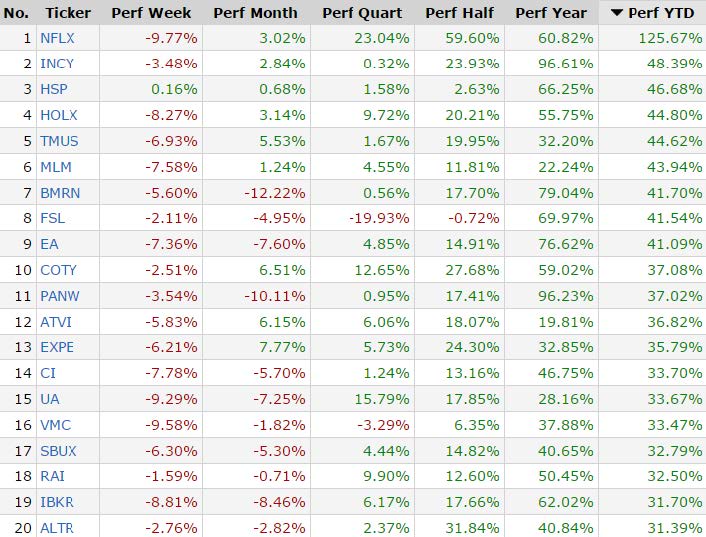
[su_heading style=”modern-1-dark” size=”18″] Mid Cap: $2B-$10B & Average Volume >500K [/su_heading]
[su_heading style=”modern-1-dark” size=”18″] Small Cap: $300M-$2B & Average Volume >500K [/su_heading]
[su_heading style=”modern-1-dark” size=”18″] Micro Cap: $50m-$300M & Average Volume >500K [/su_heading]
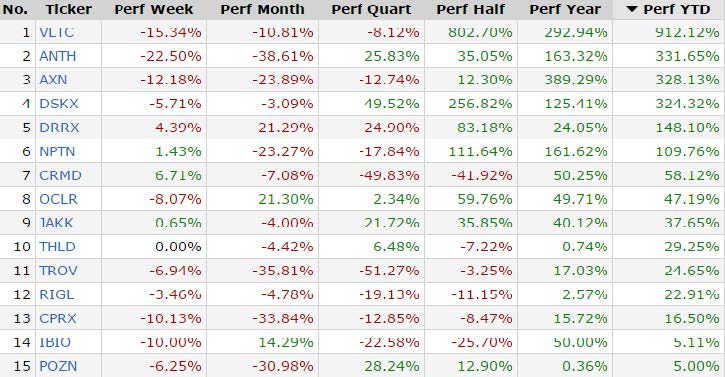
[su_heading style=”modern-1-dark” size=”18″] Nano Cap: Under $50M & No Volume Requirements [/su_heading]