


[su_spoiler title=”Monday-Wed Action: Stocks Rally On Greek Proposal” style=”fancy”]
Stocks rallied nicely on Monday after Greece submitted a new proposal to its creditors. Germany’s Finance Minister Wolfgang Schaeuble said he does not see anything new in the proposal which quickly curbed the market’s enthusiasm. Meanwhile, economic data and M&A activity continued to help markets. Existing home sales rose +5.1% in May to 5.35 million beating estimates for a gain of 5.26 million. That was the highest monthly reading for existing homes sold since November 2009 when 5.44 million were sold. First-time home buyers accounted for 32% of all sales in May, up from 30% in April, representing the largest contribution since September 2012. Lots of buyers are rushing to lock in historically low mortgages rates before rates move higher. Shares of Cigna ($CI) soared after the company rejected Anthem’s ($ANTM)new offer to acquire the company for $184/share. Separately, Aetna’s ($AET) made a bid to acquire Humana ($HUM) for an undisclosed amount.
Stocks edged higher on Tuesday but spent most of the session near the flat line as investors digested the latest round of economic data and continued to wait for a deal from Greece. Durable goods slid -1.8% in May which missed estimates for a decline of -0.5%. The biggest drag on the reading came from a decline in aircraft orders. Shares of Boeing ($BA) fell after the company reported a big drop in sales. The FHFA Housing Price Index rose 0.3%, missing estimates for a gain of 0.4%. A separate report showed that new home sales rose 2.2% in May and hit their highest level since February 2008. New home sales rose to 546k from an upwardly revised 534k and beat estimates for 525k. The PMI manufacturing index came in at 53.4, missing estimates for 54.2. The Richmond Fed manufacturing index came in at 6 which was a decent reading and beat the prior reading of 1. Stocks fell hard on Wednesday after tensions rose in Europe regarding a Greek deal and Q1 2015 U.S. GDP was revised higher. The proposal Greece submitted was rejected and they are back to the drawing board which disappointed many investors. In the U.S., Q1 2015 GDP was revised to negative -0.2%, matching estimates, and higher from the last reading of -0.7%. The revision matches the Fed’s script and raises concerns of a Fed rate hike in September. The bulls are not happy to see transports plunge over -2% as they continue to form a major top with a bearish base-under-base pattern.
[/su_spoiler]
[su_spoiler title=”Thurs-Fri Action: Stocks Fall As Greek Drama Continues” style=”fancy”]
Stocks fell on Thursday after the latest Eurogroup meeting was suspended to give the Greek delegation time to submit a better proposal to creditors. The big winners on Wall Street came from health care and hospital stocks which soared after the Supreme Court upheld federal subsidies for the Affordable Care Act (a.k.a Obamacare). Hospital stocks such as $THC, $HCA, and $UHS all soared 7-12% immediately after the news broke. Shares of Humana ($HUM) soared after Bloomberg reported that Aetna ($AET) wants to acquire HUM. Weekly jobless claims rose to 271k, beating estimates for 273k. Stocks opened higher on Friday after ISIS committed three separate terrorist attacks in France, Tunis, and Kuwait. Overseas, Chinese stocks plunged on Friday, with the Shanghai Composite plunging over -7%, its largest one-day loss in five months as it gets closer to bear market territory (defined by a decline of >20% from a recent high).
[/su_spoiler]
[su_spoiler title=”Market Outlook: The Central Bank Put Is Alive And Well” style=”fancy”]
Remember, in bull markets surprises happen to the upside. This has been our primary thesis since the end of 2012. We would be remiss not to note that this very strong bull market is aging (celebrated its 6th anniversary in March 2015) and the last two major bull markets ended shortly after their 5th anniversary; 1994-2000 & 2002-Oct 2007). To be clear, the central bank put is very strong and until material damage occurs, the stock market deserves the longer-term bullish benefit of the doubt. As always, keep your losses small and never argue with the tape.
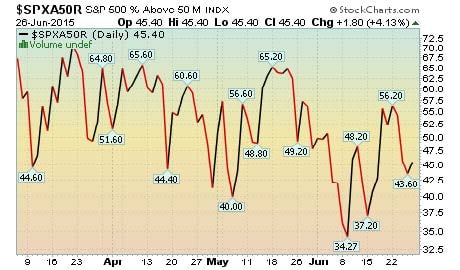
45.4% Of Stocks in the S&P 500 Are Above Their Respective 50 DMA
(Market Tends To Turn When This Reading Gets Above 70% or Below 40%)
Observation: Readings above 70% usually (not always) correspond with a short-term pullback
Conversely, reads below 40% usually (not always) correspond with a short-term bounce
[/su_spoiler]
[su_spoiler title=”Big Stock List” style=”fancy”]
- AAPL – Closed near its lows and below its 50 DMA as it continues tracing out a large 5 month base
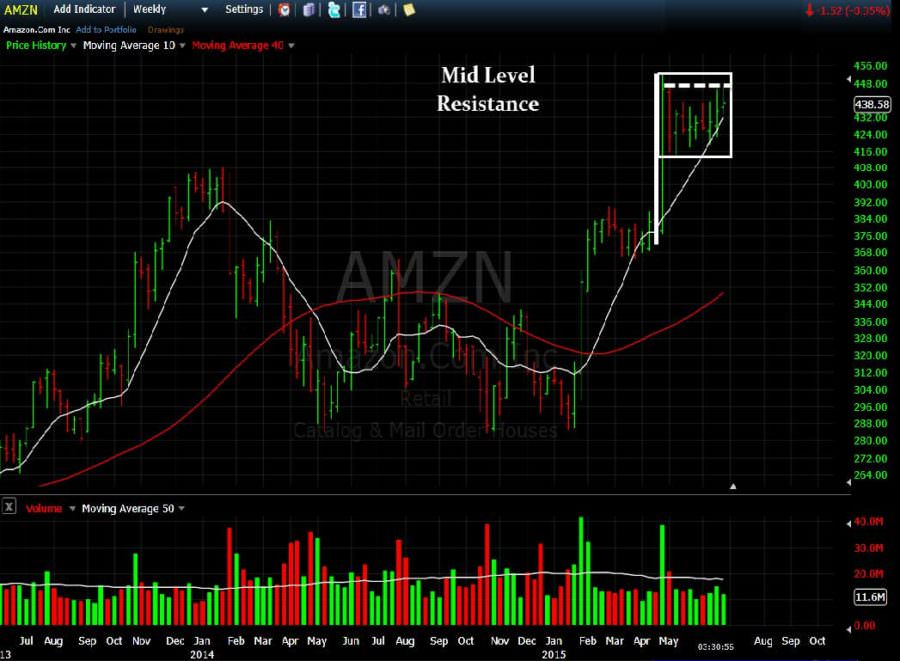
- AMZN – Encountered resistance near 447 and pulled back. Support = 50dma
- EA – Extended in near term. Very strong rally over past few weeks
- FB – Huge breakout on monstrous volume. Bulls want to see resistance ($86.07) become support
- FLT – Fell for second straight week as it pulls into its 50 DMA
- GOOGL – Big negative reversal last week and closed near its 50 and 200 DMA lines. Small golden cross (50 dma is now above 200 dma) ILMN – Finally snapped an 8-week win streak. Remains extended in near term
- NFLX – Big negative reversal last week after hitting a new record high and announcing a 7 for 1 stock split. Carl Icahn said he sold out of NFLX and walked away with a few Billion dollar in profit. That shook out the weaker hands
- SBUX – Nice action last week and remains extended
- TSLA – Very strong action continues. Good to see it open lower and close higher over past two weeks
- UA – Continues forming right side of large cup shaped base
- V – Fell last week and continues basing near its 50 DMA line
[/su_spoiler]
[su_spoiler title=”21 New Setups” style=”fancy”]
These hand-picked stocks are carefully selected to help with your idea generation and offer you additional setups each week. The setups are based on our proprietary criteria and offer advanced (dotted line) & classic long and short entry points (solid line). Short patterns are typically mirror images of long patterns.
Note: Please Verify All Earnings Dates/Data from Multiple Sources for Every Stock in all our report(s).
Charts Courtesy of FreeStockCharts.com and/or Stockcharts.com
AMZN Setup: Early Entry Still In Play
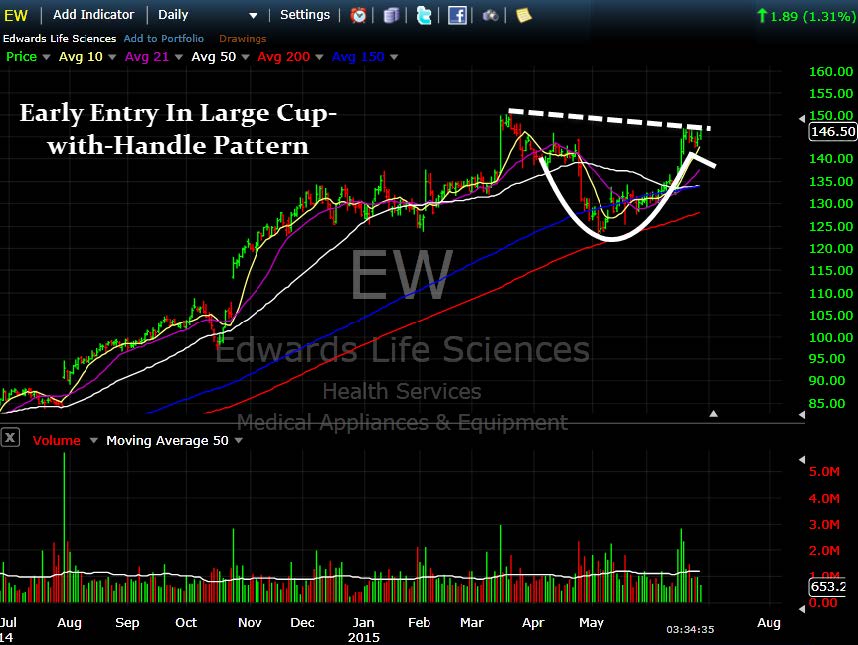
EW Setup: New Early Entry Forming In Bullish Cup-with-Handle Pattern
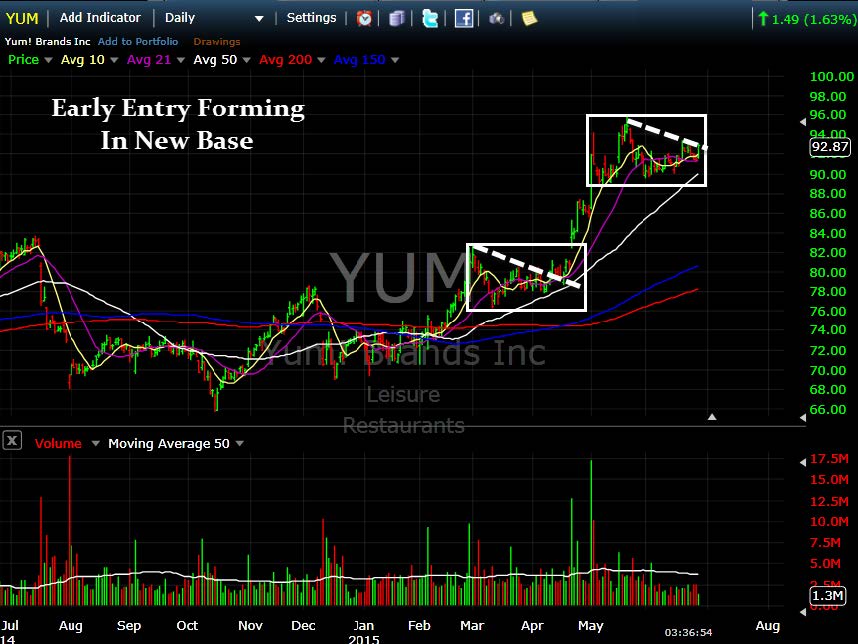
YUM Setup: New Early Entry Forming In New Base
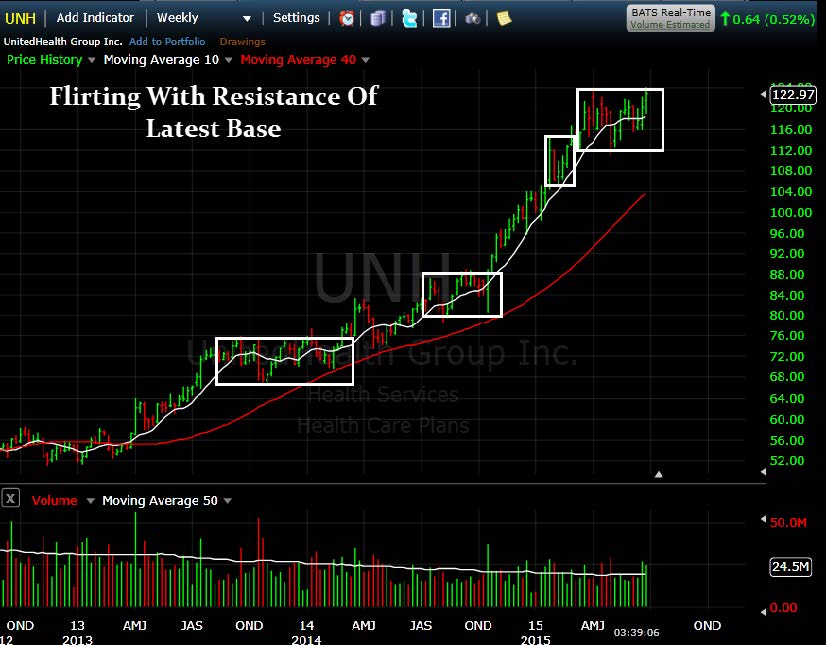
UNH Setup: Early Entry In Large Flat Base
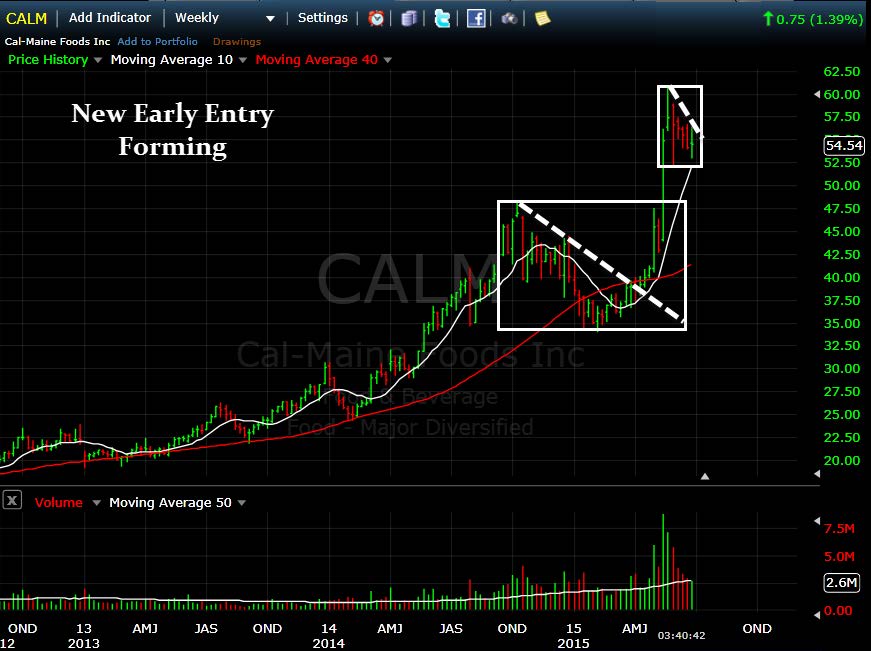
CALM Setup: New Early Entry Forming
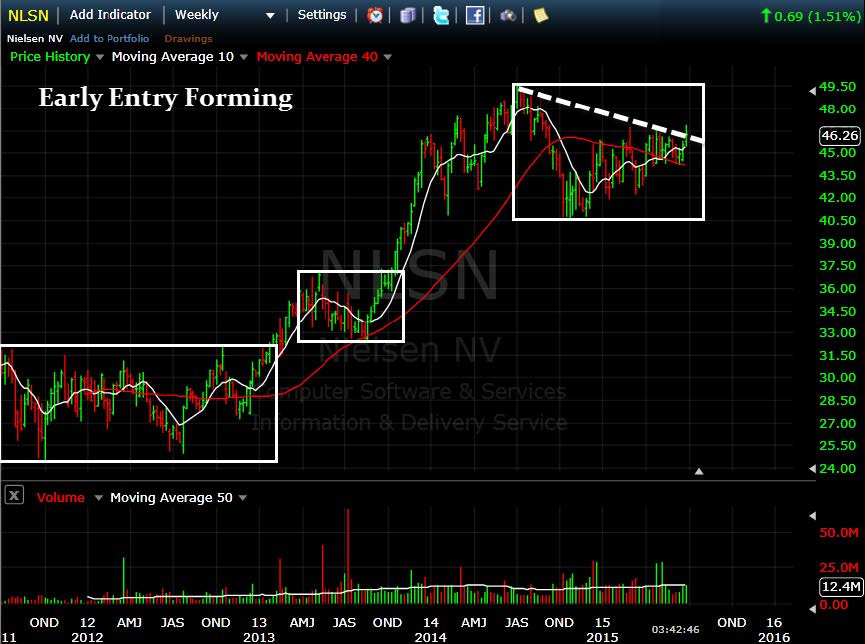
NLSN Setup: Nice Early Entry Forming
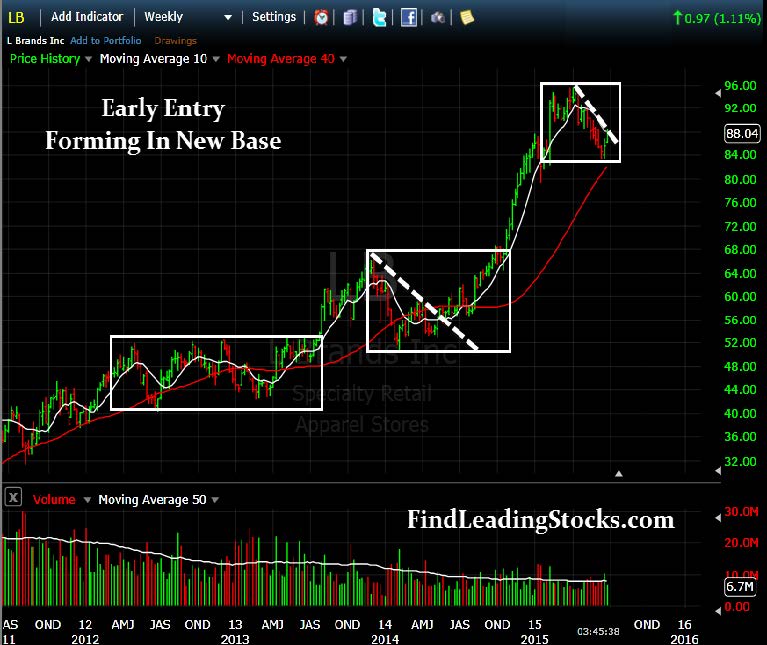
LB Setup: New Early Entry Forming
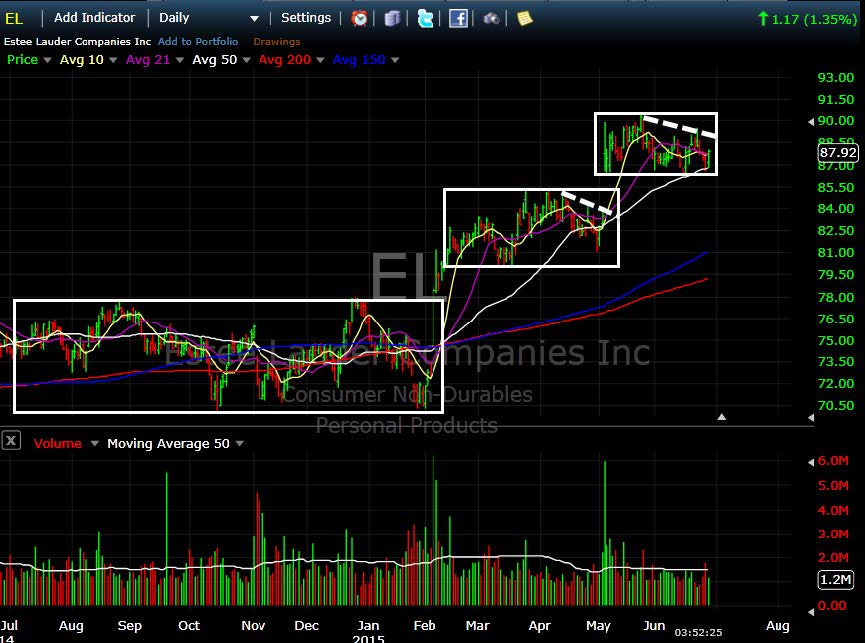
EL Setup: New Early Entry Forming
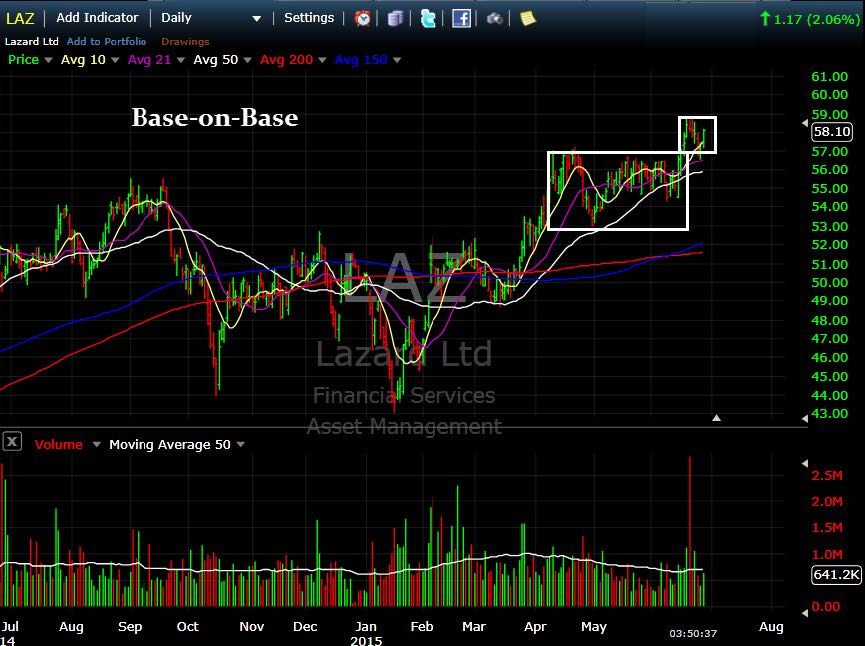
LAZ Setup – Resistance of Base-on-Base
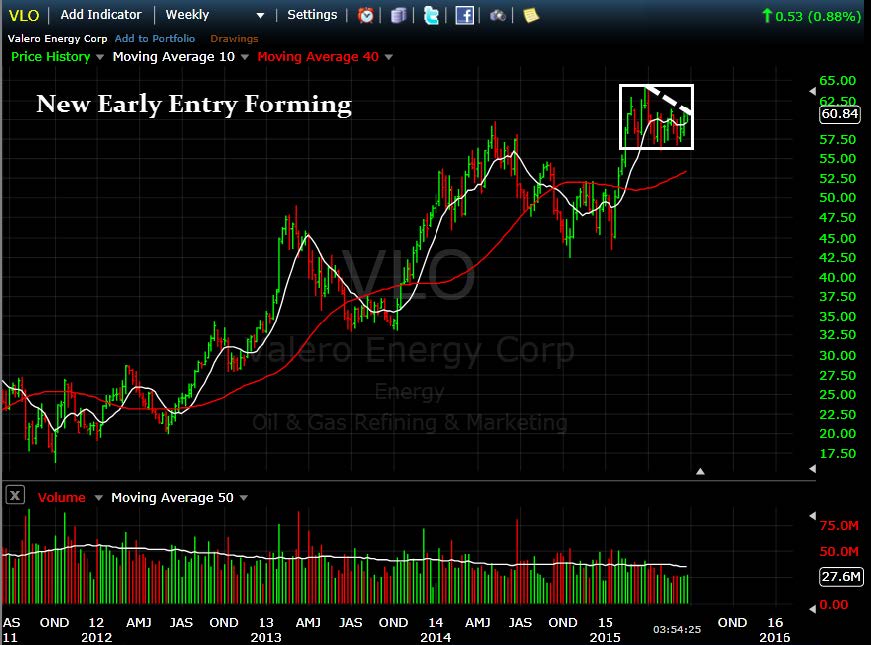
VLO: New Early Entry Forming
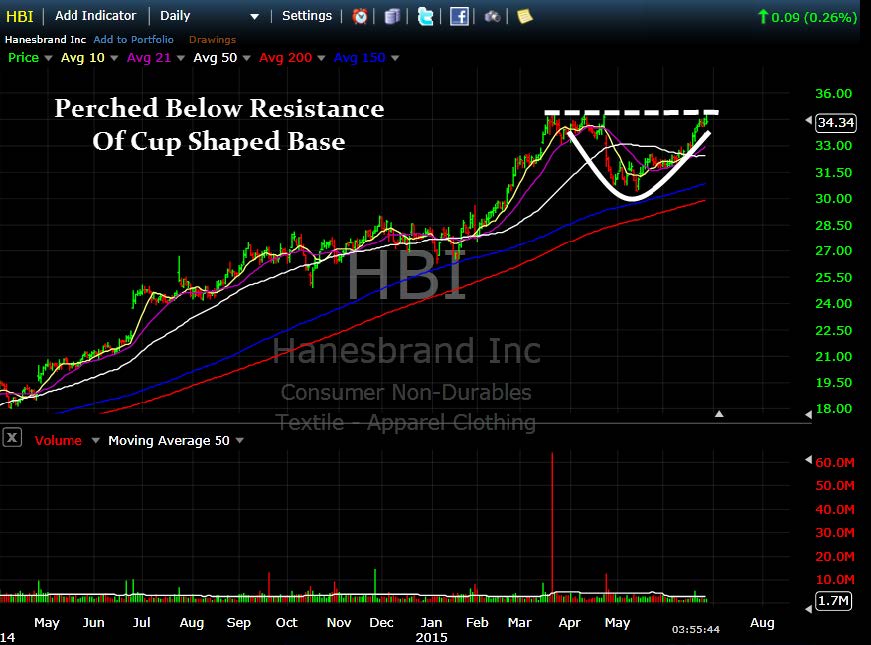
HBI Setup – Nice Action
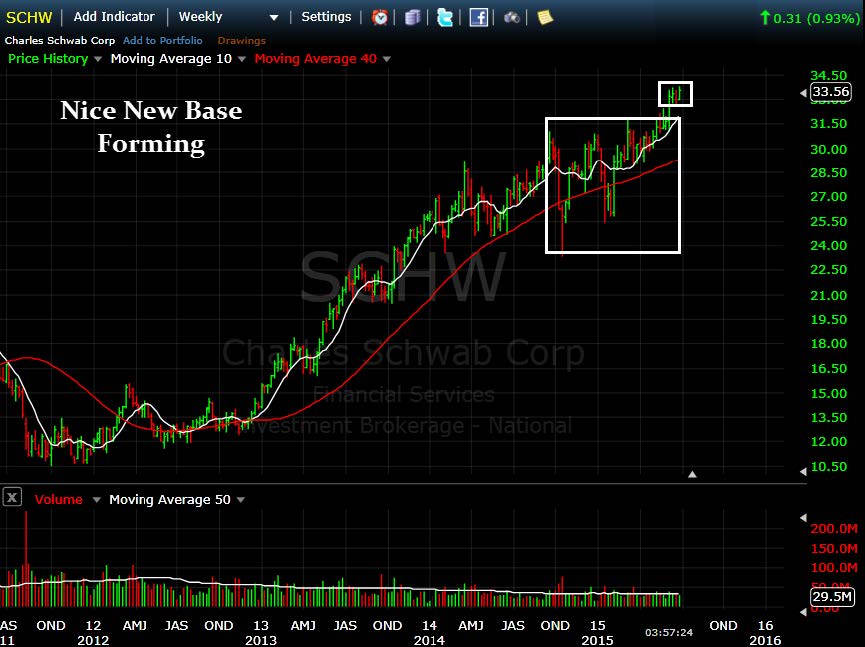
SCHW Setup: Nice New Base-on-Base Forming
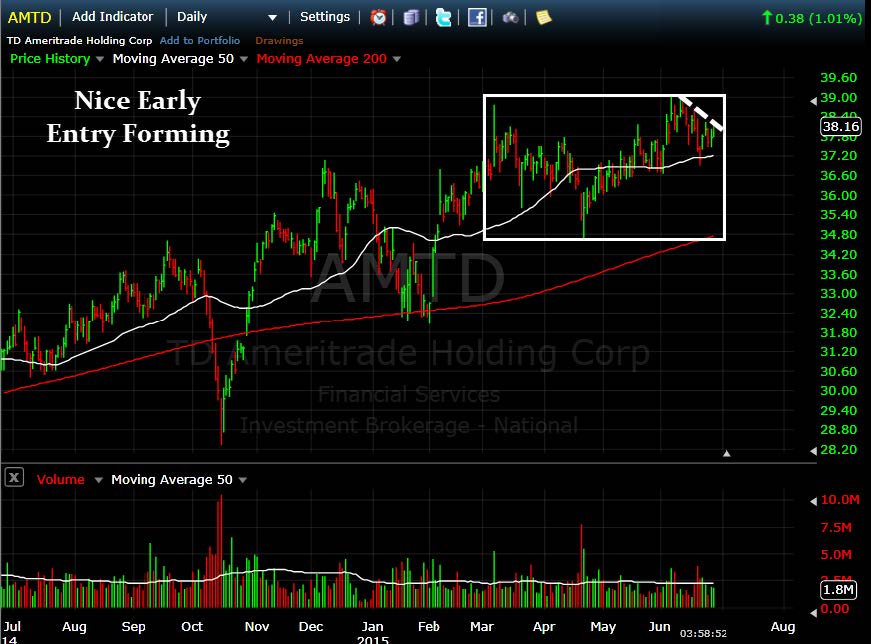
AMTD Setup – Nice Early Entry Forming
V Setup – Nice Early Entry Forming

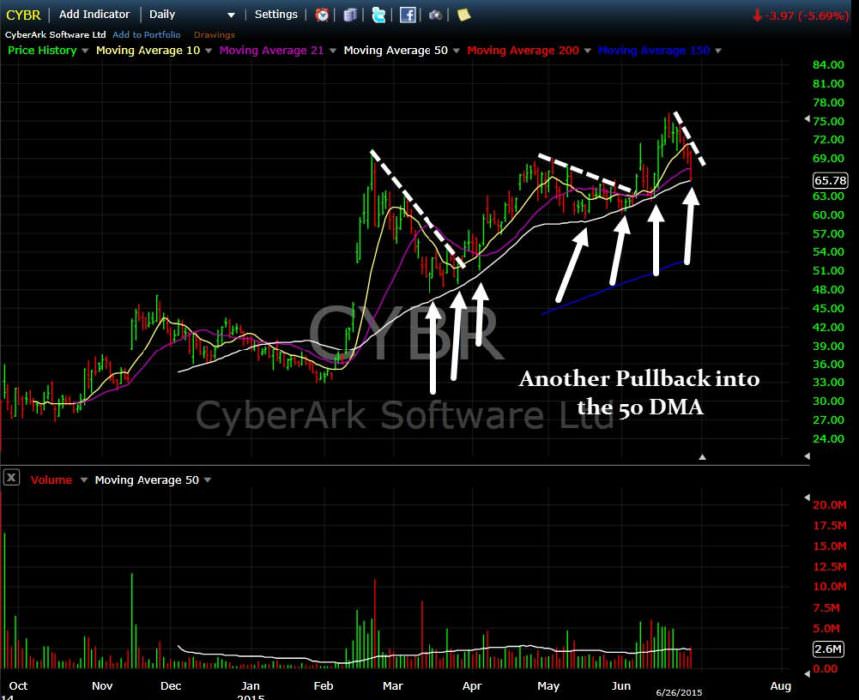
CYBR: New Early Entry And Another Pullback Into The 50 DMA
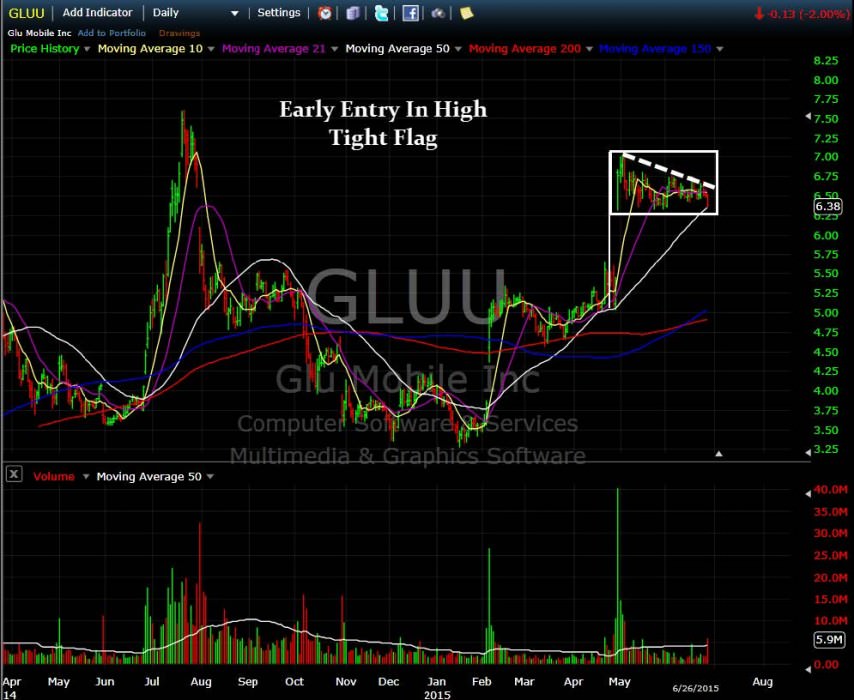
GLUU: New Early Entry Forming In Bullish High Tight Flag
[/su_spoiler]
[su_spoiler title=”Strongest Sectors, Groups, & Symbols” style=”fancy”]
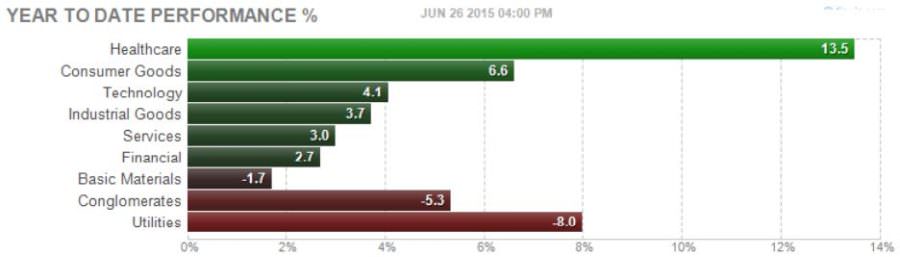
[su_heading style=”modern-1-dark” size=”18″]Strongest Sectors [/su_heading]
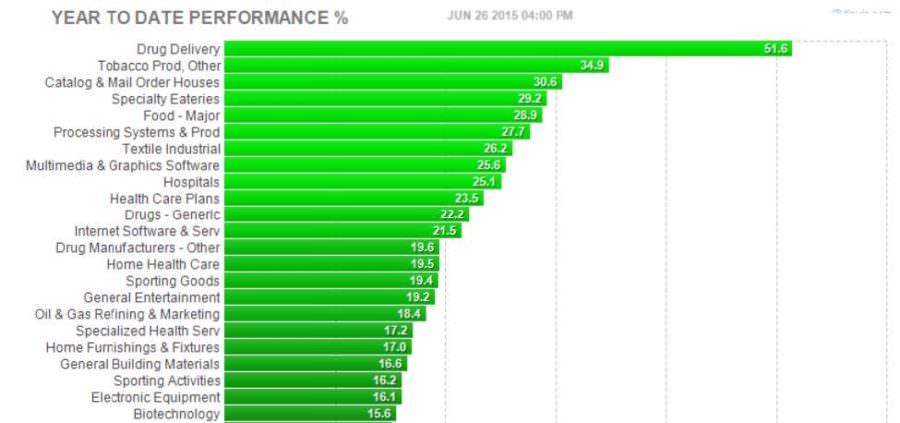
[su_heading style=”modern-1-dark” size=”18″]Strongest Groups [/su_heading]
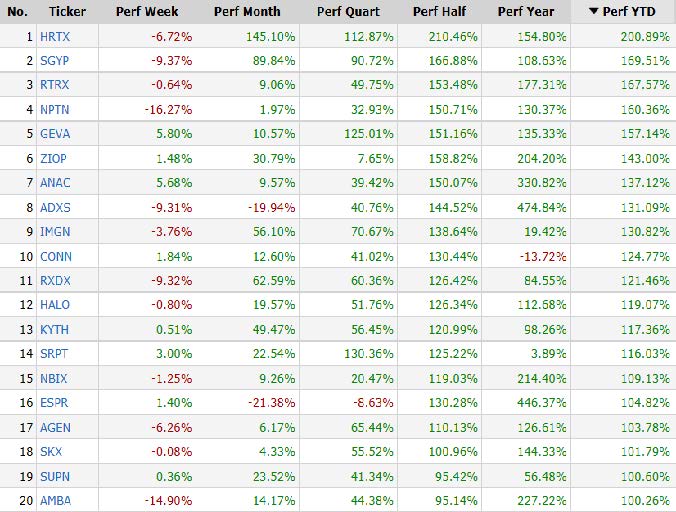
[su_heading style=”modern-1-dark” size=”18″]Strongest Performing Symbols This Year [/su_heading]
These are the top 20 strongest performing tickers on a year-to-date basis that are trading over $5, average daily volume over 500k and have a market cap >300M (Small cap-Mega Cap)
[/su_spoiler]


