

[su_spoiler title=”Monday-Wednesday’s Action: Economy Data Fails To Impress” style=”fancy”]
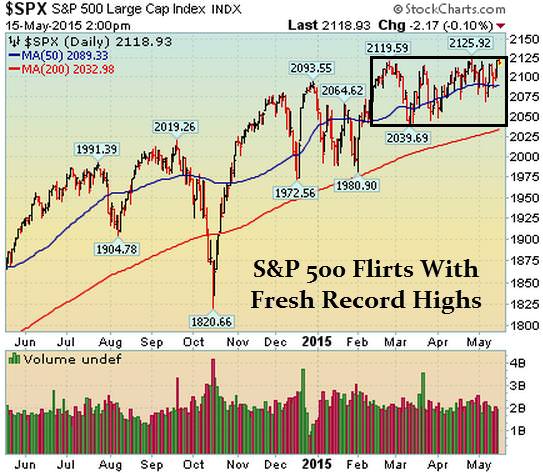
Stocks opened higher on Monday but closed lower as the market paused to digest the big post-jobs rally. San Francisco Fed President John Williams, a voting member of the FOMC, said he believes Q1 economic weakness was an anomaly and that he is looking forward to a stronger pick up in the economy in the second half of the year. Williams is one of the more Centrist Fed officials, with a slight dovish (more easy money) slant. In other news, drama continued regarding the bailout for Greece but nothing substantial happened as they keep kicking the can down the road.
Stocks fell on Tuesday as more selling hit European equity and bond markets. Before the open, Verizon ($VZ) announced plans to acquire AOL Inc ($AOL) for $4.4B in a strong move to control more content. Stocks ended mixed on Wednesday as investors digested the latest round of economic data. Retail sales for April was unchanged, missing estimates for a gain of 0.2%. Auto manufacturers said sales slid in April and missed estimates. The number of units sold fell to 16.5 million SAAR from 17.1 million SAAR. Separately, import and export prices signaled that the economy remains in trouble. Year-on-year import prices fell a very steep 10.7% with export prices down 6.3%. The small business optimism index rose nicely to 96.9 in April, beating estimates for 96.0. Technically, the S&P 500 found support and bounced nicely off its 50 DMA line on Tuesday and closed near its highs for the day (which was a slightly bullish sign). In other news, gold and silver rallied nicely on Wednesday and look like they want to rally from here.
[/su_spoiler]
[su_spoiler title=”Thursday-Friday’s Action: Stocks Rally In Latter Half of The Week” style=”fancy”]
Stocks rallied nicely on Thursday as the US Dollar continued to fall and the Euro rallied. Before Thursday’s open, weekly jobless claims slid to 264k, beating estimates for 276k. Jobless claims slid to a 14 year low which bodes well for the jobs market. The producer price index (PPI) fell -0.4% in April missing estimates for a gain of 0.2%. This suggests deflation remains more of a threat than inflation. The weaker than expected economic data we have seen in recent weeks supports the dovish Fed view and suggests the data-dependent Fed will not raise rates anytime soon. Stocks were quiet on Friday as the latest round of weaker than expected economic data was announced. The Empire State Manufacturing survey came in at 3.09, missing estimates for 5.0. Industrial output fell for a 5th straight month and consumer sentiment experienced its largest decline in 2 years, falling to 88.6, missing estimates for 95.8.
[/su_spoiler]
[su_spoiler title=”Market Outlook: The Central Bank Put Is Alive And Well” style=”fancy”]
Remember, in bull markets surprises happen to the upside. This has been our primary thesis since the end of 2012. We would be remiss not to note that this very strong bull market is aging (celebrated its 6th anniversary in March 2015) and the last two major bull markets ended shortly after their 5th anniversary; 1994-2000 & 2002-Oct 2007). To be clear, the central bank put is very strong and until material damage occurs, the stock market deserves the longer-term bullish benefit of the doubt. As always, keep your losses small and never argue with the tape.
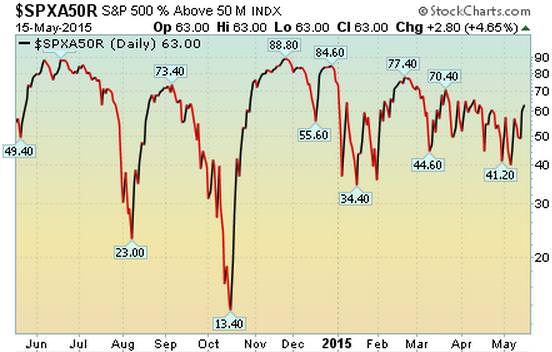
63% Of Stocks in the S&P 500 Are Above Their Respective 50 DMA (Market Tends To Turn When This Reading Gets Above 70% or Below 40%) Observation: Readings above 70% usually (not always) correspond with a short term pullback Conversely, reads below 40% usually (not always) correspond with a short term bounce
[/su_spoiler]
[su_spoiler title=”Big Stock List” style=”fancy”]
- AAPL – Rallied last week and closed above its 50 DMA line
- AMZN – Fell last week (opened higher and closed lower which is not ideal).Still consolidating after strong post-earnings gap up
- EA – Rallied last week and hit a new high. Stock is extended in the short term
- FB – Huge rally last wk after finding support near its longer-term 200 DMA on instant articles news
- FLT – Fell for third straight week as it pulled into its 50 DMA line
- GOOGL – Third weekly decline. Closed post-earnings gap. Not ideal action
- ILMN – Nice rally for the third straight week after the bulls defended the 50 and 200 DMA line
- NFLX – Huge rally last week after breaking out of a new perfect 4 weeks tight bullish flat pattern
- SBUX – Bounced nicely after finding support above its 50 DMA line
- TSLA – Healthy action continues post earnings. Only 1 down week in past 7 weeks
- UA – Fell in three of the past 4 weeks and is now living below its 50 DMA line which is not ideal
- V – Hit a new record high last week then pulled back. Remains perched below all-time highs
[/su_spoiler]
[su_spoiler title=”19 New Setups” style=”fancy”]
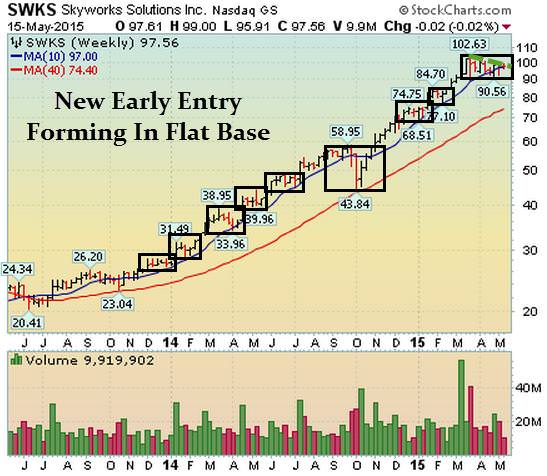
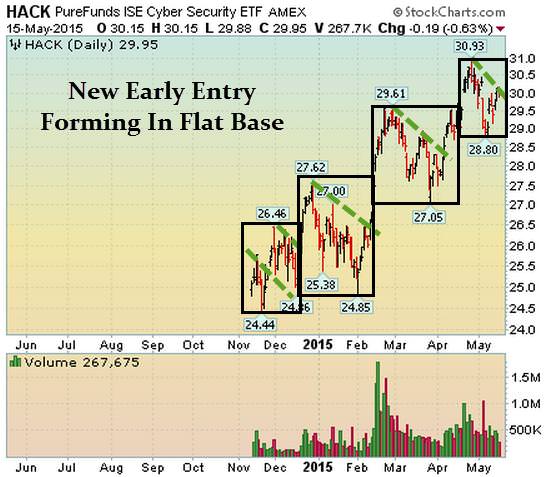
These hand-picked stocks are carefully selected to help with your idea generation and offer you additional setups each week. The setups are based on our proprietary criteria and offer advanced (dotted line) & classic long and short entry points (solid line). Short patterns are typically mirror images of long patterns.
Note: Please Verify All Earnings Dates/Data from Multiple Sources for Every Stock in all our report(s).
Charts Courtesy of Stockcharts.com
SWKS Working Order & Setup: Early Entry Forming In Flat Base
HACK Working Orders & Setup: Early Entry In Flat Base
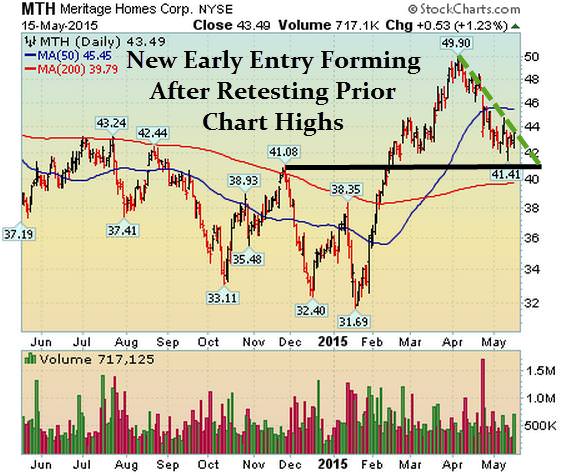
MTH Working Order & Setup: Early Entry Forming In Flat Base
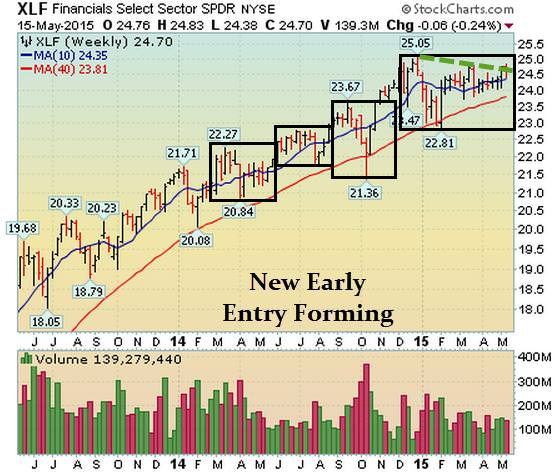
XLF Working Order & Setup: Early Entry Forming In Flat Base
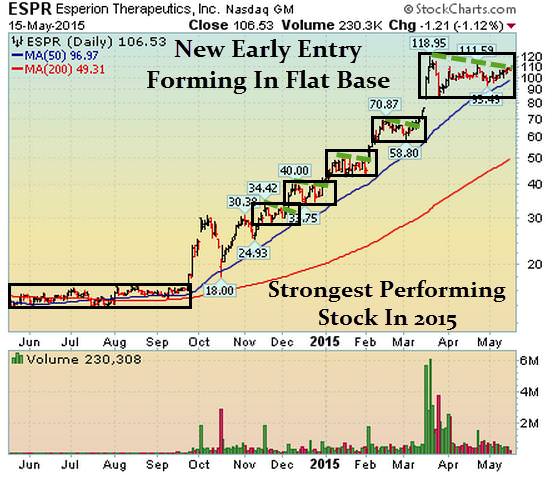
ESPR Setup: Early Entry Forming In Flat Base
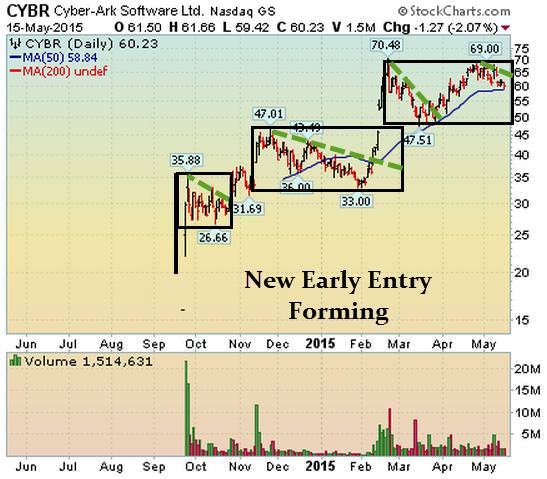
CYBR Setup – New Early Entry Forming
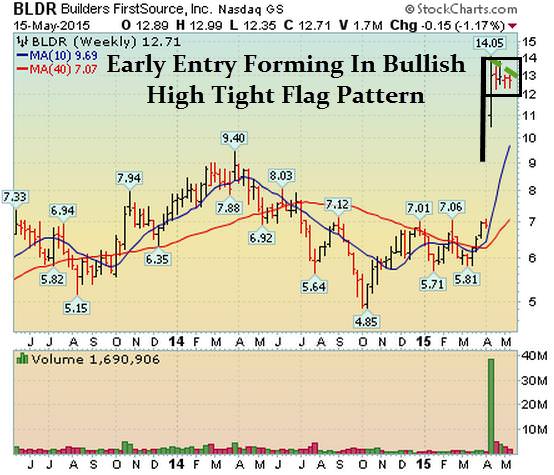
BLDR Setup – Early Entry Forming In Bullish High Tight Flag Pattern
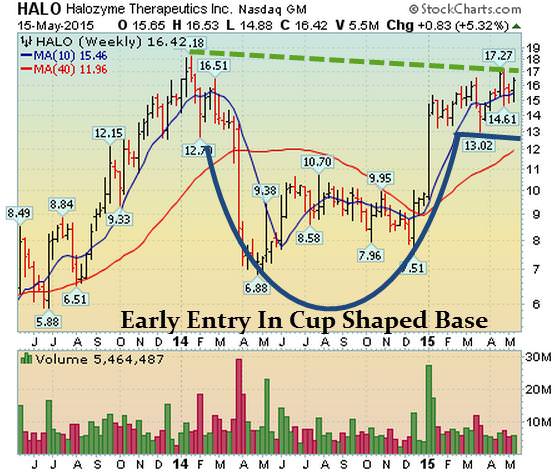
HALO Setup – New Early Entry Forming In Bullish Cup-With-Handle Base
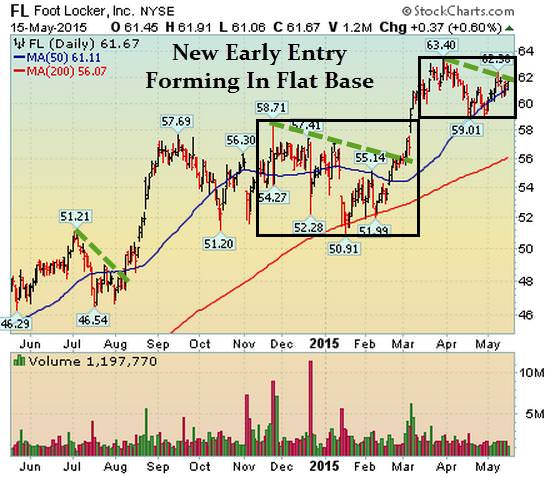
FL Setup: Early Entry Forming In New Flat Base
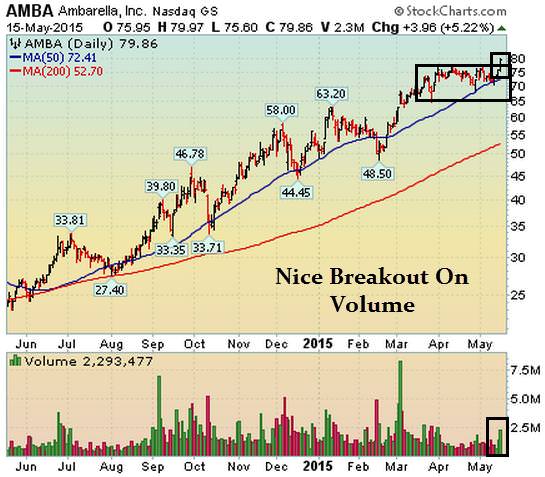
AMBA: Classic Breakout on Heavy Volume
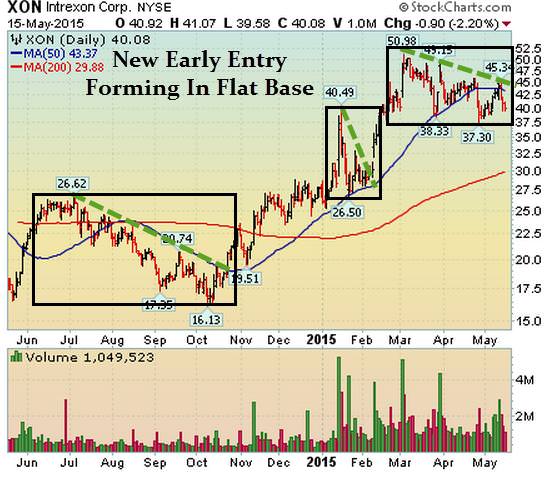
XON Setup: Nice Early Entry Forming In Flat Base
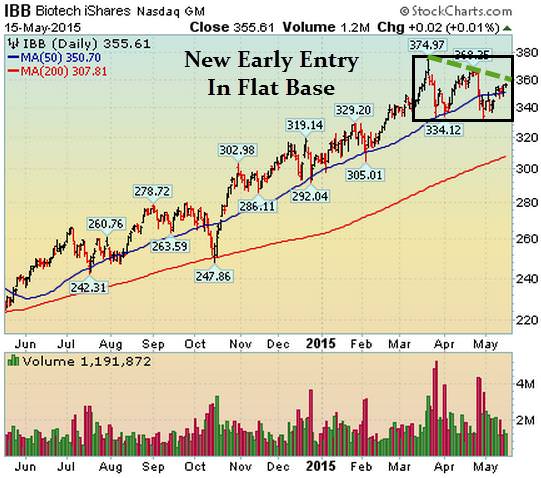
IBB Setup – Nice Early Entry Forming
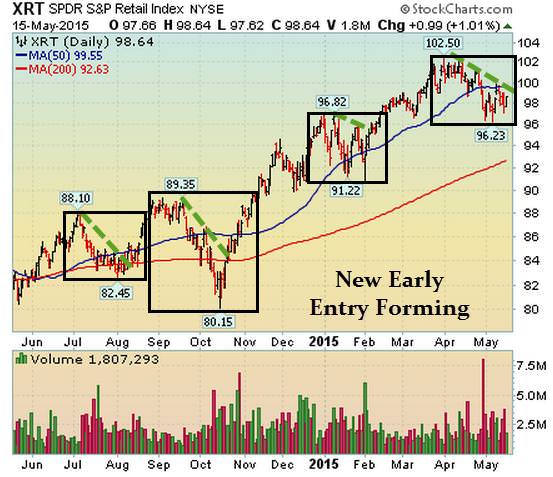
XRT Setup: New Early Entry Forming
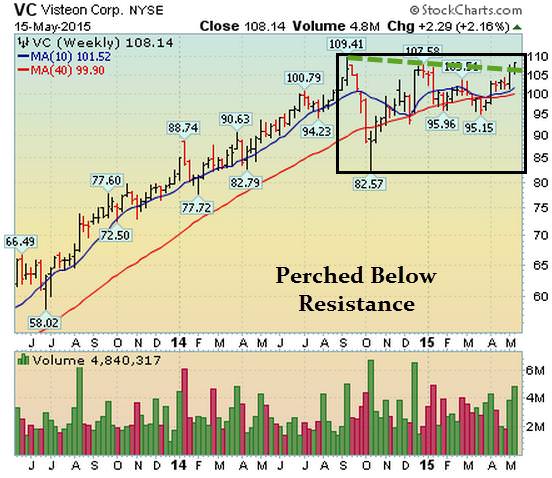
VC Setup: Nice Setup In Long Flat Base
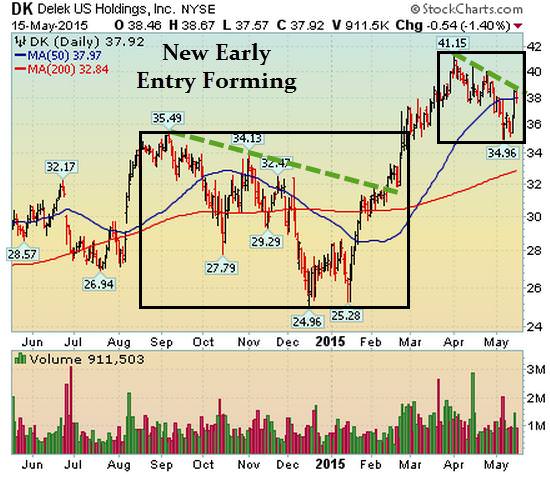
DK Setup: Early Entry Forming In New Flat Base
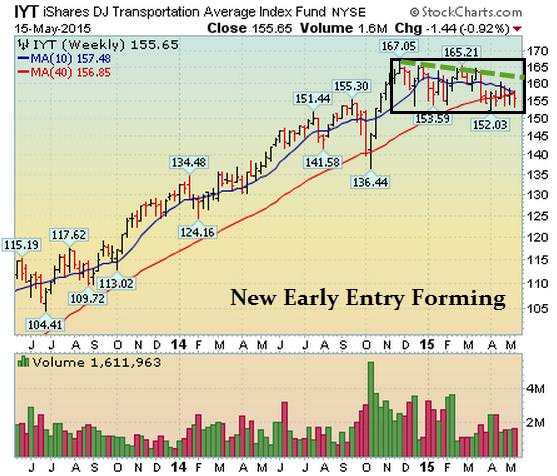
IYT: Nice Early Entry Forming
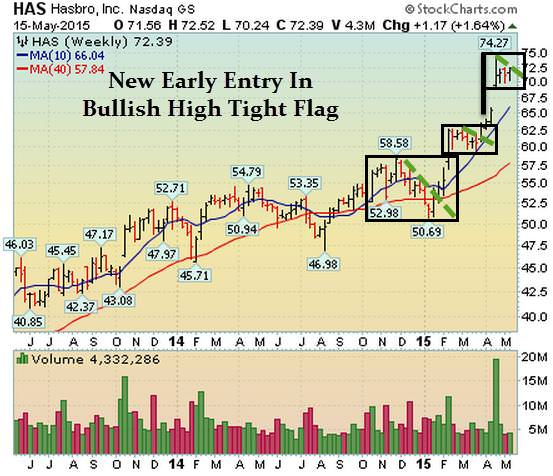
HAS: Bullish 4-Weeks Tight Pattern Forming
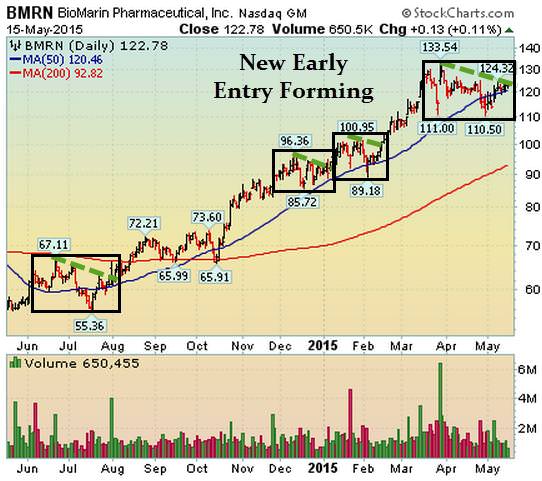
BMRN: New Early Entry Forming In Flat Base
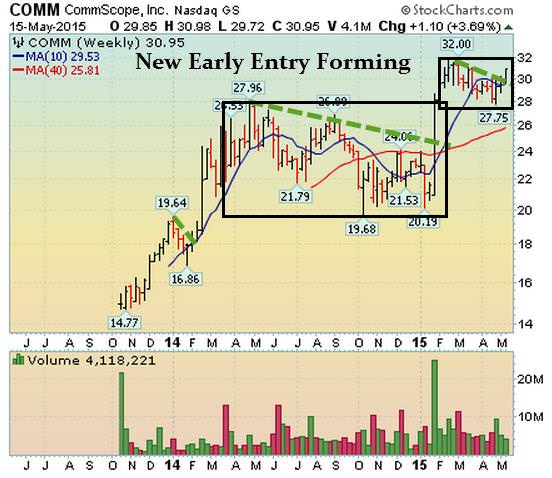
COMM: New Early Entry Forming
[/su_spoiler]
[su_spoiler title=”Strongest Sectors, Groups, & Symbols” style=”fancy”]
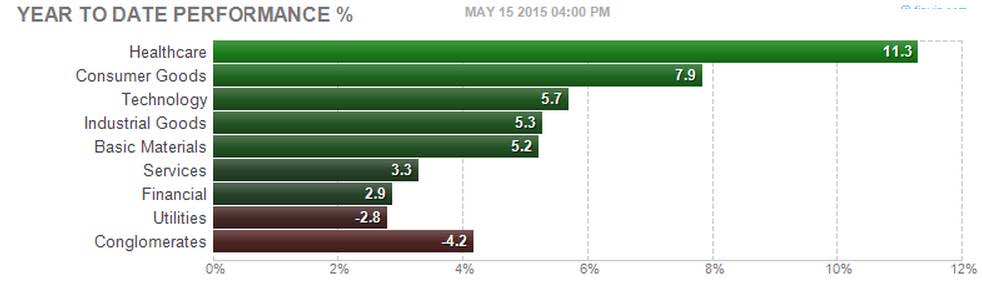
[su_heading style=”modern-1-dark” size=”18″]Strongest Sectors [/su_heading]
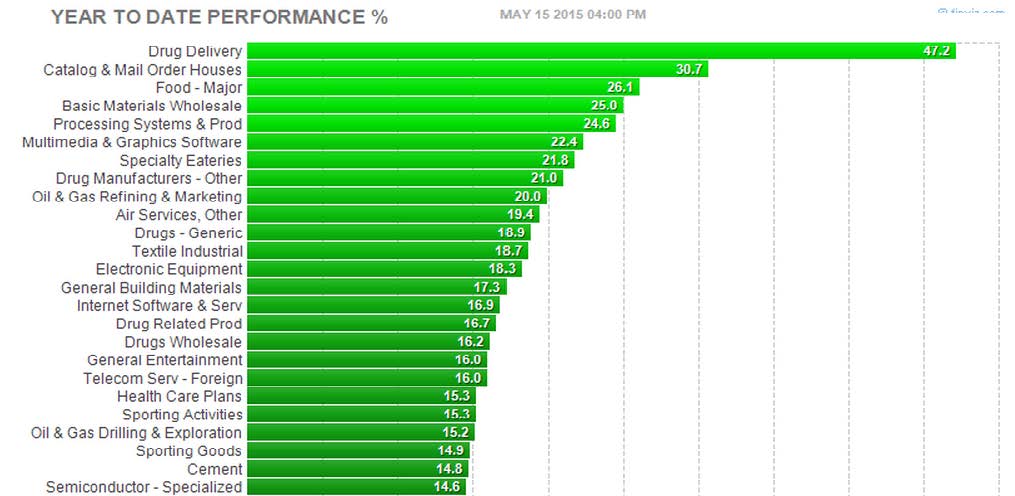
[su_heading style=”modern-1-dark” size=”18″]Strongest Groups [/su_heading]
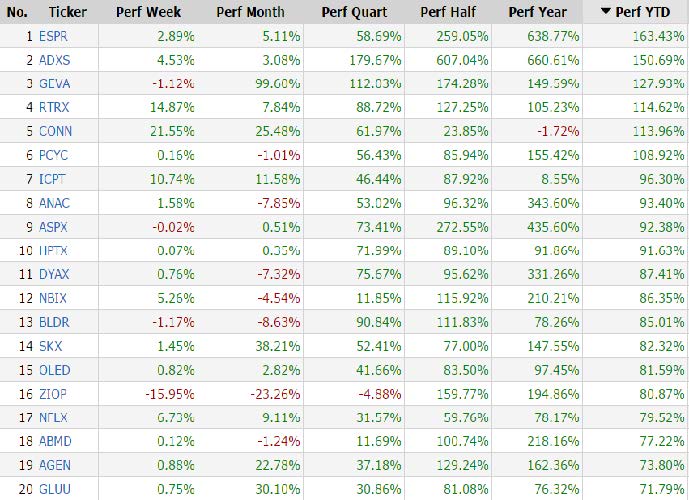
[su_heading style=”modern-1-dark” size=”18″]Strongest Performing Symbols This Year [/su_heading]
These are the top 20 strongest performing tickers on a year-to-date basis that are trading over $5, average daily volume over 500k and have a market cap >300M (Small cap-Mega Cap)
[/su_spoiler]


