

[su_spoiler title=”Monday-Wednesday’s Action: Economy Data Is Not Impressive” style=”fancy”]
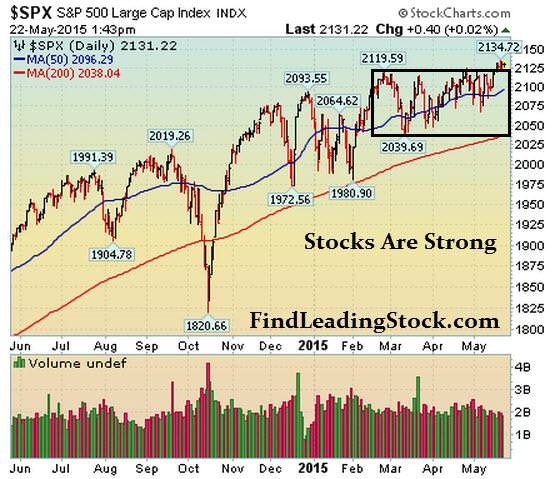
Stocks rallied on Monday helping the Dow Jones Industrial Average and the benchmark S&P 500 hit new record highs. Stocks rallied after the National Association of Home Builders’ survey missed estimates and showed builder confidence fell two points in May. Separately, European stock markets and the Euro were under slight pressure after rumor spread that Greece was on the verge of bankruptcy. Greek bond yields soared, with the 10-year jumping a whopping 7%, after a leaked internal memo from the International Monetary Fund showed the country had little chance of making the June 5 payment. Spanish and Italian bond yields also jumped more than 7% on related fears.
Stocks ended mixed on Tuesday as the U.S. dollar soared and a slew of commodities fell. Overseas, the euro tanked (greenback surged) after Benoit Coeure, an executive member of the European Central Bank, said the central bank plans to “front load” its QE (bond buying) program in the early part of the summer. This basically means they are pumping even more money into the system to help boost asset prices and, in turn, send their equity markets higher and the euro lower. In the U.S., housing starts jumped +20.2% in April to 1.135 million, beating estimates for 1.019M.
Stocks were quiet on Wednesday as the greenback edged higher as a slew of currencies and commodities fell. The Dow transports fell 1.5% and remained under serious pressure. A slew of airline stocks were hammered and Southwest (SAVE) plunged over 8.5% at one point in the day. At 2pm EST, the Federal Reserve released the minutes of their latest Fed meeting which reiterated their recent data-dependent stance. Chicago Fed President Charles Evans said in Munich that a rate hike is not likely to be appropriate until early 2016.
[/su_spoiler]
[su_spoiler title=”Thursday-Friday’s Action: Stocks Flirt With New Highs” style=”fancy”]
On Thursday, stocks were quiet as investors digested the latest round of mixed economic data. Existing home sales fell 3.3% in April, missing estimates for a gain of 1% to 5.24 million units. A separate report showed that manufacturing PMI came in at 53.8 in May, missing estimates for a gain of 54.5. The May U.S. Philadelphia Fed Index rose to 6.7, missing estimates for 8.0. The Conference Board said its leading indicator index, which forecasts future economic activity, rose by 0.7%, beating estimates for a 0.3% gain. Weekly jobless claims fell to 274k, slightly above the 271k forecast. The 4-week moving average remains the lowest since April 2000. Stocks drifted lower on Friday as the transports continue to drag stocks lower. The consumer price index (CPI) rose by 0.1%, matching estimates. Core prices (which strip out food and energy) rose by 0.3%, the fastest gain since January 2013.
[/su_spoiler]
[su_spoiler title=”Market Outlook: The Central Bank Put Is Alive And Well” style=”fancy”]
Remember, in bull markets surprises happen to the upside. This has been our primary thesis since the end of 2012. We would be remiss not to note that this very strong bull market is aging (celebrated its 6th anniversary in March 2015) and the last two major bull markets ended shortly after their 5th anniversary; 1994-2000 & 2002-Oct 2007). To be clear, the central bank put is very strong and until material damage occurs, the stock market deserves the longer-term bullish benefit of the doubt. As always, keep your losses small and never argue with the tape.
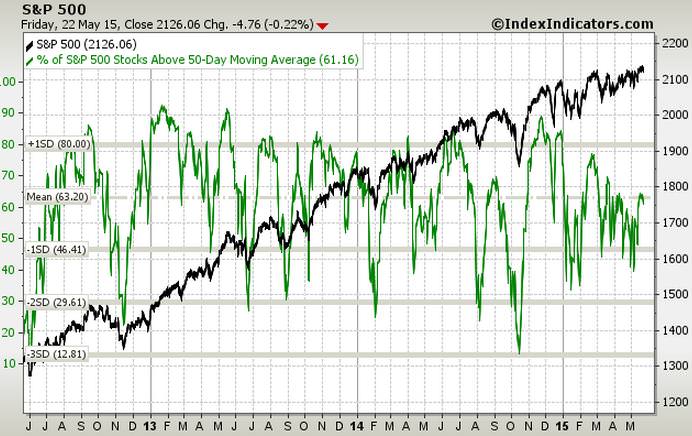
61.16% Of Stocks in the S&P 500 Are Above Their Respective 50 DMA (Market Tends To Turn When This Reading Gets Above 70% or Below 40%) Observation: Readings above 70% usually (not always) correspond with a short term pullback Conversely, reads below 40% usually (not always) correspond with a short term bounce
[/su_spoiler]
[su_spoiler title=”Big Stock List” style=”fancy”]
- AAPL – Rallied for the second straight week after finding support near its 50 DMA line
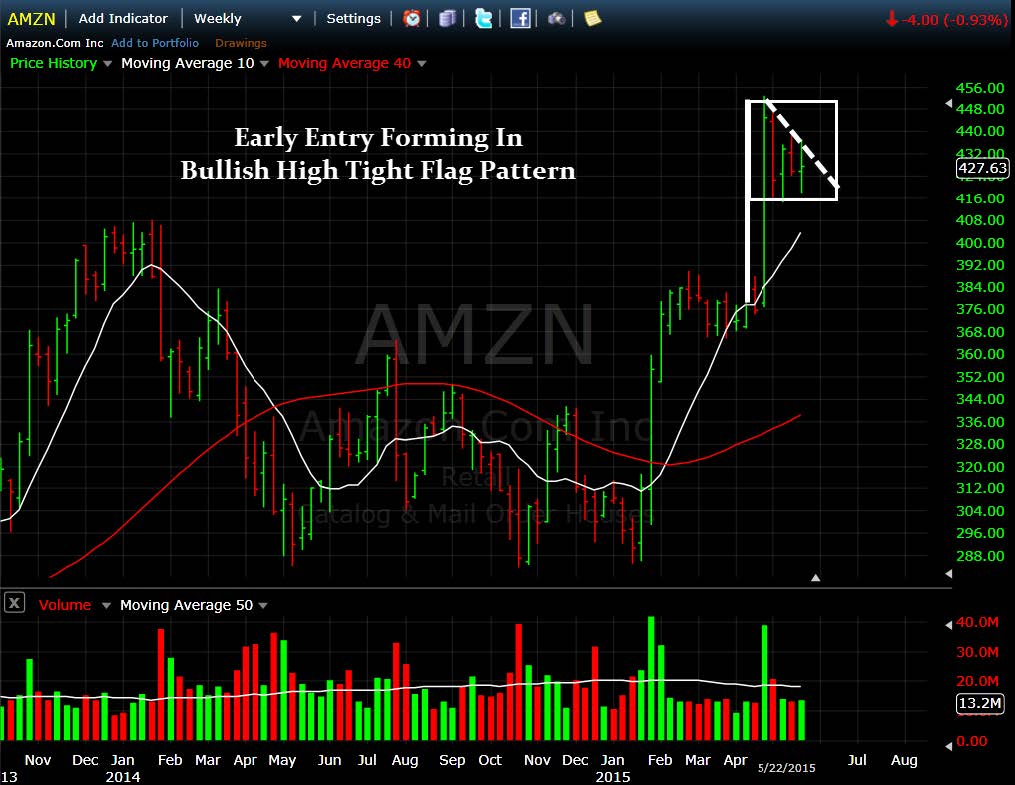
- AMZN – Rallied last week as it continues forming a very nice 5 week flag
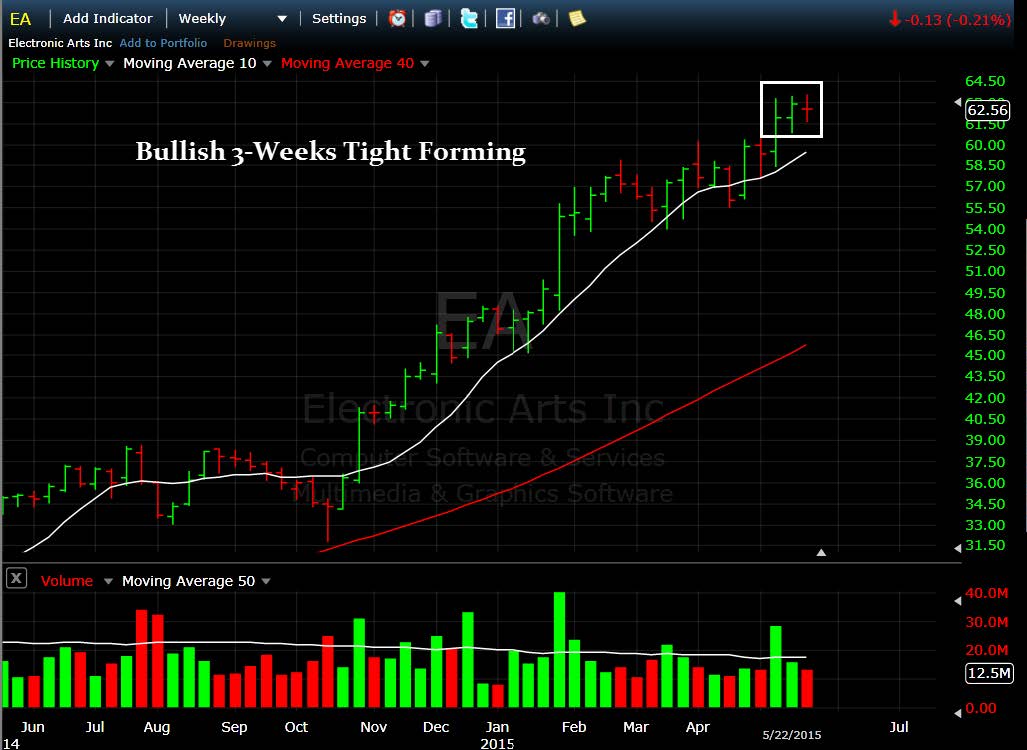
- EA – Edged lower last week as it pulls back from “extended” levels. Nice closes over past 3 weeks
- FB – Rallied last week but encountered resistance near its respective 50 DMA line
- FLT – Fell for 4th straight week and closed below its 50 DMA line
- GOOGL – Snapped a 3 week losing streak and closed near its 50 and 200 DMA lines
- ILMN – Nice rally for 4th straight week as it trades near resistance (record highs)
- NFLX – 3rd straight weekly gain. Remains very extended in near term
- SBUX – Bounced for 2nd straight week after finding support above its 50 DMA line
- TSLA – Healthy action continues post earnings. Closed lower last week but only 2 down weeks in past 8. 2-week tight closes on a weekly basis.
- UA – Rallied last week but continues “living” below its 50 DMA line
- V – Third tight weekly close, best viewed on a weekly chart. Remains perched below all-time highs
[/su_spoiler]
[su_spoiler title=”15 New Setups” style=”fancy”]
These hand-picked stocks are carefully selected to help with your idea generation and offer you additional setups each week. The setups are based on our proprietary criteria and offer advanced (dotted line) & classic long and short entry points (solid line). Short patterns are typically mirror images of long patterns.
Note: Please Verify All Earnings Dates/Data from Multiple Sources for Every Stock in all our report(s).
Charts Courtesy of Stockcharts.com
IBB Setup: Early Entry Forming In Bullish Double Bottom Continuation Pattern

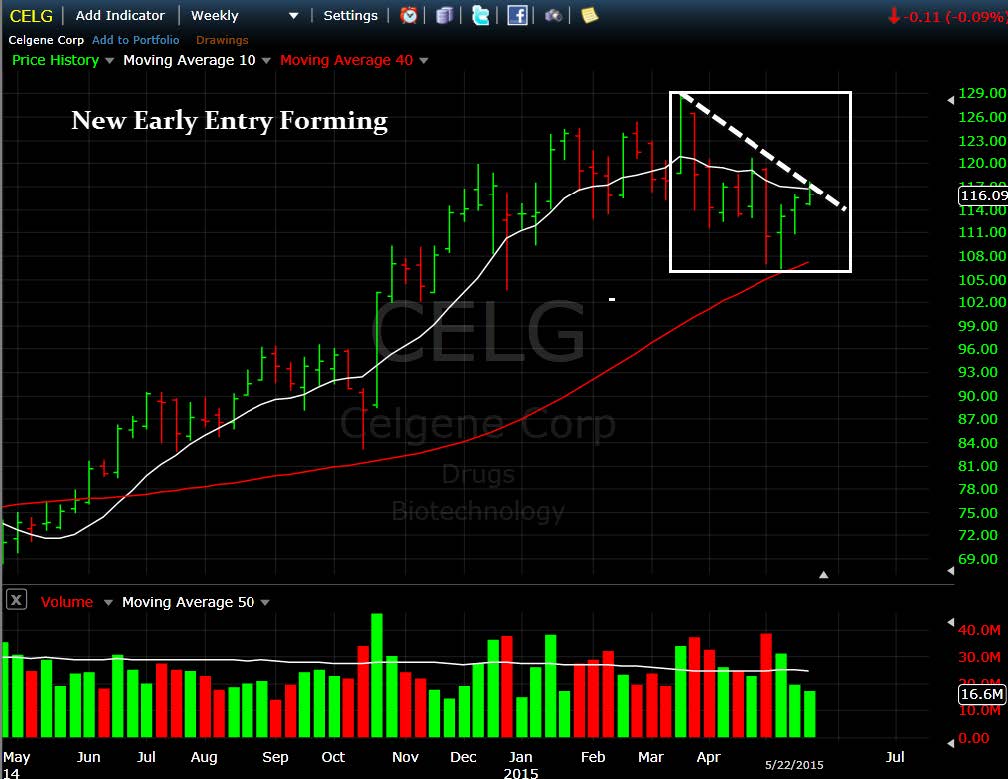
CELG Setup: New Early Entry Forming
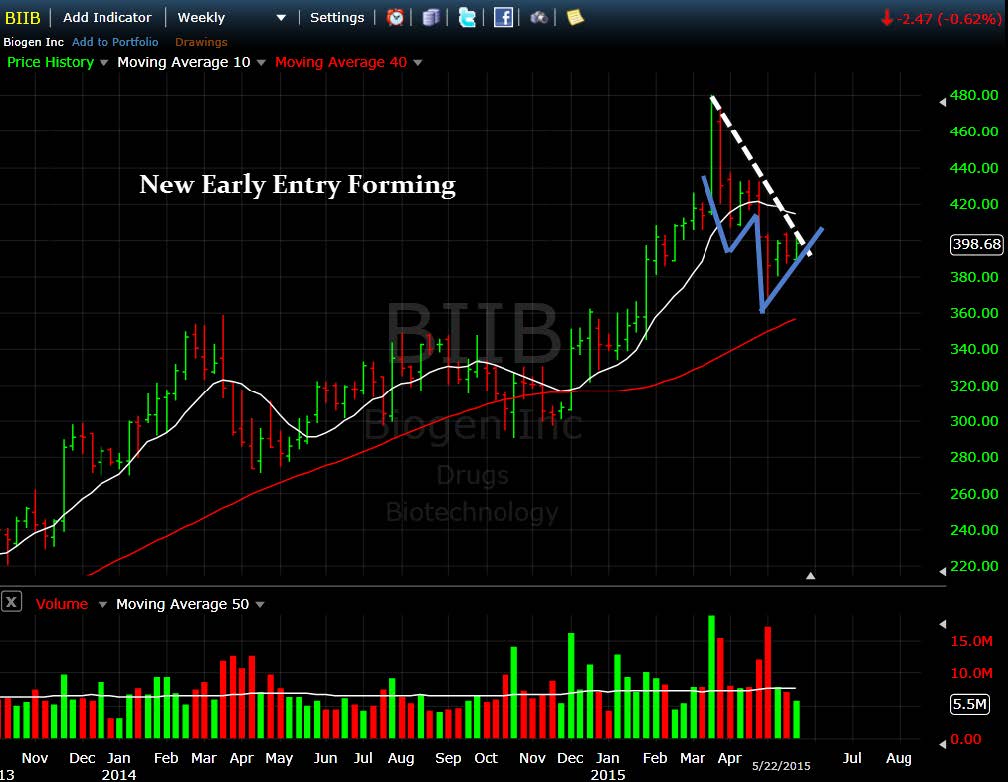
BIIB Setup: New Early Entry Forming
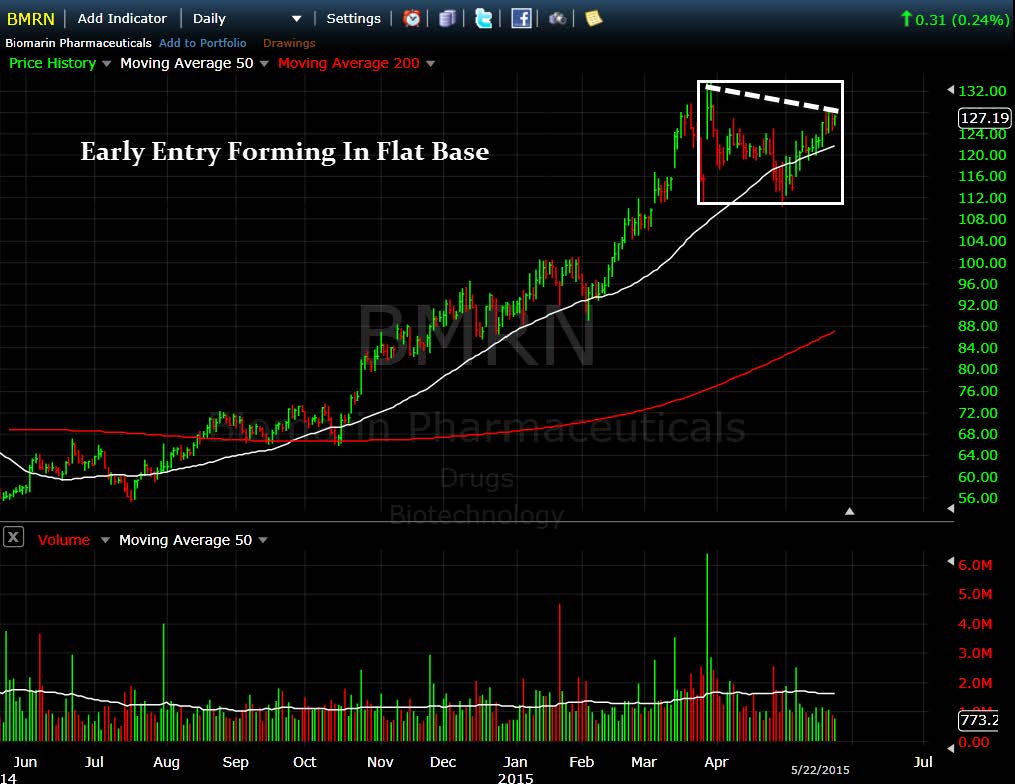
BMRN Setup: Early Entry In Flat Base
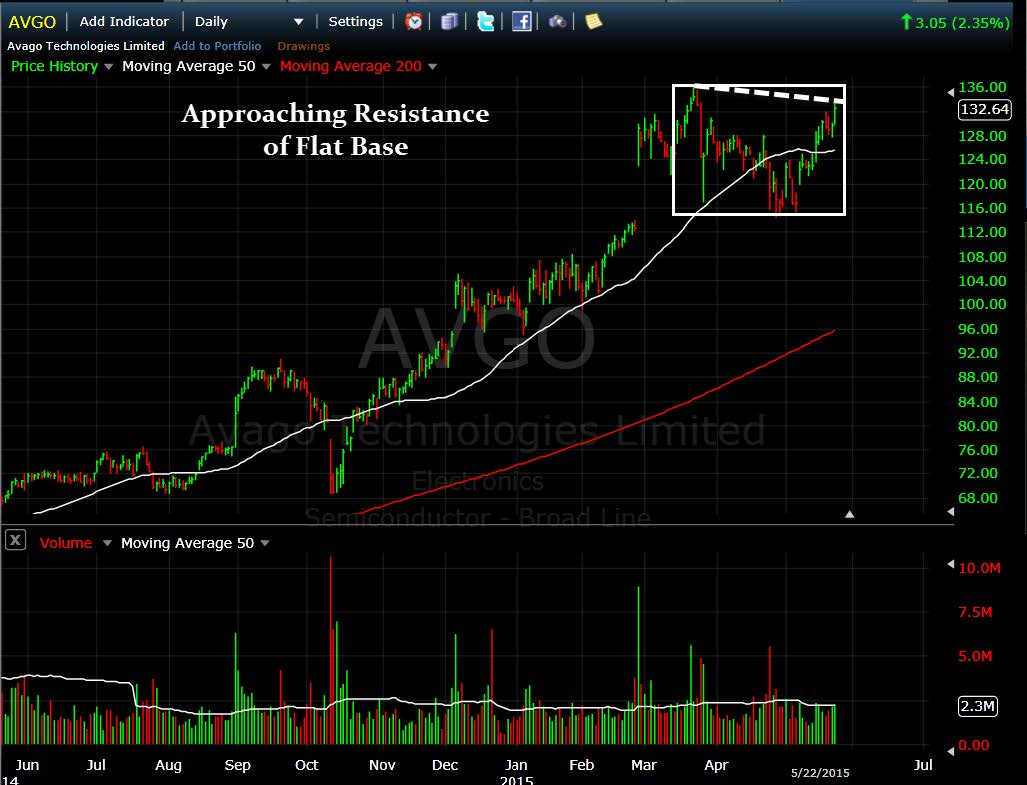
AVGO Setup: Approaching Resistance Of Flat Base
EA Setup: Bullish 3-Weeks Tight Pattern
AMZN Setup: Early Entry Forming In Bullish High Tight Flag
XRT Setup: Early Entry Forming In Flat Base

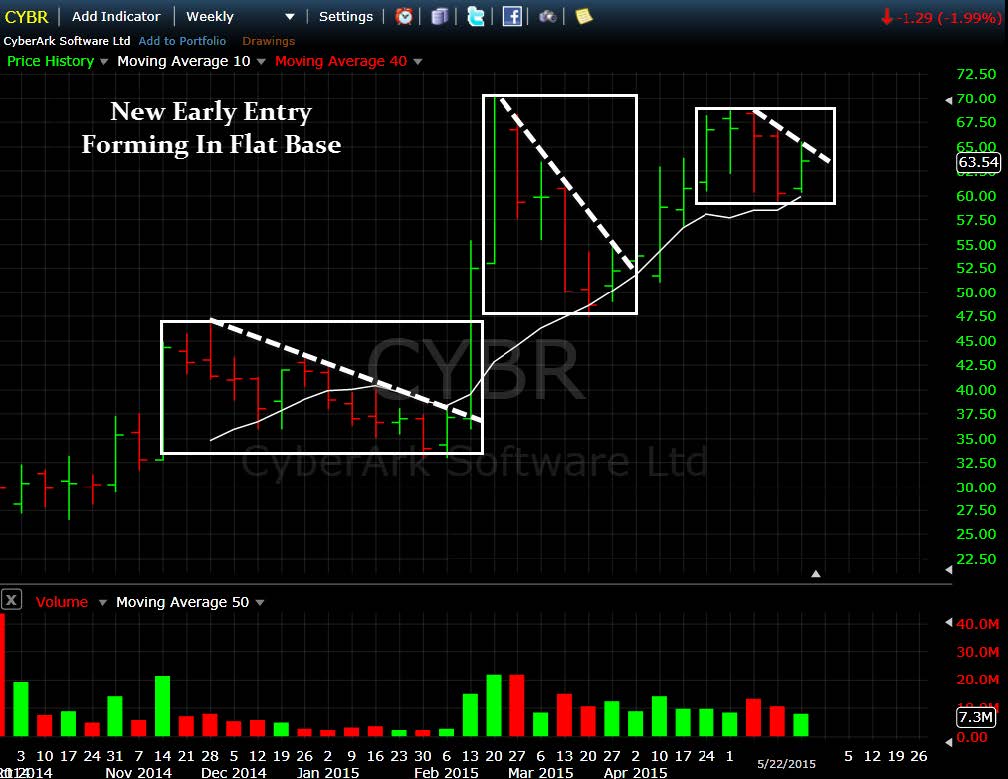
CYBR Setup – New Early Entry Forming
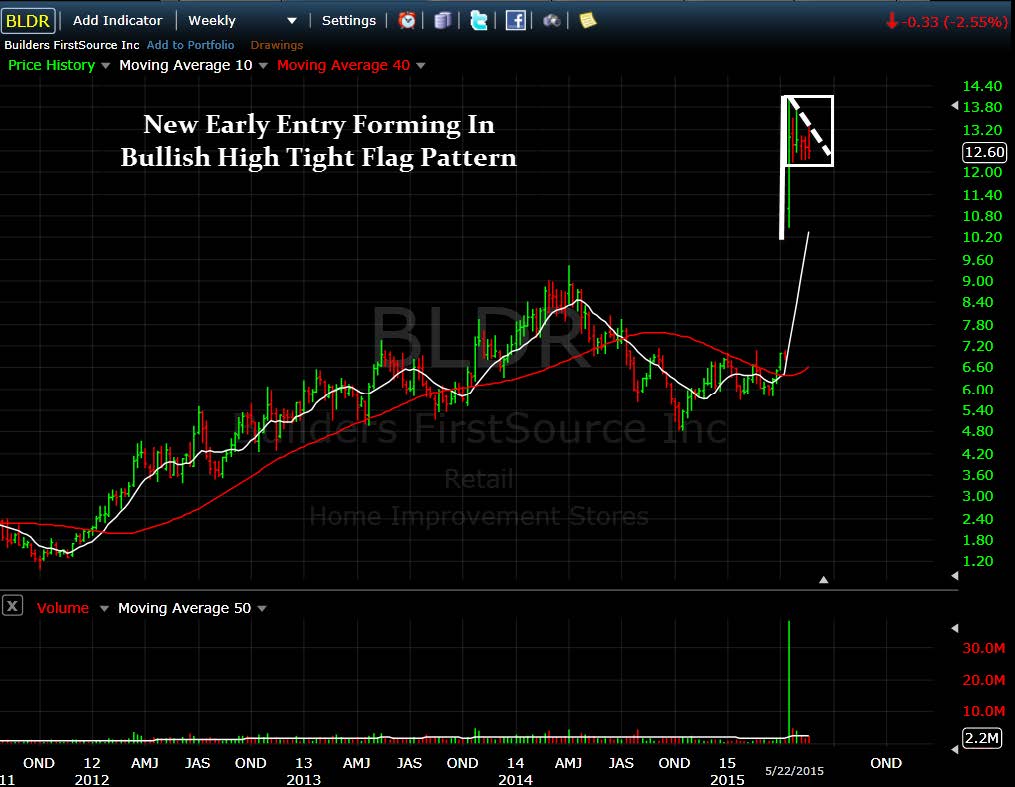
BLDR Setup – Early Entry Forming In Bullish High Tight Flag Pattern
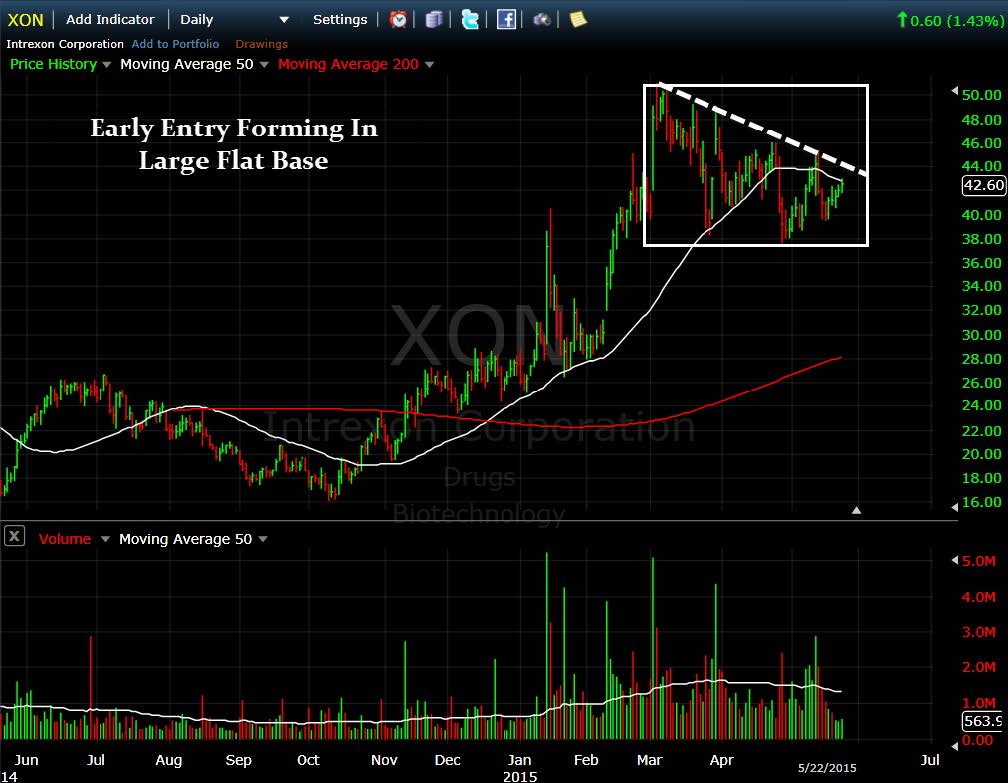
XON Setup: Nice Early Entry Forming In Flat Base
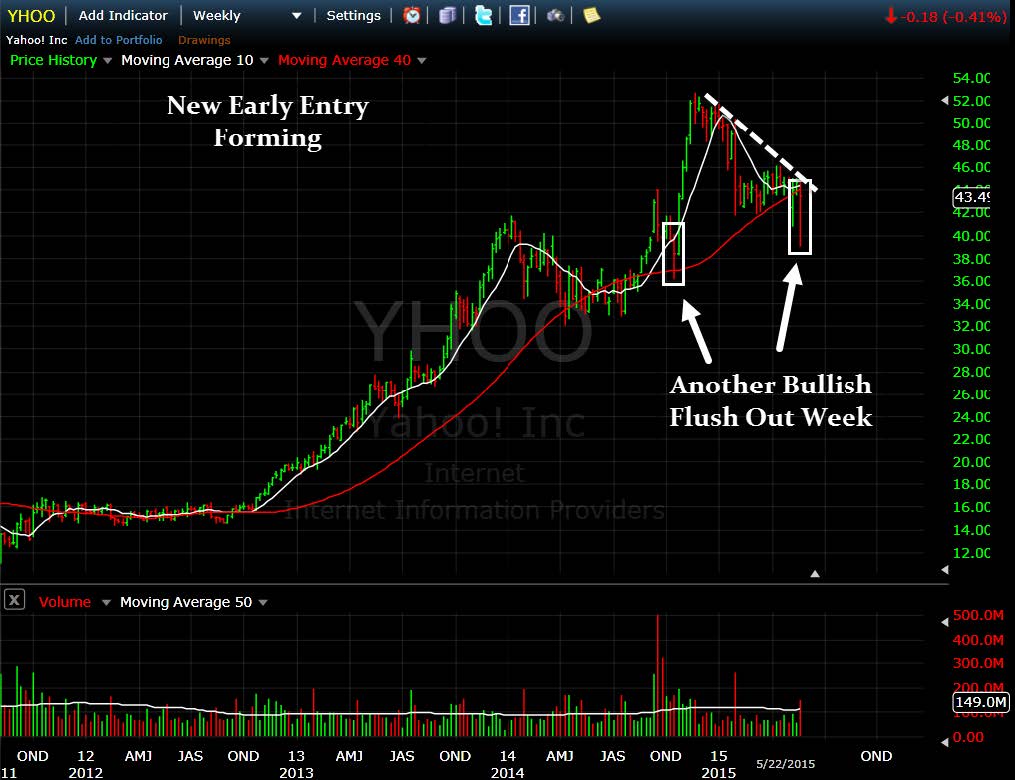
YHOO Setup – Nice Early Entry Forming
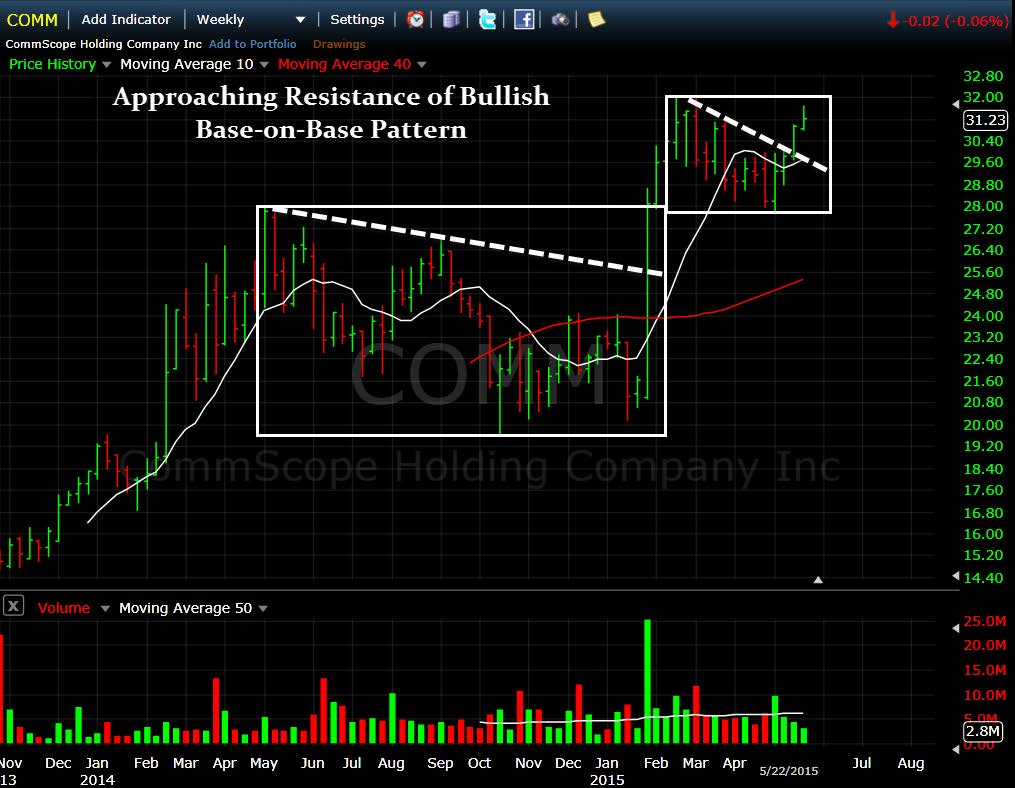
COMM: New Early Entry Forming
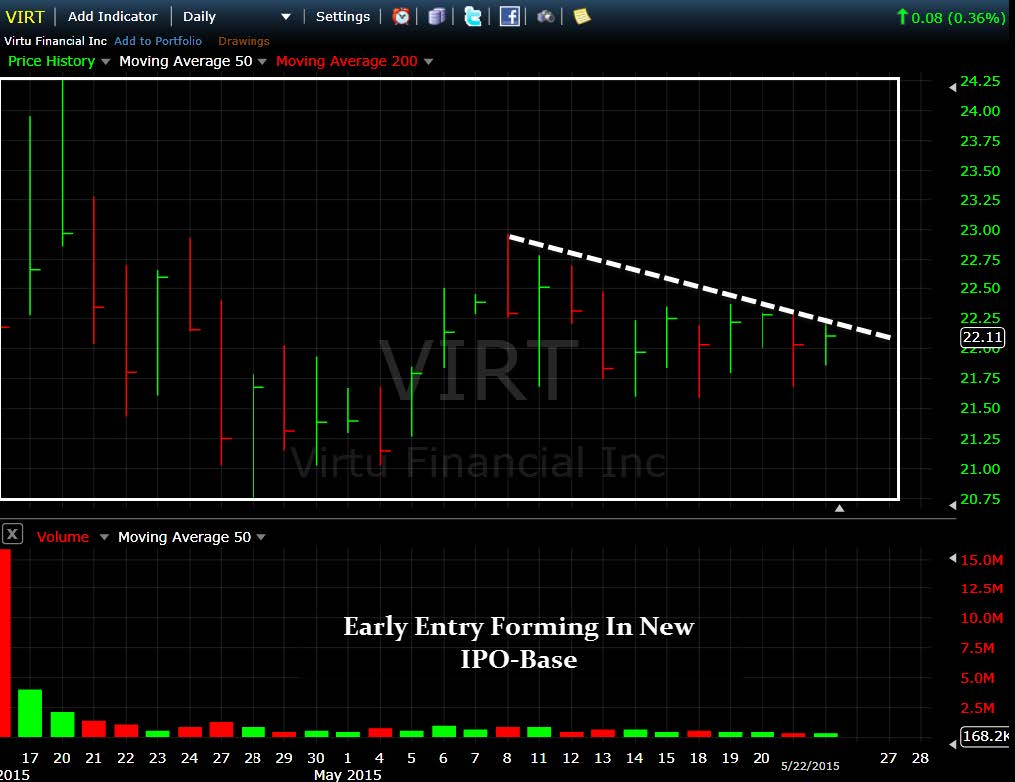
VIRT: New Early Entry Forming
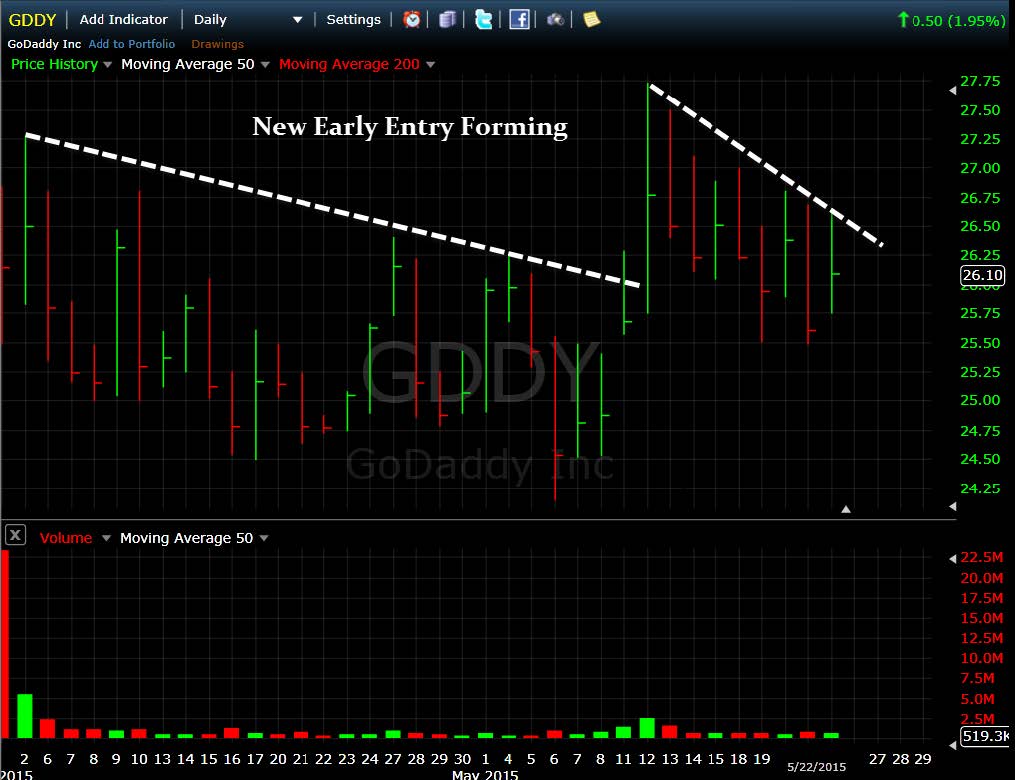
GDDY: New Early Entry Forming
[/su_spoiler]
[su_spoiler title=”Strongest Sectors, Groups, & Symbols” style=”fancy”]
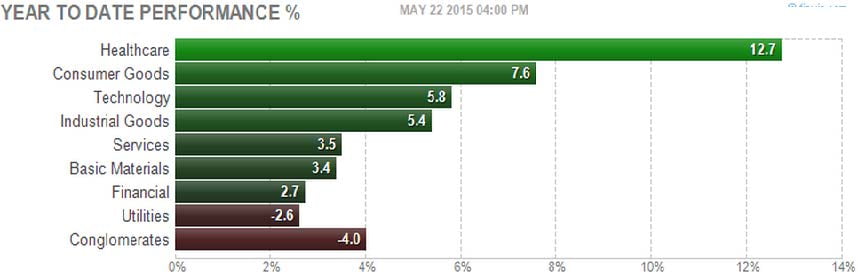
[su_heading style=”modern-1-dark” size=”18″]Strongest Sectors [/su_heading]
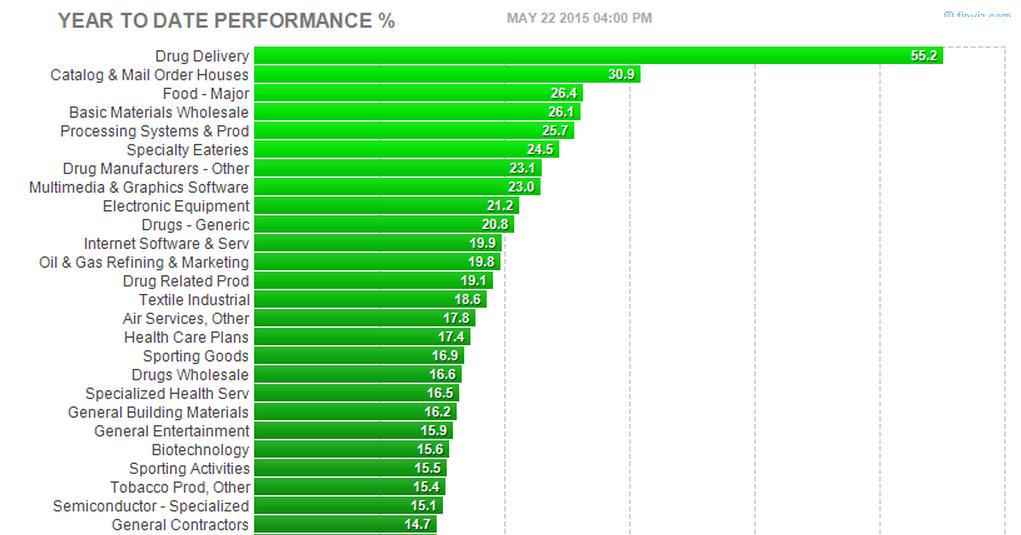
[su_heading style=”modern-1-dark” size=”18″]Strongest Groups [/su_heading]
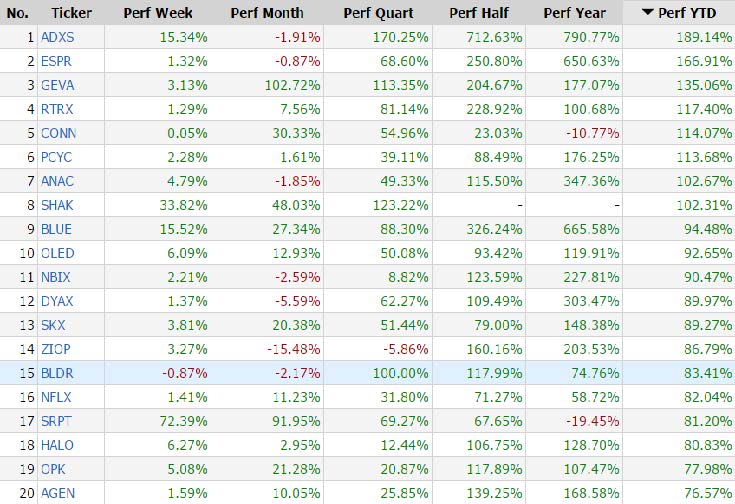
[su_heading style=”modern-1-dark” size=”18″]Strongest Performing Symbols This Year [/su_heading]
[/su_spoiler]


