

[su_spoiler title=”Monday-Wednesday’s Action: Stocks Start Off Weak But Close Week Higher” style=”fancy”]
U.S. stocks opened higher on Monday as investors continued to digest the latest round of economic and earnings data. Overseas, Japan’s Nikkei and UK’s FTSE stock markets were closed for holidays. Economic data was light – U.S. factory orders rose by 2.1% in March, matching estimates. Stocks fell on Tuesday after the latest round of economic data suggested Q1 GDP might actually have been negative. The first reading of Q1 GDP was up 0.2% but the report is subject to a few more revisions before the final number is released. The US dollar fell hard on Tuesday and Crude Oil topped $60/barrel, hitting a fresh high for the year after The U.S. trade deficit came in at $51.4 billion, topping estimates and was the largest reading since 2008 as imports surged. Imports surged largely because the US dollar has increased sharply in recent months. A separate report showed that April’s non-manufacturing ISM jumped to a five-month high, coming in at 57.8, beating estimates for 56.3 and March’s reading of 56.5. Overseas, the drama involving the Grexit (Greece exiting the Eurozone) spiked after the Financial Times reported that the International Monetary Fund may cut a funding lifeline to Greece unless its European partners accept more debt writedowns. Finally, the Australian Central Bank cut interest rates for the second time this year to help spur their economy.
Stocks fell hard on Wednesday after Janet Yellen said, “equity valuations are generally quite high.” Later in the day, Atlanta Federal Reserve bank president Dennis Lockhart said he expects economic growth to pick up but needs more evidence, particularly from consumer spending. Before the open, ADP, the country’s largest private payrolls company, said private employers added 169k new jobs in April, missing estimates for a gain of 205k. A separate report showed that u nit labor costs for the first quarter jumped by 5% but productivity fell -1.9%, slightly higher than the Street’s estimate for -1.8%.
[/su_spoiler]
[su_spoiler title=”Thursday-Friday’s Action: April Jobs Report Hits The Mark” style=”fancy”]
Stocks rallied on Thursday after bonds snapped a long losing streak and rallied as rates fell after a big rally. The US dollar rallied as well which sent Crude oil, gold and other commodities lower. Economic data was relatively quiet as investors waited for Friday’s jobs report. Weekly jobless claims rose by 3k to a seasonally adjusted 265k, which hovered near a 15-year low. Stocks soared on Friday after the government said U.S. employers added 223k new jobs in April, beating estimates for a 220k while the unemployment rate slid to 5.4% (the lowest since before the financial crisis). This report was in-line with the Fed’s view and investors sent stocks higher after the number was released.
[/su_spoiler]
[su_spoiler title=”Market Outlook: The Central Bank Put Is Alive And Well” style=”fancy”]
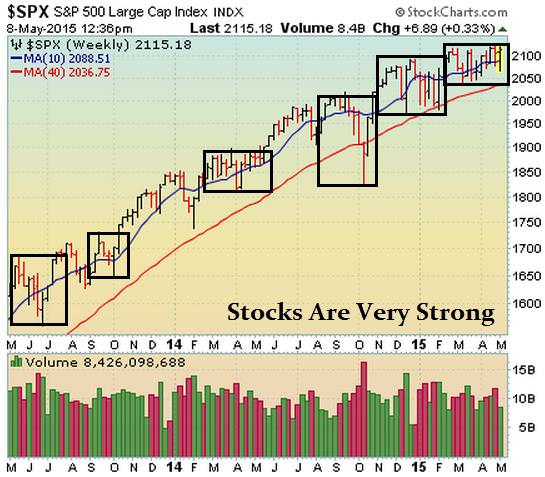
Remember, in bull markets surprises happen to the upside. This has been our primary thesis since the end of 2012. We would be remiss not to note that this very strong bull market is aging (celebrated its 6th anniversary in March 2015) and the last two major bull markets ended shortly after their 5th anniversary; 1994-2000 & 2002-Oct 2007). To be clear, the central bank put is very strong and until material damage occurs, the stock market deserves the longer-term bullish benefit of the doubt. As always, keep your losses small and never argue with the tape.
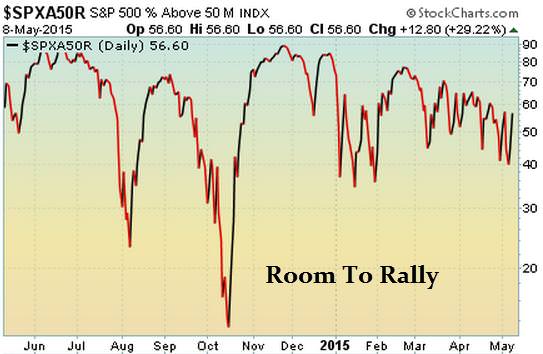
56.6% Of Stocks in the S&P 500 Are Above Their Respective 50 DMA (Market Tends To Turn When This Reading Gets Above 70% or Below 40%) Observation: Readings above 70% usually (not always) correspond with a short term pullback Conversely, reads below 40% usually (not always) correspond with a short term bounce
[/su_spoiler]
[su_spoiler title=”Big Stock List” style=”fancy”]
- AAPL – Closed in the middle of the weekly range and above its 50 DMA. New early entry forming
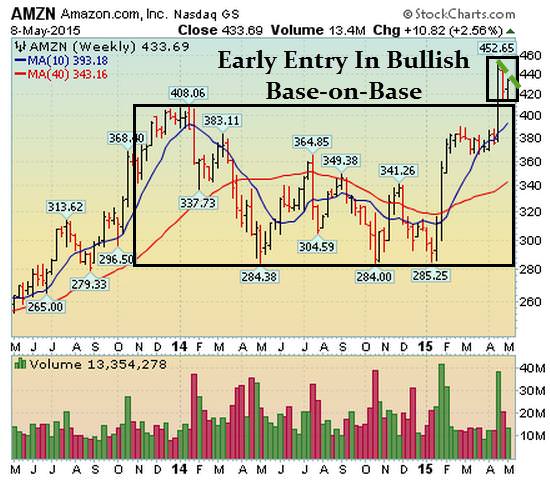
- AMZN – Positive reversal last week (opened lower and closed higher). Broke above short early entry
- EA – Rallied after reporting earnings last week. Stock and group looks like they want to rally
- FB – Fell last week but closed near the highs for the week after the bulls defended the 200 DMA line. Group under serious pressure after: TWTR, YELP, & LNKD got decimated post earnings. YELP rumored to be on the market. FB or any other big company could easily buy them out…
- FLT – Fell last week but closed in the middle of its range after negating latest breakout
- GOOGL – Nice rebound off the lows last week as the bulls showed up and defended support ($529)
- ILMN – Nice rally for the second straight week after the bulls defended the 200 DMA line
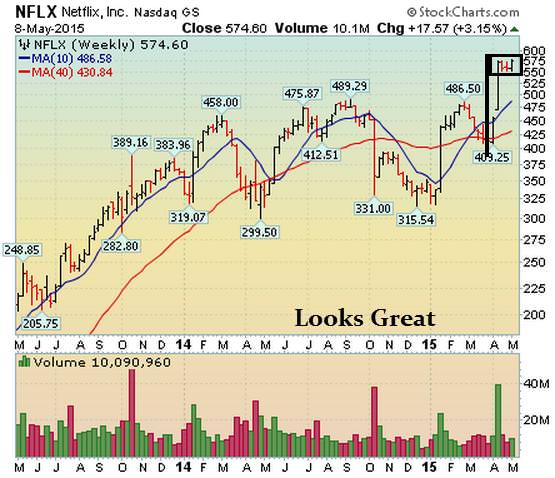
- NFLX – Forming a very nice bullish flag/high handle pattern and looks like wants to rally from here
- SBUX – Fell last week but closed off its lows after bulls defended 50 DMA line
- TSLA – Healthy action continues post earnings. Only 1 down week in past 6
- UA – Snapped a two week losing streak and closed near its 50 DMA line
- V – Nice rally last week as this stock continues to build its latest base
[/su_spoiler]
[su_spoiler title=”21 New Setups” style=”fancy”]
These hand-picked stocks are carefully selected to help with your idea generation and offer you additional setups each week. The setups are based on our proprietary criteria and offer advanced (dotted line) & classic long and short entry points (solid line). Short patterns are typically mirror images of long patterns.
Note: Please Verify All Earnings Dates/Data from Multiple Sources for Every Stock in all our report(s).
Charts Courtesy of Stockcharts.com
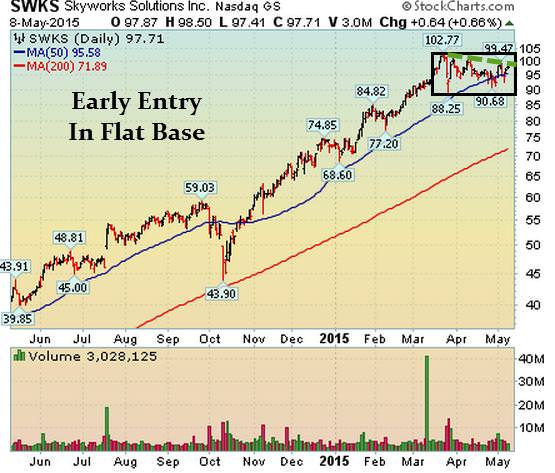
SWKS Working Order & Setup: Early Entry Forming In Flat Base
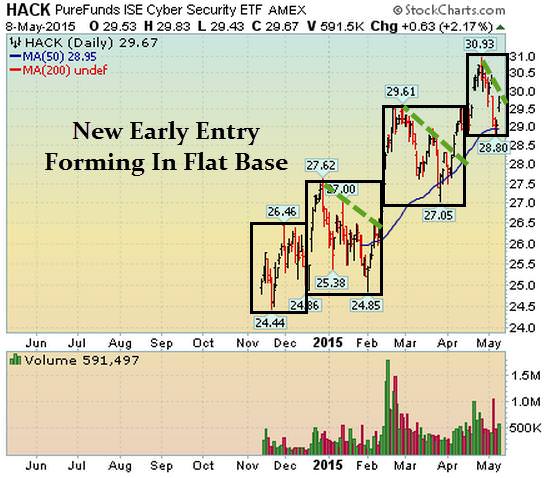
HACK Working Orders & Setup: Early Entry In Flat Base
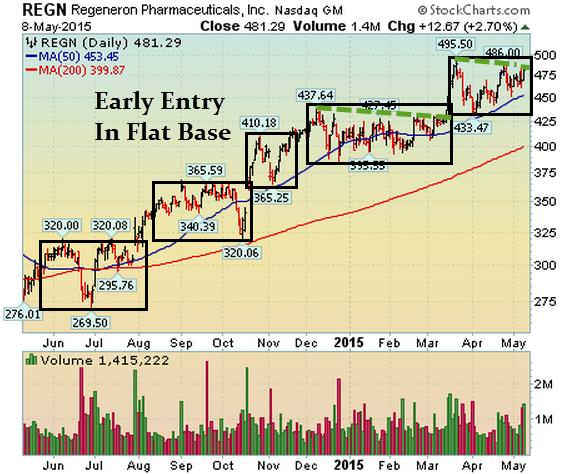
REGN Working Order & Setup: Early Entry Forming In Flat Base
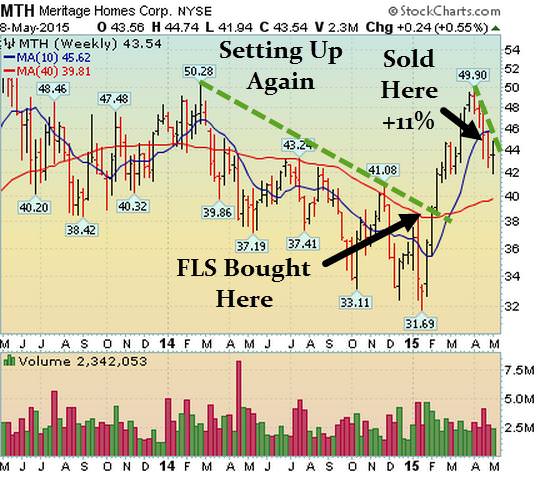
MTH Working Order & Setup: Early Entry Forming In Flat Base
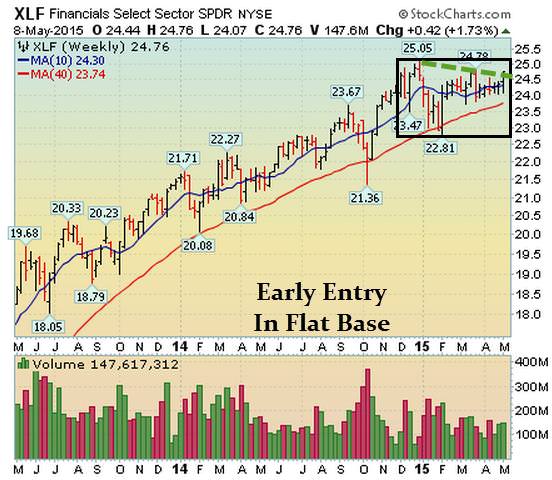
XLF Working Order & Setup: Early Entry Forming In Flat Base
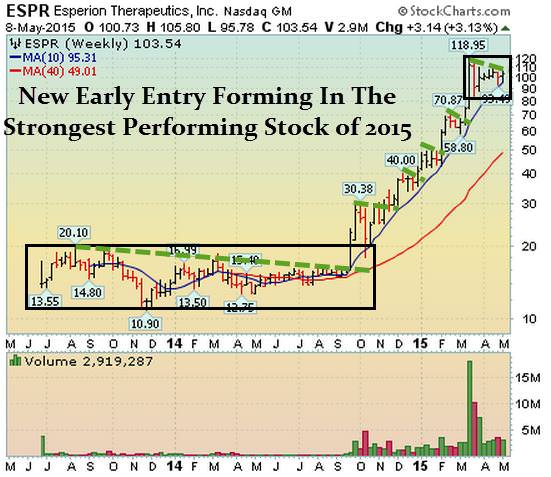
ESPR Setup – Another Nice Early Entry Is Forming
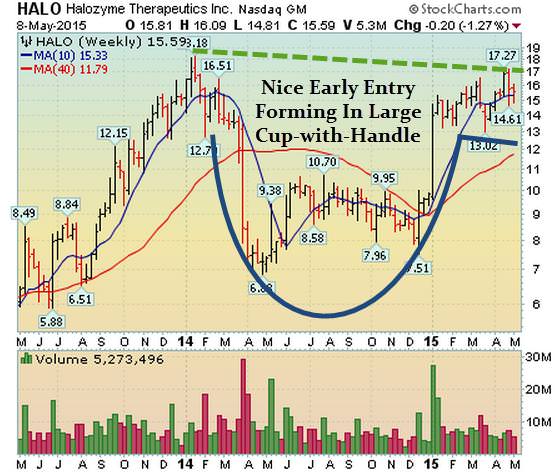
HALO Setup – Nice Early Entry Forming In Bullish-Cup-Shaped Base
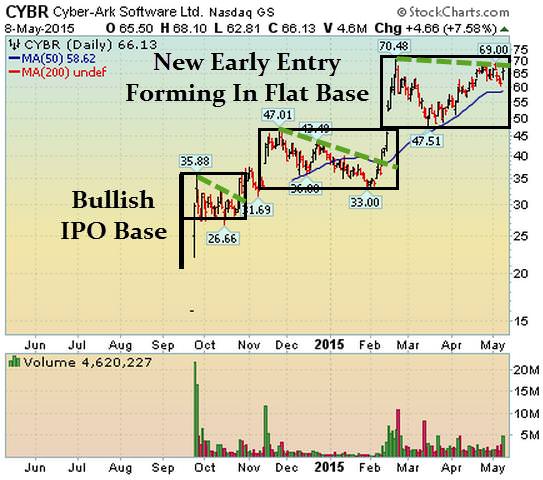
CYBR Setup – New Early Entry Forming In Bullish Base-on-Base Pattern
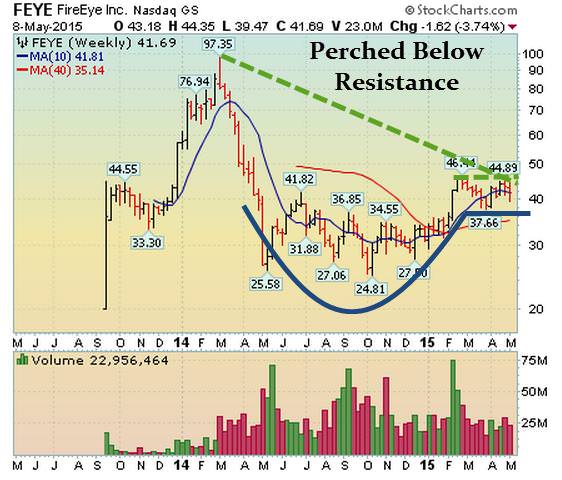
FEYE Setup: Early Entry Forming As It Flirts With Mid-Level Resistance
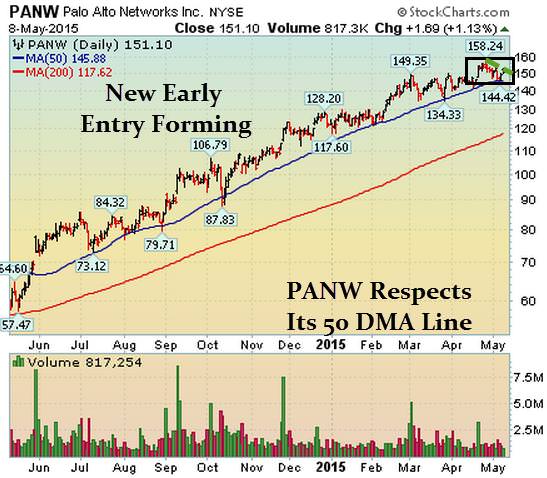
PANW: New Early Entry Forming Off 50 DMA Line
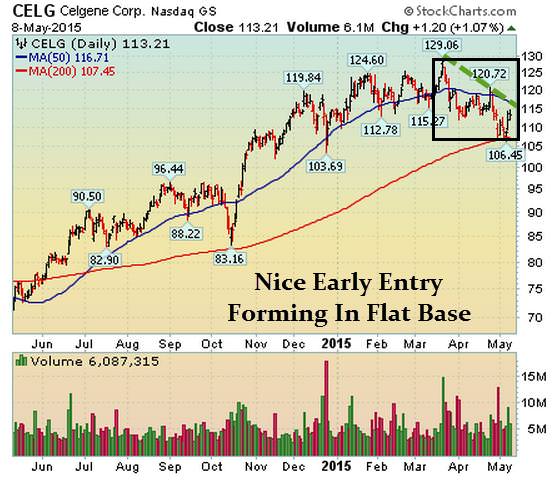
CELG Setup: Nice Early Entry Forming
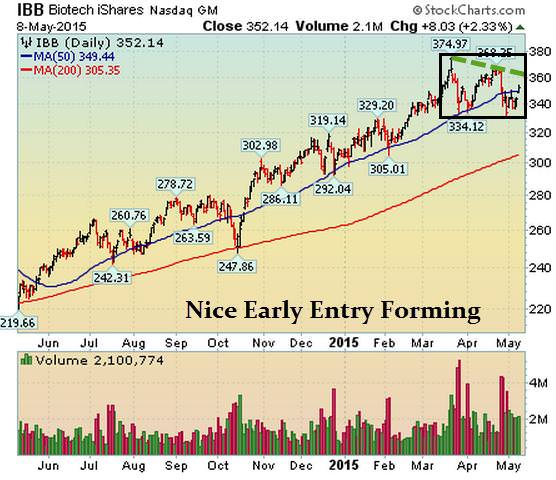
IBB Setup – Nice Early Entry Forming
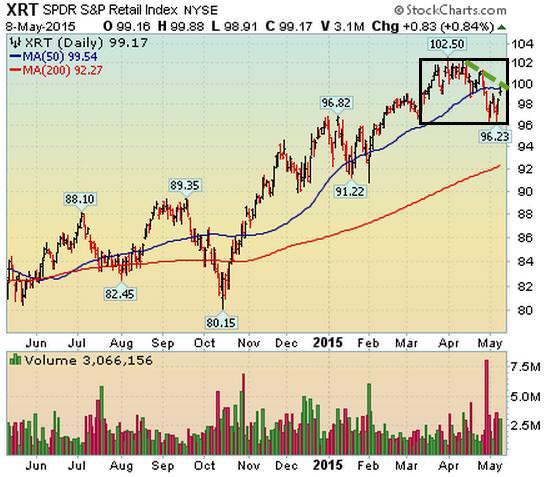
XRT Setup: New Early Entry Forming
NFLX Setup: Nice Setup Post Earnings
AMZN Setup: Early Entry Forming In Bullish Base-on-Base Pattern
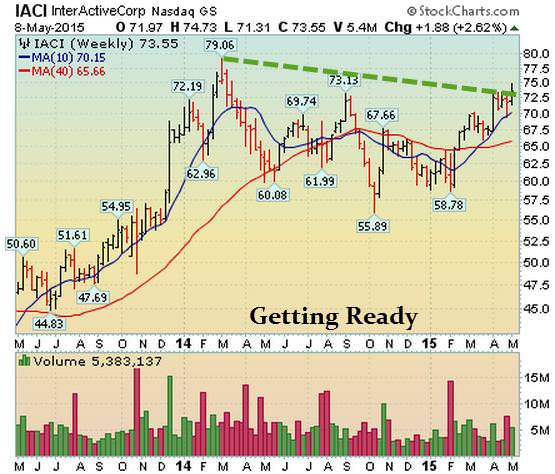
IACI Setup: Getting Ready To Run
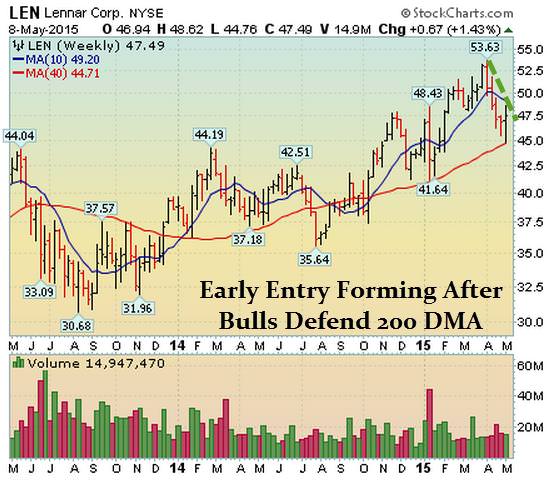
LEN: Early Entry Forming After Bulls Defend 200 DMA
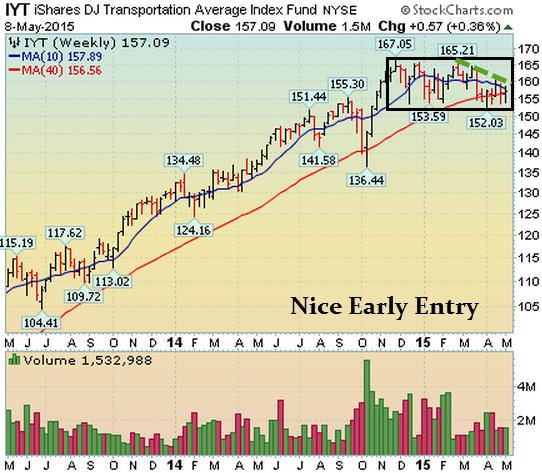
IYT: Nice Early Entry Forming
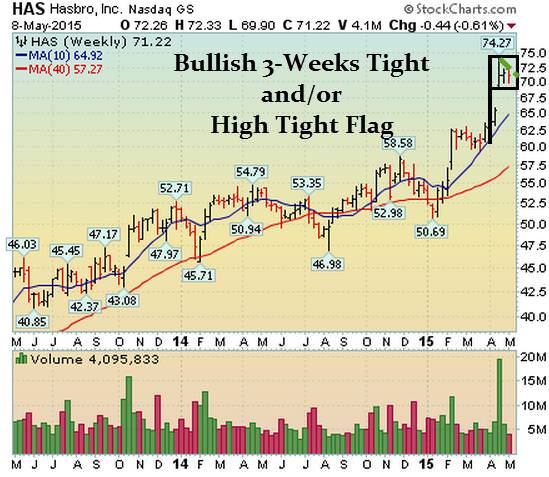
HAS: Bullish 3-Weeks Tight Pattern Forming
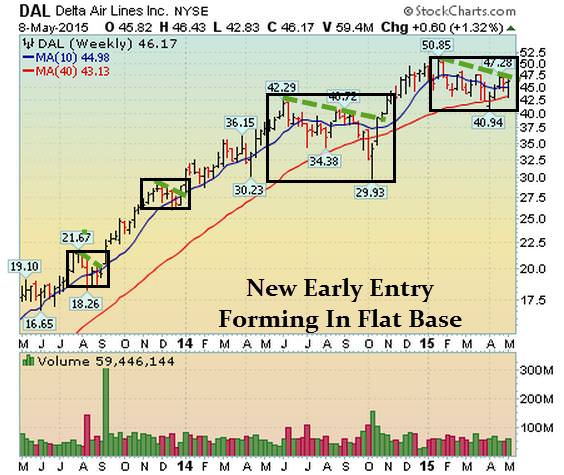
DAL: New Early Entry Forming In Flat Base
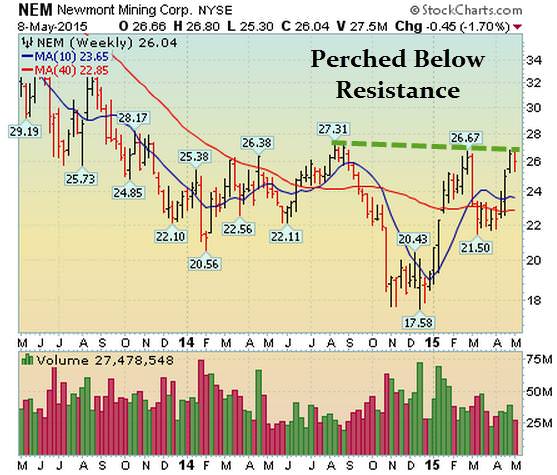
NEM: Bullish 3-Weeks Tight Pattern Forming
[/su_spoiler]
[su_spoiler title=”Strongest Sectors, Groups, & Symbols” style=”fancy”]
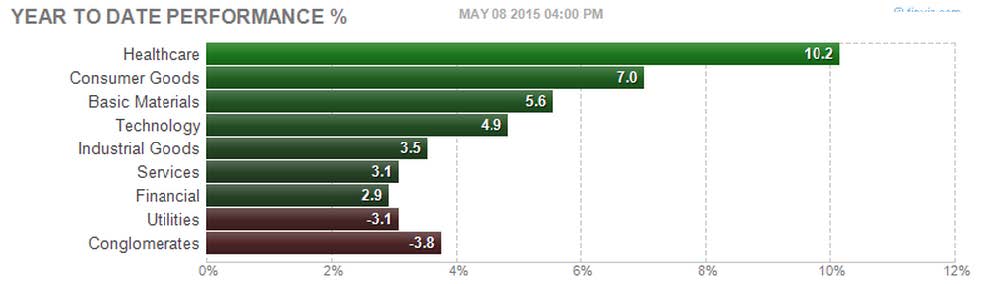
[su_heading style=”modern-1-dark” size=”18″]Strongest Sectors [/su_heading]
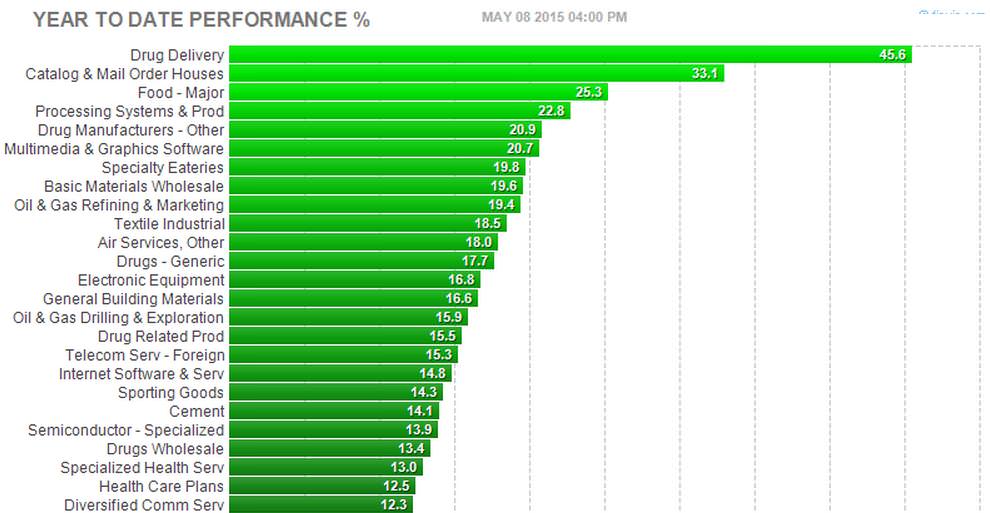
[su_heading style=”modern-1-dark” size=”18″]Strongest Groups [/su_heading]
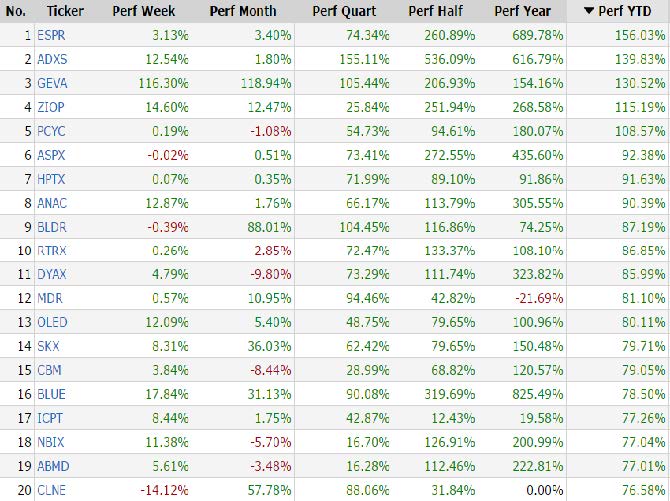
[su_heading style=”modern-1-dark” size=”18″]Strongest Performing Symbols This Year [/su_heading]
These are the top 20 strongest performing tickers on a year-to-date basis that are trading over $5, average daily volume over 500k and have a market cap >300M (Small cap-Mega Cap)
[/su_spoiler]


