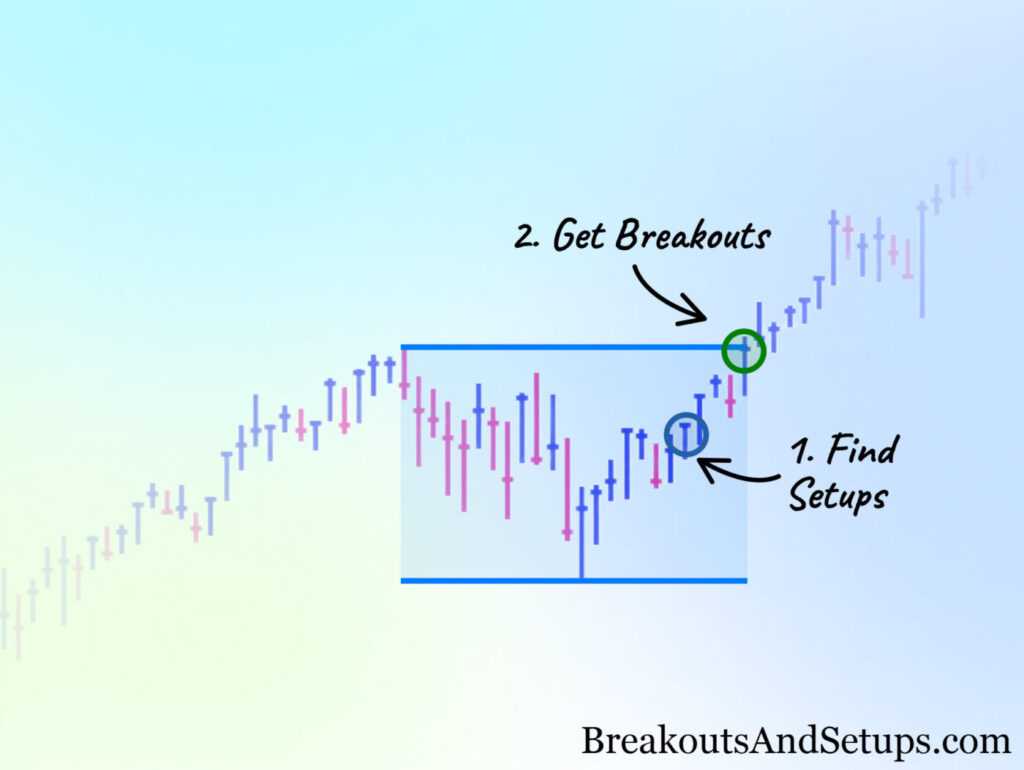
 Stocks with high “Relative Strength” means that these stocks are outperforming the market. They are beating major averages such as the S&P 500 and NASDAQ. When stocks are displaying relative strength consistently, take notice! You can then take advantage of these opportunities when they arise. That’s what the market is about – making ourselves available for the opportunities when they emerge.
Here is how to Identify Stocks with Relative Strength:
Find a Scanner that Works for You:
I scan for relative strength using the ChartYourTrade MRI scanner. ChartYourTrade MRI runs 8 scans with +65 high growth criteria and then filters by an “Ideal Growth Stock” screen. It creates a list of the next potential top-performing growth stocks with a single click. That is why I like using it. However, there are a broad range of scanners on the market. You need to find the right one that works for you.
 Price and Volume Matter in Your Scan Set-up
When I set-up my relative strength scan, one parameter that I include is that the stock is no more than 5% off its own 52 week high. I allow for a little bit of consolidation in that stock while also making sure that it is a market leader.
You want to set a 50-day 50 day average volume. I set it to be at least 200,000 or greater. I used to look at stocks 400,000 or greater. I lowered this to 200,000 cast a slightly wider net while also knowing that the “Ideal Growth Stock” screen mentioned earlier would filter out the trash.
In general, the higher the 50 day volume the stock has the better. If the average volume is fairly low, then one big player can come in and dramatically move the stock. You don’t want to wake up and see your stock down 30% out of nowhere because one major player changed their mind and wanted to exit. So in general, you want to go with a higher volume stock so no one individual player can make or break the market in that stock.
Identify Ideal Growth Stock Traits
When I run my scanner, I filter on Ideal Growth Stocks and there are multiple parameters, which are outlined in this blog post here (https://chartyourtrade.com/how-to-scan-for-the-best-growth-stocks/). The Ideal Growth Stock scan will show historically when major stocks made their greatest runs and you can filter on the best of the best growth stocks. Then you can narrow your search, analyzing those in your scan showing the same historic qualities as those growth stocks. When I run the relative strength scanner, I ensure that it has at least 50% of what an ideal growth stock has.
What Industry Groups are Leading the Market
See which industry groups the stocks passing your scans are coming from. If several stocks pass your scan from one industry group, then its an indication that something is brewing with that group. You will want to put those on a special watch list and pay close attention to them.
Be Mindful When Analyzing the Charts
When analyzing the charts for the stocks that passed your scan, be mindful of the following: Are Prices coming in? Where is it stopping and how is it playing around at that level? Is it reversing and is volume coming in? Is it closing at its high? Be sure to be mindful of these factors before choosing to buy.


