Sellers showed up yesterday (9/3/2024), and if we weren’t convinced the recent rally attempt had failed last week, we are today. The model portfolio stopped out of a few positions. Here’s a little mid-week update. (Charts courtesy of StockCharts.com).
Market Conditions – Red Light
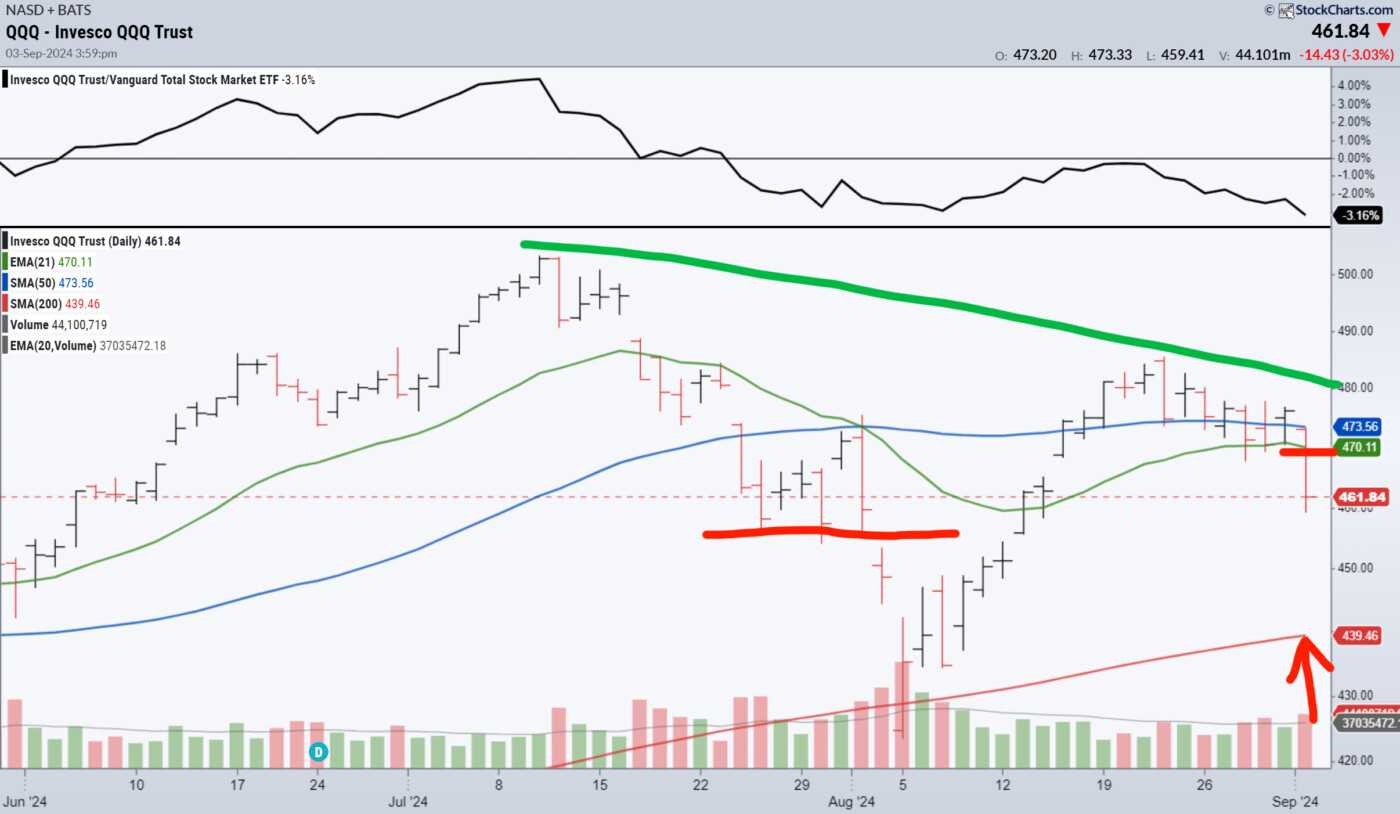
We’ve been following the $QQQ as the leading index. It led up, and now it seems to be leading us down. It fell through support at the 21-day moving average yesterday. We’ll be watching to see if it finds support at the July 25 low of about $455. If it breaks through that threshold, we anticipate another return to the 200-day moving average. That weakness infected other indices, including the $SPY and $IWM which closed below their 21-day moving averages. Even the $DIA fell, finding support at July’s highs. We’re putting a red light on trading for now. In the near term, we’d like to see the $QQQ above $480 before we get offensive again. We don’t have any Advanced Entry Points this week.
Psychological Analysis
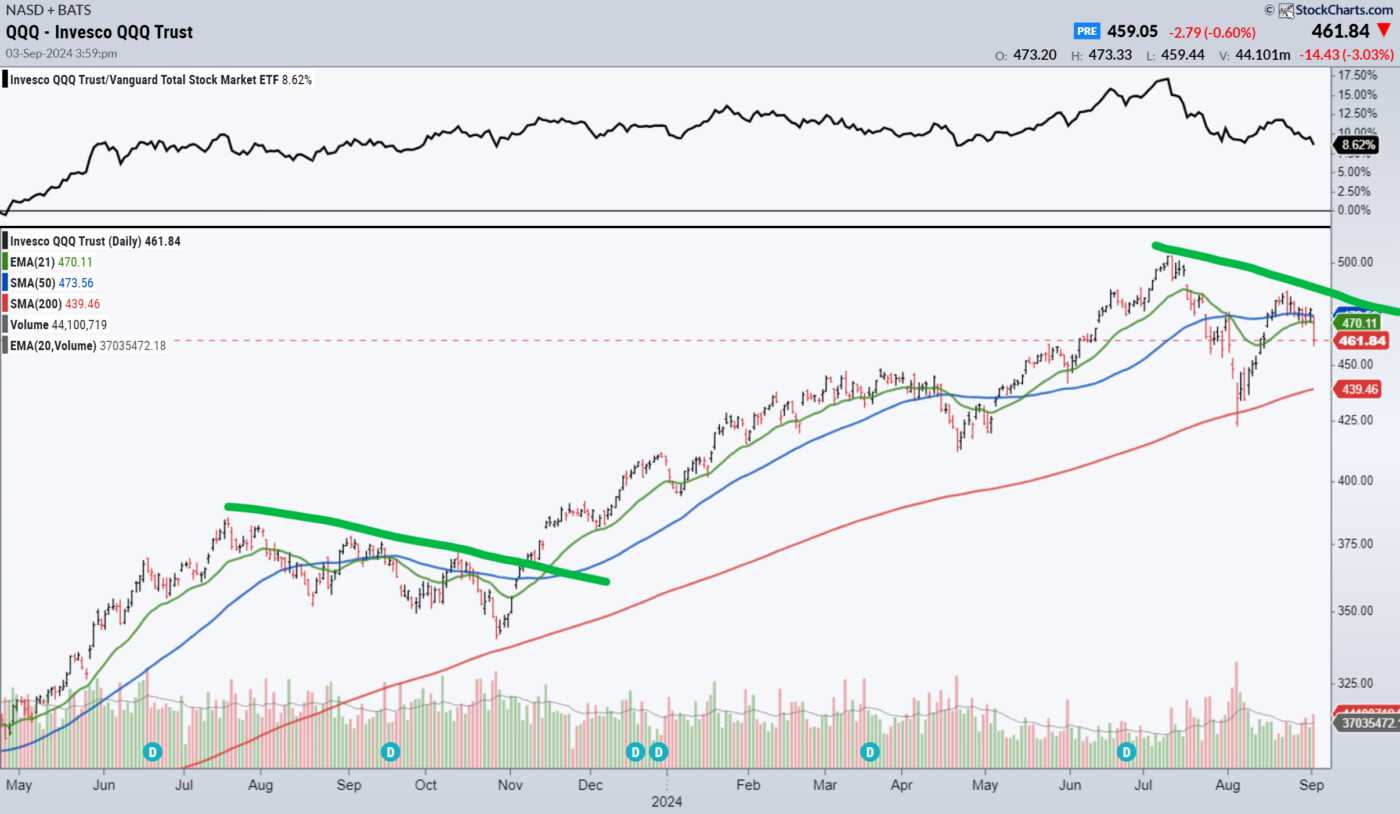
Last year, between July and October, the $QQQ (and the markets in general), took three legs down. Our psychological biases want us to believe that’s what is going to happen again. Of course, past results can’t predict future outcomes, so we’ll file that information under “interesting,” but we won’t let it dictate our thinking. We’re going to focus on what the markets are doing NOW.
Defense
We stopped out of three positions yesterday – one for a small loss, and two for gains so small we’ll call them break even. Our protective stops prevented us from suffering bigger losses. When stops are triggered, that’s evidence of the A.M.P.D. trading strategy doing its job. Here are the positions we stopped out of:
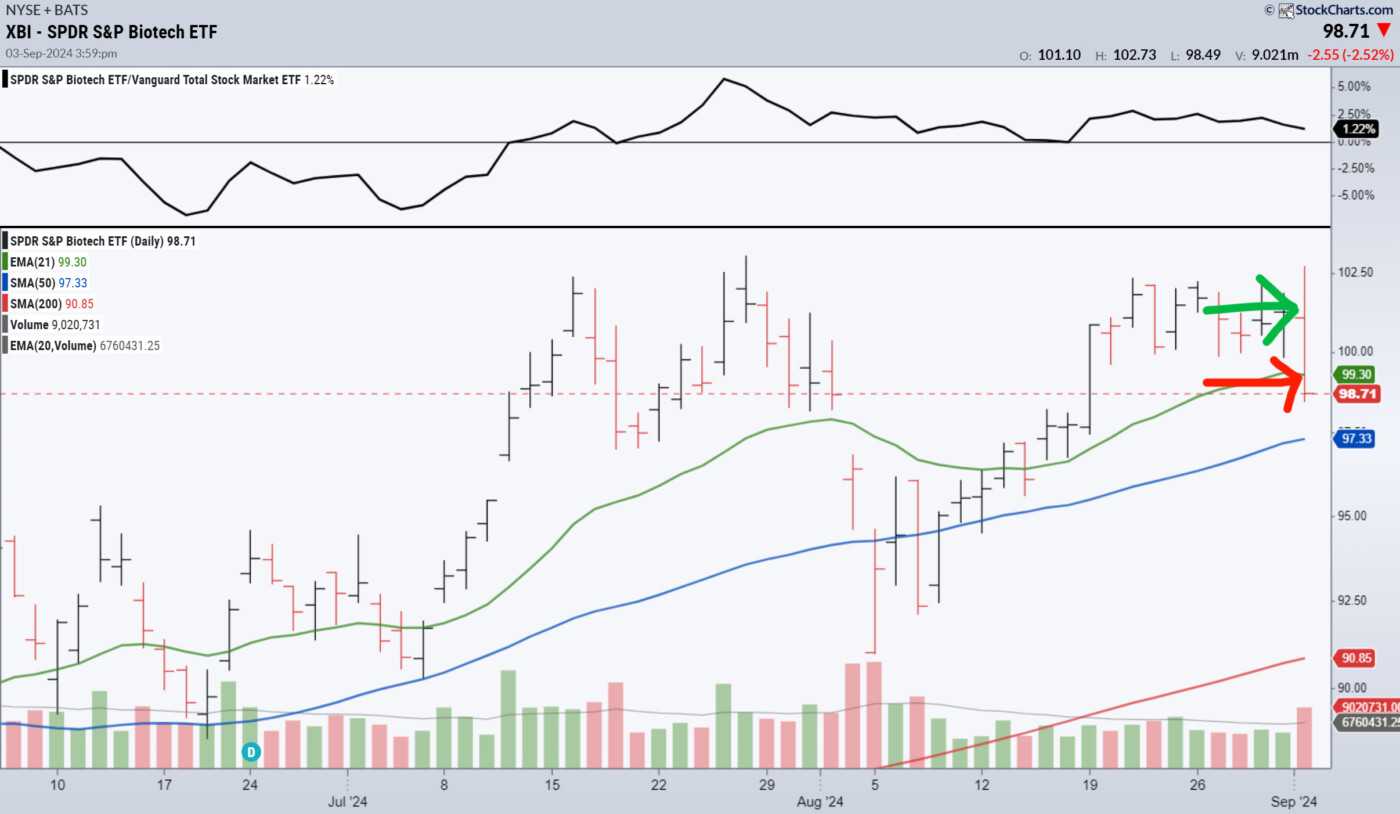
Spider S&P Biotech ETF ($XBI):
We took this position on 8/29/2024 primarily because we could put a very tight stop in below the flag pattern (and the 21-day moving average). We bought in at $101.74 per share; we stopped out at $99.00 per share for a 2.69% loss on the position, or $296.25.
Russell 2000 ETF ($IWM)
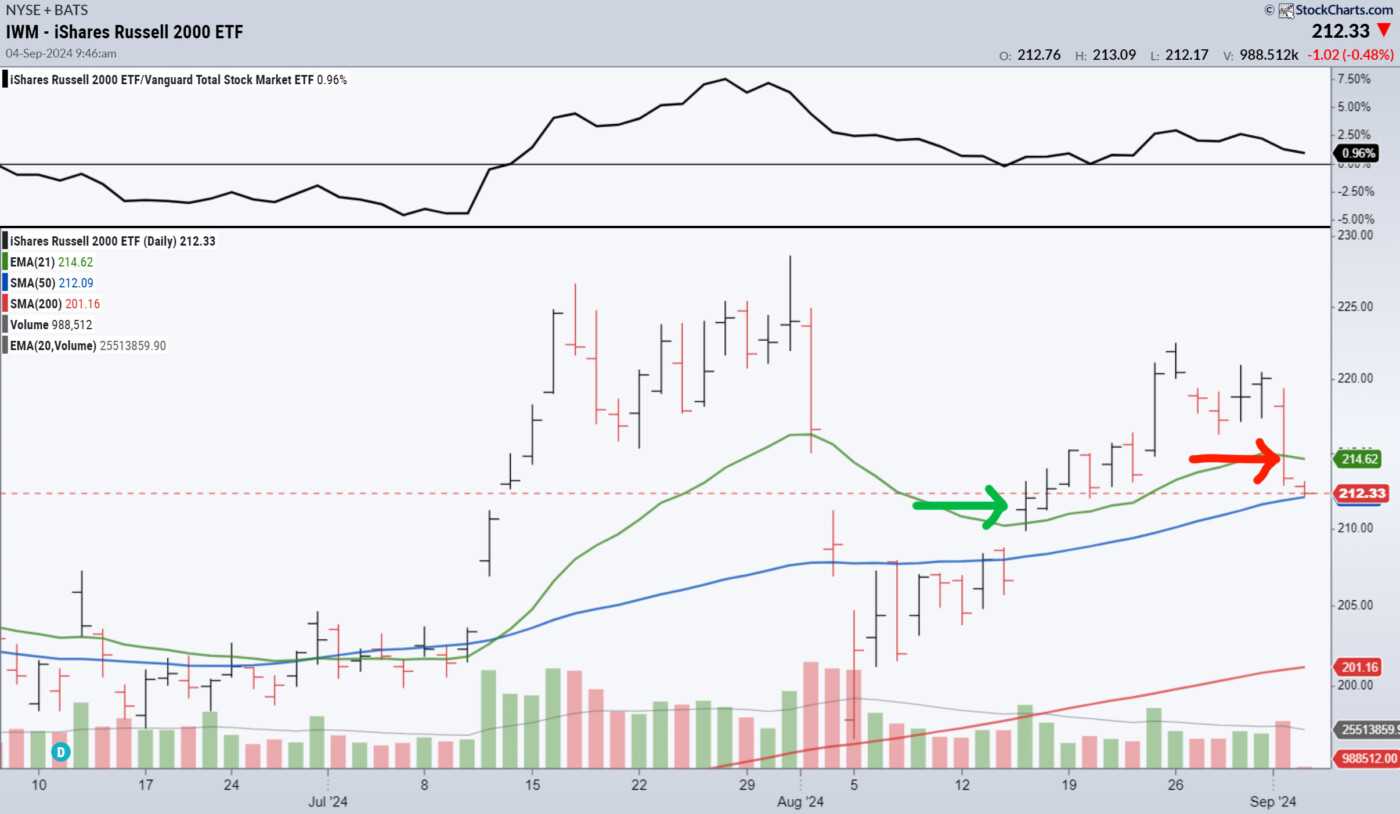
We took a bite at the $IWM at the beginning of the recent rally attempt when it broke out above the 21-day moving average on August 15, 2024 at $211.90 per share. We were able to bring our protective stop up to $214.00, and that triggered yesterday, taking us out for a small .99% gain ($118.92). We’ll call that a break-even.
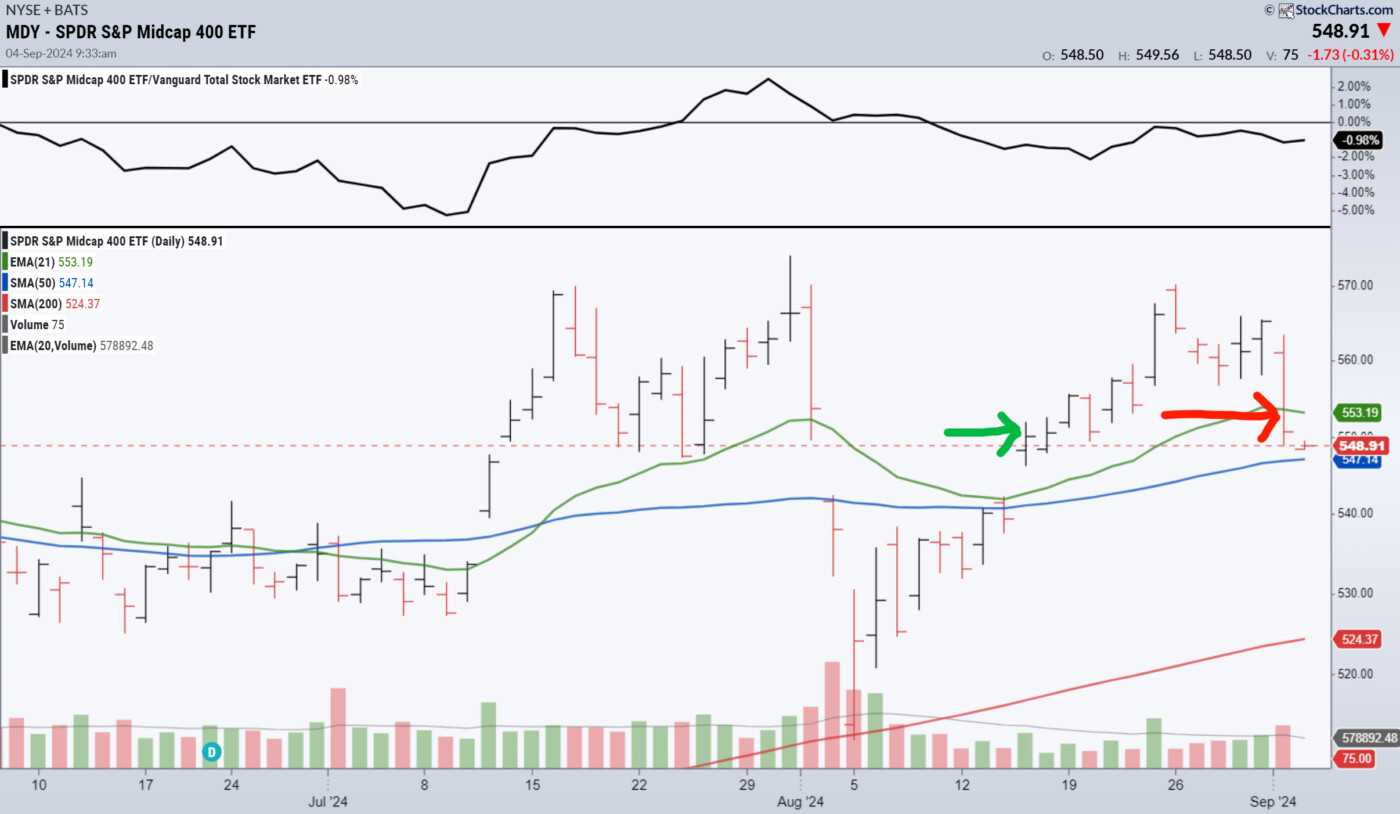
S&P Midcap 400 ETF ($MDY)
The $MDY broke out above the 21-day moving average the same day the $IWM took off. We took a position at $550.33 per share and stopped out yesterday at $552.50 for a very modest .39% profit ($47.32), which we’ll also call break-even.
As I write this, the market has opened, and we’re blowing through more stops. We’ll be back tomorrow with another update.


