
 Another Volatile Week On Wall Street:
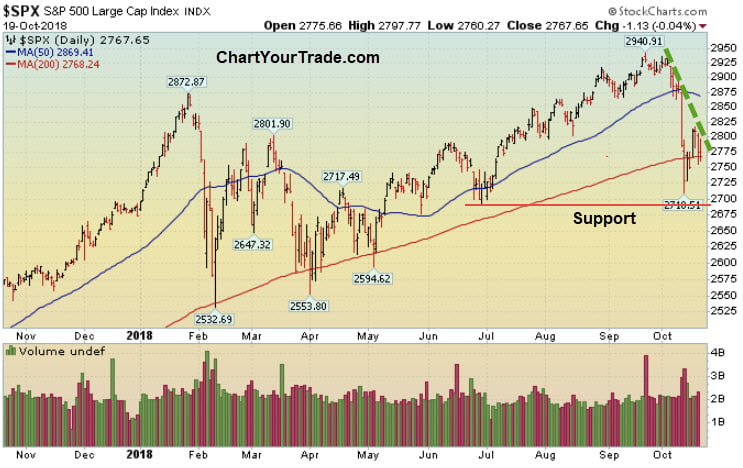
It was another volatile week on Wall Street as investors digested a slew of earnings and the latest round of economic data. The market was quiet on Monday, then rallied 500 points on Tuesday, fell 300 points at Wednesday’s open, rallied back to close down 91 points. Then, Thursday was a big down day and it jumped 200 points on Friday’s open before the Nasdaq fell into negative territory. Remember, in a normal healthy bull market (Feb 2016-Feb 2018 as the most recent example- or just about any other healthy run in the past) we do not typically see large bouts of volatility. Instead, large swings typically show up in sideways or down markets. It is important to note that it is not just this week where we have seen a jump in volatility, it’s been happening all year. Typically, that is not “healthy” action. It is also disconcerting to see the Russell 2000 give up most of its gains for the year. That doesn’t mean the market can’t rally from here, because it definitely can, it only means that until the major indices get back above resistance (their respective 50 DMA lines) – we have to expect more sloppy action to continue -for now. On the downside, major support is the 200 DMA line and then Feb’s low. Until either support or resistance are breached, by definition, we have to expect more sideways/sloppy action.
Monday-Wednesday Action:
Stocks ended mixed on Monday as investors digested the prior week’s shellacking. The small-cap Russell 2000 ended slightly higher while the Dow, Nasdaq, and S&P 500 fell. Separately, Sears filed for bankruptcy protection as the retailer continues to struggle to make any traction. In other news, Treasury Secretary Steven Mnuchin and Office of Management and Budget Director Mick Mulvaney said the U.S. budget deficit jumped by 17% as spending rose. The deficit climbed to $779 billion which is $113 billion higher than the previous year. On Tuesday, stocks soared after the latest round of earnings were released. Goldman Sachs and BlackRock were some of the large banks that helped the market rally on Tuesday. Technically, the bulls showed up and defended the longer term 200 DMA line which has served as important support for most of 2018. After the bell, Netflix reported earnings and gapped up as the number of subscribers soared. On Wednesday, the Dow fell 300 points at the open ahead of the Fed minutes. Buyers showed up shortly after the open and erased most of the day’s decline. Then, at 2pm EST, the Fed released the minutes of its latest meeting and basically said it will continue raising rates for the foreseeable future. Stocks ended the day lower.
Thursday & Friday Action:
Stocks fell hard on Thursday as sellers showed up and erased most of Wednesday’s big gain. The inability for the market to bounce – even from these deeply oversold levels tells you how weak the market is right now. Strength is being sold and that is not a good sign. Stocks ended mixed on Friday after China said it’s economy grew by 6.5%, missing estimates for a 6.6% gain. The Shanghai Composite which is technically in a bear market- because it fell over 30% since January. The Shanghai Composite rallied nearly 3% on Friday because weaker than expected GDP number means more stimulus will likely come from Beijing.
Market Outlook: Pullback Time
At the end of September, I noted that the Russell 2000 broke below important support and said it should be watched closely. One week later, we saw a big sell-off on Wall Street as rates spiked. The next big level of support is the 200 DMA line and then February’s low. The Dow and Nasdaq are trading near their 200 DMA lines. The bulls want to see that level hold. After that the big level to watch is Feb’s low. As always, keep your losses small and never argue with the tape.


