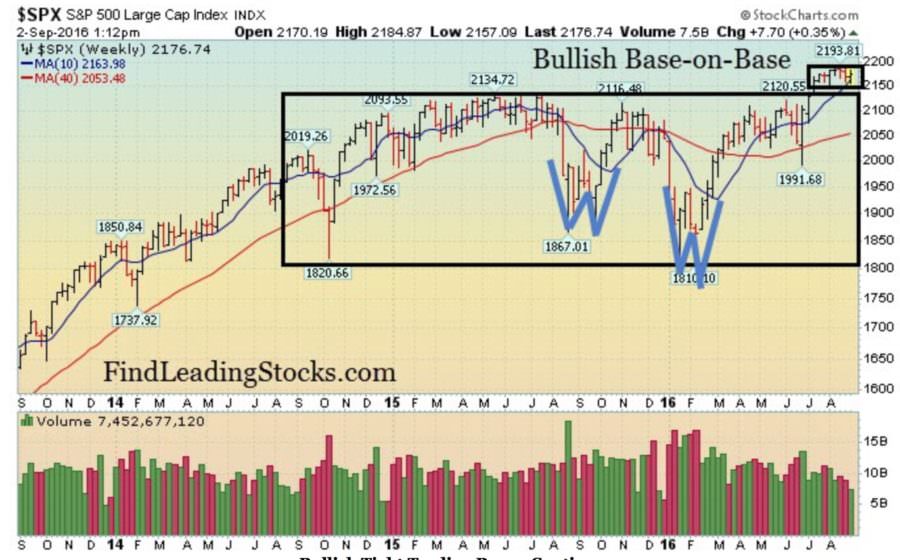
Bullish Tight Trading Range Continues
The tight trading range we have seen over the past 7 weeks continues as the market pauses to digest the very strong ~10% post-brexit rally. All that has happened over the past 7 weeks is that the moving averages are playing catch up to the strong rally. So far, the action is healthy as the market refuses to sell off in a meaningful fashion. Last week, we saw the bulls show up and defend the 50 day moving average line for the Dow Jones Industrial Average. Looking forward, the bulls remain in control until support is breached (50 day moving average lines and then the former chart highs: Dow 18,351 and S&P 500 2,134).
Until support breaks, the short, intermediate and long term trend remains up for Wall Street. Remember, there are two ways a market can pullback after a big rally: move lower or move sideways. Right now, the latter is occurring and that is the more bullish scenario. As we have said for the past few weeks, the key now is to analyze the health of this consolidation to see if this is an orderly/healthy consolidation or something more severe. So far, the action is healthy except for a little selling in two areas: gold/silver stocks and healthcare/biotech stocks. Since Brexit, market pullbacks have only lasted a few days, which illustrates a strong underlying bid beneath the market.
A closer look at the week that was…
Mon-Wed Action:
Stocks rallied on Monday as investors digested the latest round of economic data and last week’s Fed symposium in Jackson Hole. Consumer spending edged higher by +0.3% in July which matched the Street’s consensus. Meanwhile, the personal consumption expenditures (PCE) price index, which is one of the Fed’s preferred inflation indicators, rose 0.1% in July and is up 1.6% over the 12 months through July. That is still shy of the Fed’s 2% forecast. Elsewhere, the Dallas Fed Manufacturing General Activity Index fell to -6.2, lower than the last reading of -1.3.
Stocks fell on Tuesday as investors digested the latest round of economic data. The S&P Case-Shiller Index slid -0.1% on a monthly basis and missed estimates for a gain of +0.1%. Overall, the index rose by 5.1% vs the same period last year. Elsewhere, consumer confidence rose to 101.1, beating estimates for 97.3. Shares of Hershey (HSY) plunged after the company rejected the latest buyout offer. Finally, shares of Apple (AAPL) fell after the EU said it wants to fine them $14.5B.
Stocks fell after most of Wednesday’s economic data strengthened the argument for another rate hike. ADP, the country’s largest private payrolls report, said private U.S. employers added 177k new jobs, beating estimates for 175k in July. Weekly mortgage applications rose by +2.8%, which was higher than last week’s reading of -2.1%. Elsewhere, pending home sales jumped +1.3%, beating estimates for +0.6%. Not all the data beat estimates, the Chicago PMI came in at 51.5, missing estimates for 55.2. In other news, crude oil sliced below its 50 DMA line after the EIA report showed inventories rose.
Thur & Fri Action:
Stocks were relatively quiet on Thursday as investors waited for Friday’s fake jobs report to be released. Before Thursday’s open, stock futures were slightly higher after several international factory orders jumped, mainly in China, UK, and other parts of Europe. China’s factory activity jumped to the fastest pace in nearly two years and U.K.’s factory activity also rose, offsetting concerns about Brexit. Stocks fell shortly after the open, because two separate U.S. factory reports missed estimates. The ISM purchasing managers index came in at 49.4, missing estimates for 52.2. It was also below the boom/bust level of 50, signaling a contraction.
Separately, the PMI manufacturing index came in at 52.0, missing estimates for 52.9. The weaker-than-expected manufacturing data lowered the chance the Fed would raise rates in September. Technically, the bulls showed up on Thursday and defended the 50 DMA line for the Dow Jones Industrial Average. Elsewhere, oil prices plunged again and oil has now fallen over 12% in the past week. Before Friday’s open, the government said U.S. employers added 151k new jobs in August, missing estimates for 175-188k.
Market Outlook: Stocks Are Strong
Stocks are strong. The market finally broke out of its very long trading range after Brexit and ahead of earnings season. The fundamental driver continues to be easy money from global central banks. Economic and earnings data remain mixed at best which means easy money is here to stay. As always, keep your losses small and never argue with the tape.


