Split Tape Returns As Bulls Defend Support
The market, once again, is very split. Gold and a few other commodity stocks (Steel, Energy, etc) are acting very well while many other areas of the market are rolling over or remain very weak (Semiconductors $SMH, Retail XRT, Biotechs IBB, etc).
We have now entered the beloved “Sell In May and Go Away” period for the market. History shows us that the best returns on Wall Street occur during November-April and the worst returns occur during May-October. Of course, this time may be different but if it is not, we have to keep that in mind as we make our way through the next several months.
Stocks fell last week after the latest round of tepid economic and earnings data was announced. The big headline was a disappointing jobs report. The government said U.S. employers added 160k new jobs last month, missing estimates for 202k. Remember, GDP also missed estimates growing only +0.5% in Q1. Clearly, the economy is not doing well – even with rates at 0.25%! Additionally, corporate earnings are lousy which also supports the economy is getting weaker thesis. Fundamentally, the “narrative” has changed and we expect the Fed to get a lot more dovish in the months ahead. For now, that is a huge (bullish) wildcard that may come into play, especially if the market gets weaker from here.
We are told the Fed is apolitical but Trump wants to fire Yellen and it is clear that a lot of the Fed officials (we are told Yellen as well) support Hillary so we wouldn’t be surprised if we get more easy money as we approach the election in November.
Intermediate and long term there are one of two possible scenarios that may unfold: A. The major indices are building a long 1 year base and a breakout above resistance (2134 in the S&P 500). If that occurs, that will likely be bullish and trigger a new leg higher. B. This is one big top after a 7 year bull market and support breaks (1810-1820 in the S&P 500) and we enter a new bear market. We still think the latter will unfold but are aware of the central bank put (idea that central banks will step in and help the market). In February, we were headed for the latter scenario but global central banks, once again, interfered and saved the day. Most likely, if the former scenario unfolds, the breakout will be caused by easier monetary and/or fiscal policy. Until then, we have to expect this wide and loose very choppy action to continue and we will maintain a relatively cautious stance.
Monday-Wednesday’s Action:
[su_rectangle_ad_left]Stocks rallied on Monday as investors digested the latest round of tepid economic and earnings data. Over the weekend, China’s official manufacturing PMI came in a t 50.1 last month, down from 50.2 in March. The services component came in at 53.5, compared with 53.8 in March. In the U.S., the PMI manufacturing index came in at 50.8, missing estimates for 51.0. The ISM manufacturing index, also missed estimates, and came in at 50.8, compared to the Street’s estimate for 51.5. Finally, construction spending came in at 0.3%, missing the Street’s estimate for 1.0%. Earnings data failed to impress. In currency news, the US Dollar broke below major support and hit a new multi month low. Separately, the euro broke out of year long base and is trying to bottom.
Stocks fell on Tuesday after more concerns emerged regarding the global economy. Overnight, China’s Caixin manufacturing PMI remained in contraction territory for a 14th-straight month. The index fell to 49.4 in April which is below the boom/bust level of 50 and below March’s reading of 49.7. In other news, more easy money came from Australia’s Central Bank, (The Reserve Bank of Australia or RBA). The RBA unexpectedly cut the benchmark cash rate by 25 basis points to 1.75%. European banks were under pressure after UBS Group AG ($UBS) reported a 64% decline in Q1 earnings. Stocks in the U.S. fell as earnings roulette continues. Stocks opened lower on Wednesday but turned higher as investors digested a slew of economic and earnings data.
Before Wednesday’s open, ADP said private employers added 156k new jobs in April, missing estimates for 193k. Additionally, that was the weakest print since 142k in Feb 2014. After the open, the PMI services index came in at 52.8, just higher than the Street’s estimate for 52.The ISM Non-Manufacturing PMI for April came in at 55.70 vs 54.70 Est. The prior reading was 54.50. Separately, Factor Orders grew by 1.1%, beating estimates for a gain of 0.6%. Earnings roulette continued after Priceline (PCLN) gapped down over $100 after reporting numbers while shares of Zillow (Z) and Nutrisystem (NTRI) gapped up after reporting earnings.
Thursday & Friday’s Action:
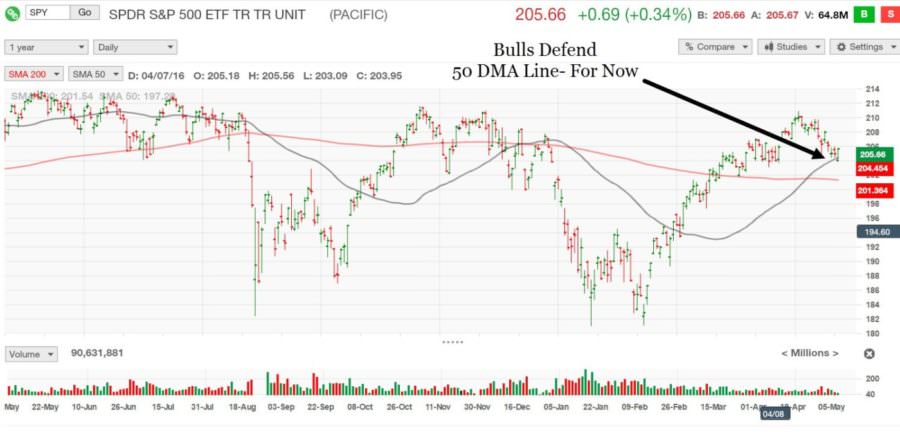
Before Thursday’s open, futures were higher after oil prices spiked nearly 5%. The Dow Jones Industrial Average and S&P 500 pulled right into their respective 50 DMA lines and were due to bounce. Instead of bouncing, sellers showed up and the market spent most of the day in the red. Additionally, several key areas of the market are under pressure and not acting well. On Friday, stocks opened lower but closed higher after the bulls showed up and defended the 50 DMA line.
Market Outlook: Testing Support
The Dow and S&P 500 are flirting with support (50 DMA lines). Economic and earnings data remains less than stellar but all that matters now- is the easy money from global central banks. As always, keep your losses small and never argue with the tape.
Need help with the market? Sign up for Advanced Reports.
 Adam Sarhan is a 20+ year market veteran, a Forbes contributor, and is regularly quoted in financial media. Adam is the Founder & CEO of Sarhan Capital and Sophic Associates, LLC.
Advanced Reports Members Receive:
- Model Portfolio w/ exact entry and exit points
- Conviction Leaders List
- Personalized Assistance when you need it
- Weekly Stock Report
- Intra-Week Updates
- + more


