[su_spoiler title=”Monday & Tuesday’s Action: Earnings Fail To Impress” style=”fancy”]
Stocks ended mixed on Monday as earnings season began and Apple Inc ($AAPL) began taking preorders for their highly anticipated iWatch. The initial data from the company showed demand remained very strong as sales topped 1 million units. In other news, shares of Netflix ($NFLX) jumped over +3.4% after Citigroup ($C) raised the stock to Buy from Hold and said the recent drop in the stock price to low $400’s offered investors a chance to “buy the dip.” The company also is believed to be in the early stages of exploring a stock split to lower their price and increase the shares outstanding. Social media giant, LinkedIn ($LNKD) jumped 3.6% after analysts praised their acquisition of Lynda.com. Overseas, Chinese stocks soared after the Hong Kong Monetary Authority intervened in foreign exchange markets to prevent its currency from rising. China said its CPI rose in March and beat estimates. It was another quiet day on Tuesday as investors digested the latest round of economic and earnings data. Retail sales grew by +0.9% in March which was the first increase since November. Even with the small gain, retail sales still missed the +1.1% consensus which is the latest in a series of weaker-than-expected economic data. A separate report showed that the Producer Price Index matched estimates. JPMorgan Chase ($JPM) and Wells Fargo ($WFC) reported Q1 results, JPM broke out to a new high while WFC fell. In other news, shares of 58.com ($WUBA) surged a whopping +33% after news spread that the company agreed to merge with competitor, Ganji.com. The combined company will be worth an estimated $10 billion. Avon Products ($AVP) surged 14.2% after the Wall Street Journal said the company is exploring strategic alternatives. Stocks rallied on Wednesday after Crude Oil broke out of a bullish double bottom pattern and the European Central Bank (ECB) stayed the course with their massive QE program. Economic data was mixed. The Empire Manufacturing survey unexpectedly fell in April and missed estimates. The index fell -1.19 in April versus March’s 6.90 total. Elsewhere, the National Association of Home Builders housing market index jumped sharply to 56 in April. The Fed released its Beige Book for April which was not exciting. After Wednesday’s close, Standard & Poor’s cut Greece’s credit rating to “CCC+” from “B-” with a negative outlook.[/su_spoiler]
[su_spoiler title=”Wednesday & Thursday’s Action: Stocks Hit Hard on Friday” style=”fancy”]
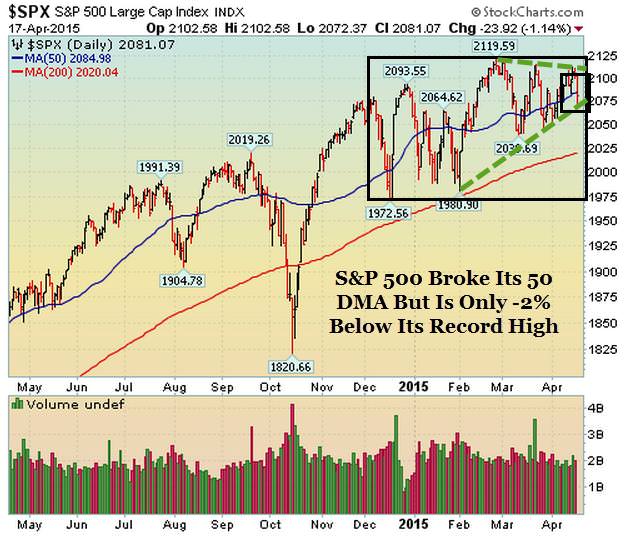
Stocks opened lower on Thursday even after a slew of high profile companies released their Q1 results. So far it’s been a mixed bag with the standout leader is Netflix ($NFLX) enjoying a huge break-away gap after reporting their Q1 results. The three big IPO’s this week were: Party City ($PRTY), high frequency trading firm, Virtu Financial ($VIRT) and ETSY inc, ($ETSY), an online marketplace to buy and sell handmade goods. Economic data remains weak at best. Housing starts grew by 926k in March, missing estimates but above Feb’s reading of 908k. Elsewhere, weekly initial jobless claims came in at 294k, beating estimates and hitting the lowest level since 2,000. The Philadelphia Fed index for April rose to +7.5 which also beat estimates. Before Friday’s open, overseas markets were hit hard after China tightened their margin requirements and allowed investors to sell stocks short. The selling spilled over to our markets and a slew of high ranked stocks broke support in heavy volume. The Shanghai stock market doubled in the last 10 months and this exceptionally strong rally is now known as the Beijing Put – (meaning China’s government is believed to be the main force behind the very strong rally in their stocks). Friday’s large sell off may be the beginning of continued selling because the market is way overdue for a nice pullback.[/su_spoiler]
[su_spoiler title=”Market Outlook: The Central Bank Put Is Alive And Well” style=”fancy”]
Remember, in bull markets surprises happen to the upside. This has been our primary thesis since the end of 2012. We would be remiss not to note that this very strong bull market is aging (celebrated its 6th anniversary in March 2015) and the last two major bull markets ended shortly after their 5th anniversary; 1994-2000 & 2002-Oct 2007). To be clear, the central bank put is very strong and until material damage occurs, the stock market deserves the longer-term bullish benefit of the doubt. As always, keep your losses small and never argue with the tape.
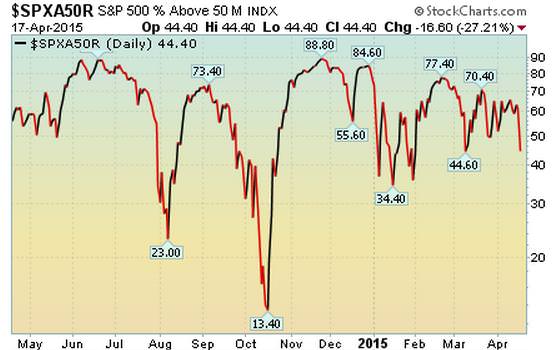
44.4% Of Stocks in the S&P 500 Are Above Their Respective 50 DMA (Market Tends To Turn When This Reading Gets Above 70% or Below 40%) Observation: Readings above 70% usually (not always) correspond with a short term pullback Conversely, reads below 40% usually (not always) correspond with a short term bounce
[/su_spoiler]
[su_spoiler title=”Big Stock List” style=”fancy”]
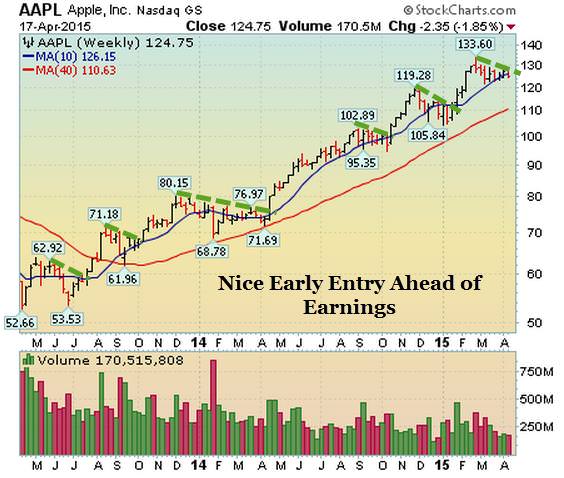
- AAPL – Broke below its 50 DMA line ahead of earnings 4/27/15 after close
- EA – Broke below its 50 DMA line ahead of earnings 5/5/15 after close
- FB – Fell last week and closed near its 50 DMA line ahead of earnings 4/22 after close
- FLT – Fell last week after flirting with its record high near $160. Earnings 4/30 after close
- GOOGL – Experienced a large negative and outside reversal to the downside ahead of earnings on 4/23/15 after the close
- ILMN – Rallied into its 50 DMA line last week. A lot of “down” weekly bars which is not ideal. Earnings 4/21/15 after close
- LNKD – Big downside reversal last week as it closed below its 50 DMA. Earnings 4/30/15 after close
- SBUX – Fell last week but closed above 50 DMA line. Earnings 4/23/15 after close
- TSLA – Closed lower last week but above its 50 DMA line. Earnings on 5.13.15 after close
- UA – Remains very strong as UA continues to hit new highs. Earnings 4/21/15 before open
- V – Fell last week after hitting resistance near 50 DMA line. earnings 4/30/15 after close
[/su_spoiler]
[su_spoiler title=”19 New Setups” style=”fancy”]
These hand-picked stocks are carefully selected to help with your idea generation and offer you additional setups each week. The setups are based on our proprietary criteria and offer advanced (dotted line) & classic long and short entry points (solid line). Short patterns are typically mirror images of long patterns. Note: Please Verify All Earnings Dates/Data From Multiple Sources For Every Stock in all our report(s). Charts Courtesy of Stockcharts.com
AAPL Working Order & Setup: New Early Entry Forming Ahead of Earnings
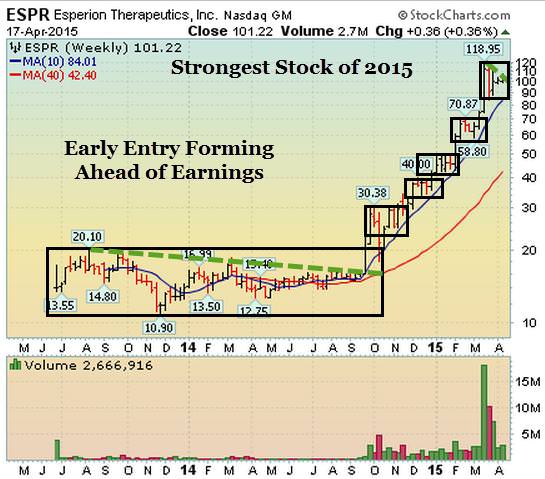
ESPR Setup: New Early Entry Forming Ahead of Earnings
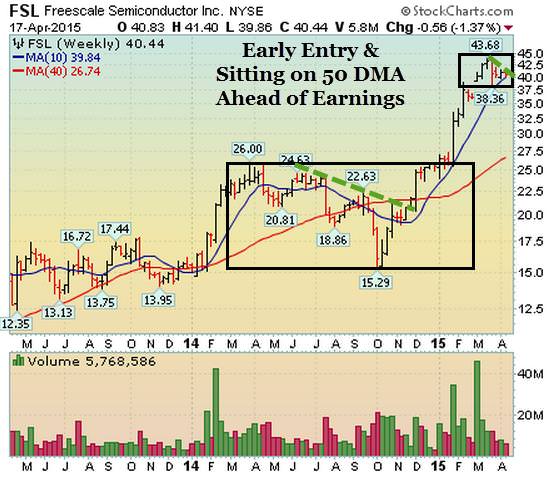
FSL Setup: Early Entry & Sitting on 50 DMA Ahead of Earnings
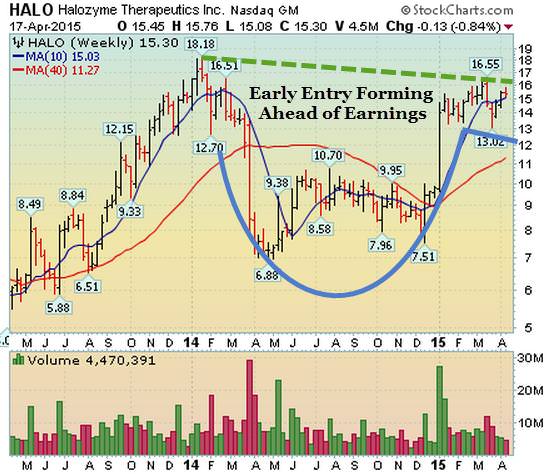
HALO Setup: Nice Early Entry Forming In Very Large Cup-with-Handle Base Ahead of Earnings
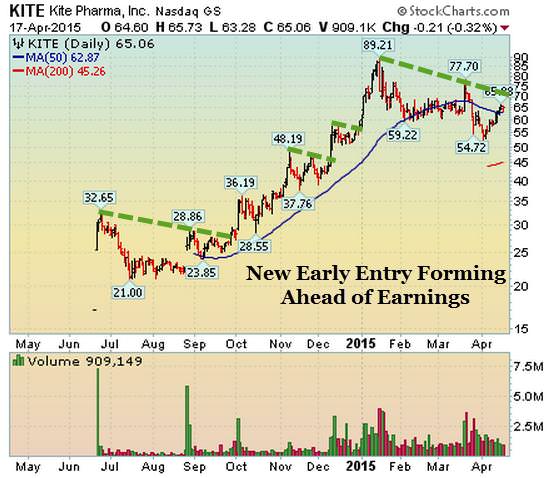
KITE Setup – New Early Entry Forming Ahead of Earnings
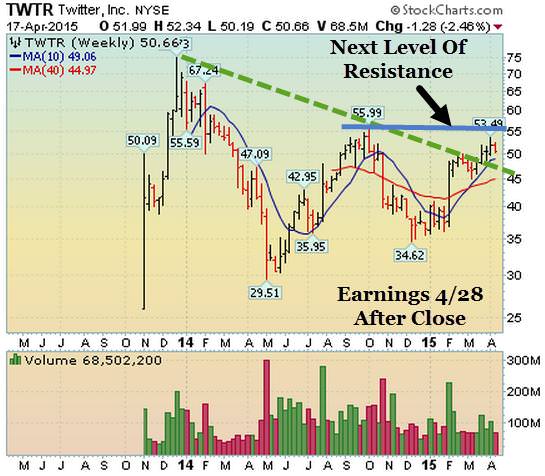
TWTR Setup – Early Entry Ahead of Earnings
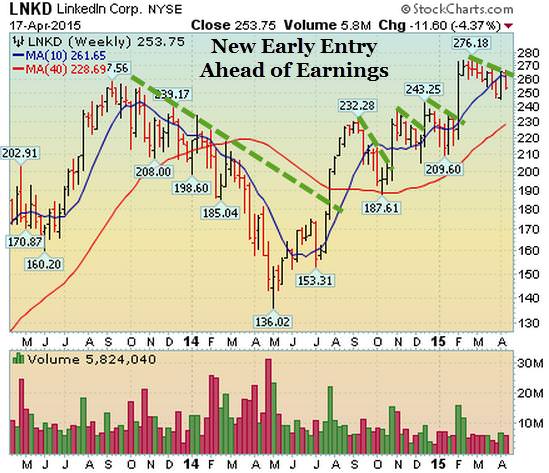
LNKD Setup – New Early Entry Forming Ahead of Earnings
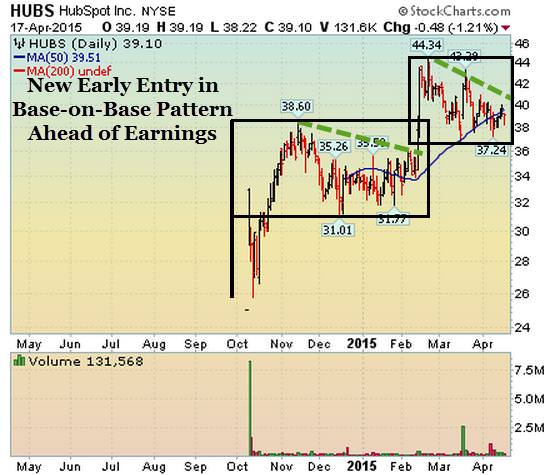
HUBS Setup: Early Entry Forming In Bullish Base-on-Base Pattern
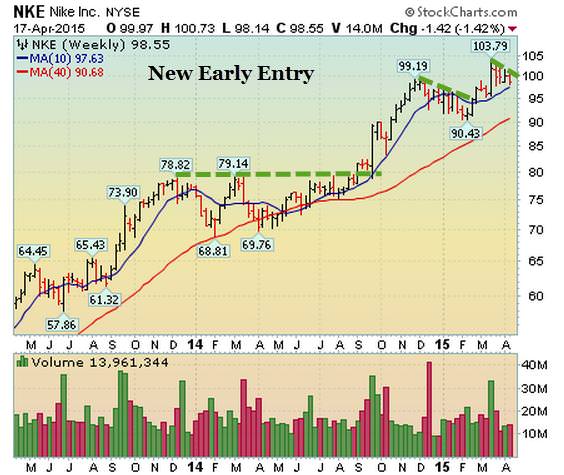
NKE: New Early Entry Forming
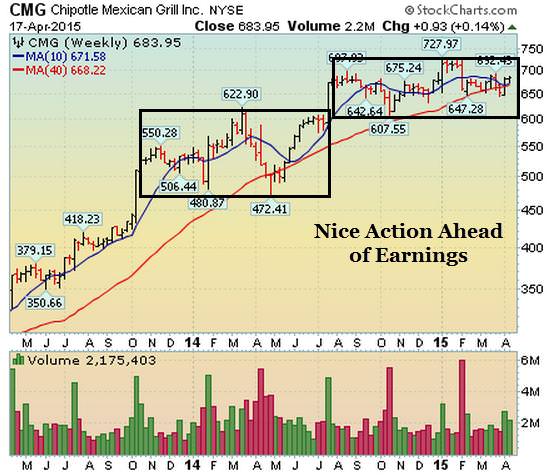
CMG Setup: Very Nice Setup Ahead of Earnings
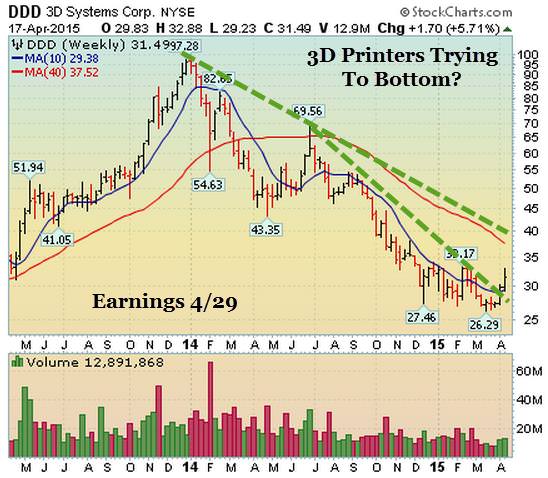
DDD Setup – 3D Printers Trying To Bottom?
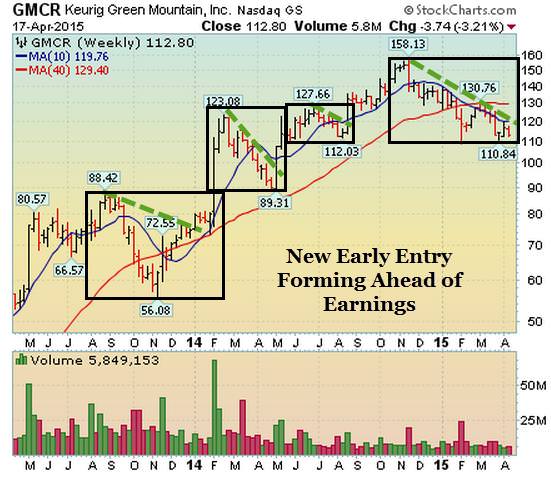
GMCR Setup: New Early Entry Forming Ahead of Earnings
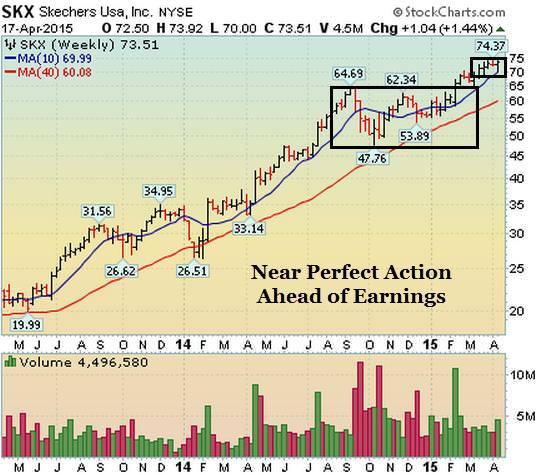
SKX Setup: Near Perfect Action Ahead of Earnings
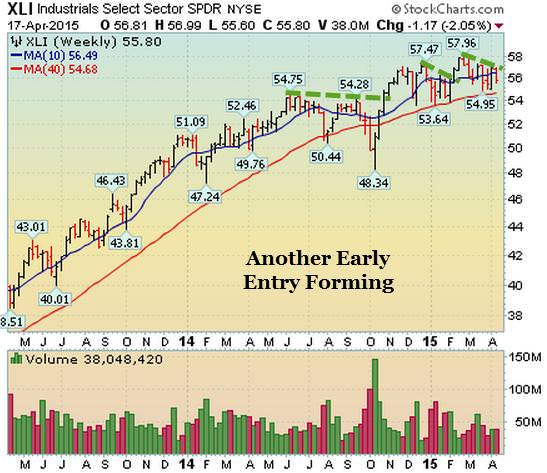
XLI Setup: Another Early Entry Forming
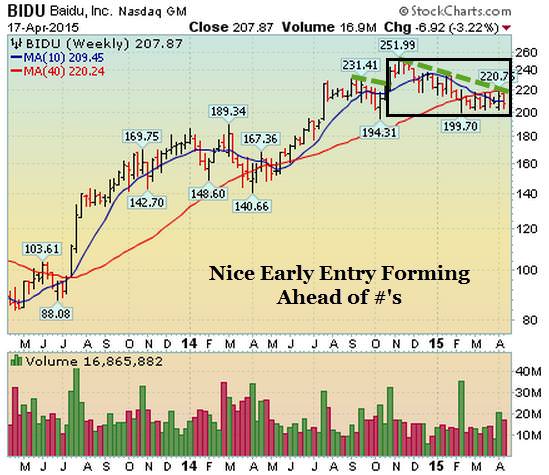
BIDU Setup: Early Entry In Flat Base
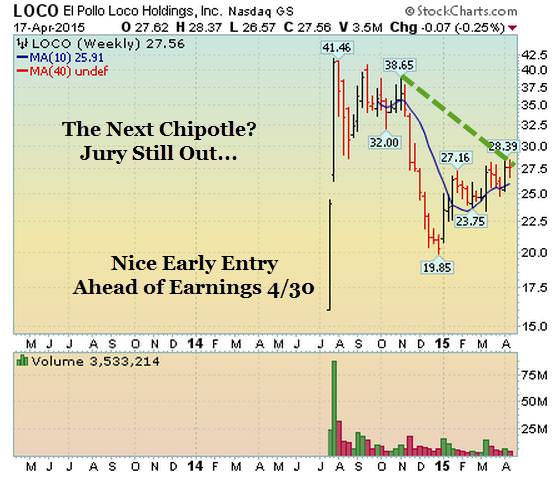
LOCO: Early Entry Forming
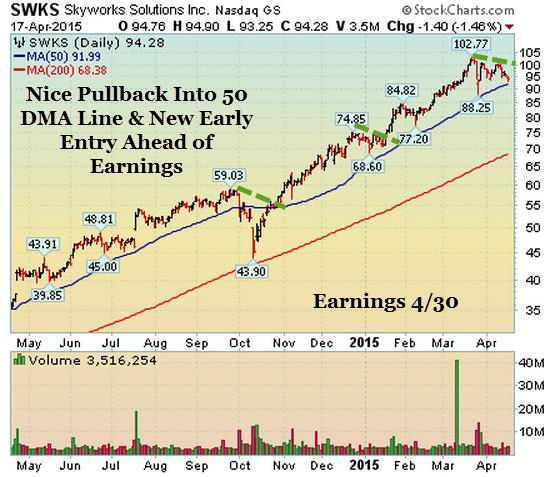
SWKS: Advanced Entry Forming
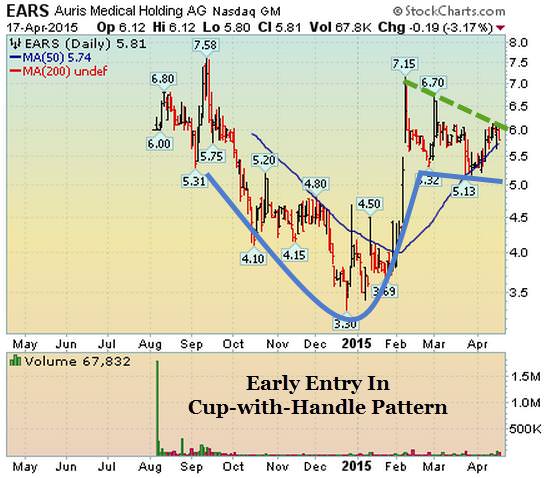
EARS: Perched Below Resistance
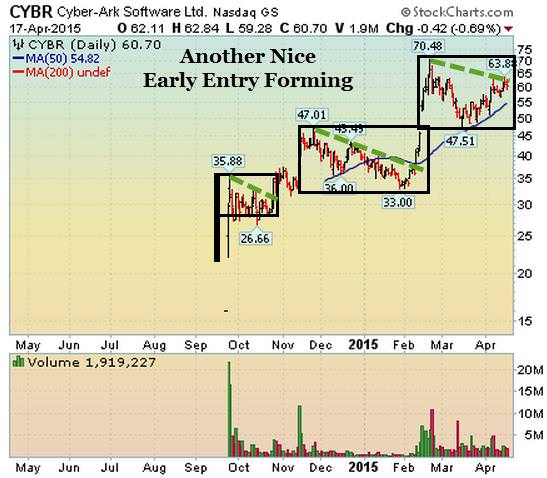
CYBR: Early Entry In Flat Base
[/su_spoiler]
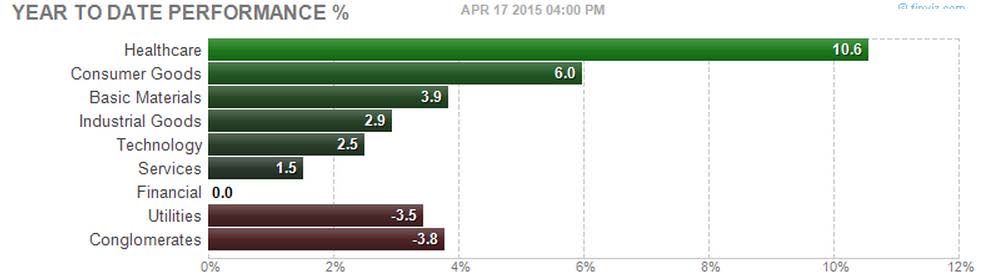
[su_heading style=”modern-1-dark” size=”18″]Strongest Sectors [/su_heading]
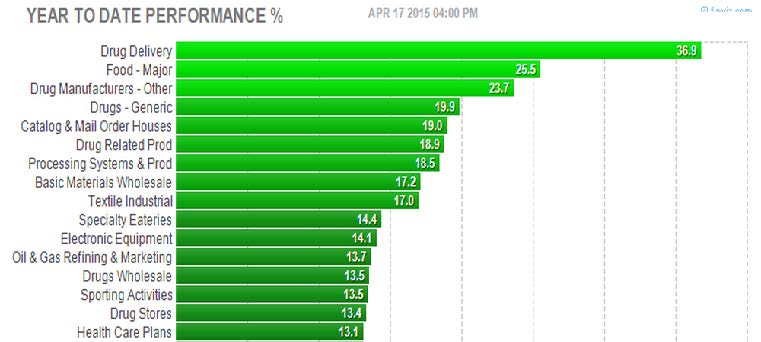
[su_heading style=”modern-1-dark” size=”18″]Strongest Groups [/su_heading]
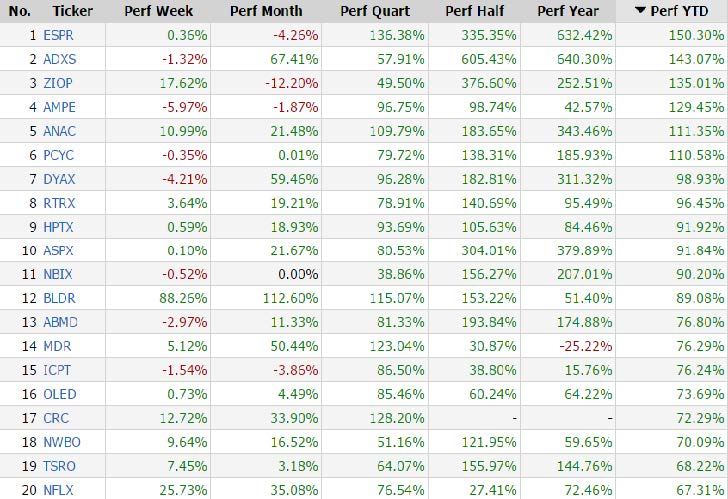
[su_heading style=”modern-1-dark” size=”18″]Strongest Performing Names This Year[/su_heading]
These are the top 20 strongest performing tickers on a year-to-date basis that are trading over $5, average daily volume over 500k and have a market cap >300M (Small cap-Mega Cap)