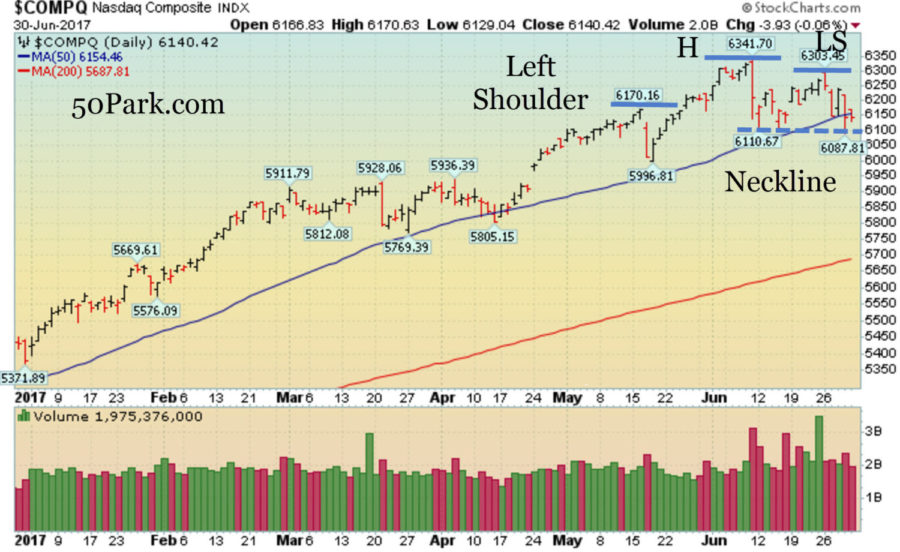
The complexion of the market changed considerably in June as fatigue finally set in after a very strong rally. June was littered with a spate of heavy volume down days, especially in tech stocks, which is not ideal for this aging bull market. The biggest negative divergence occurred in the Nasdaq and the Nasdaq 100, when they both traced out a large negative reversal on a monthly basis. They both closed below their respective 50 DMA lines on Friday which is not ideal. Additionally, they both snapped a very strong win streak and the Nasdaq tracing out a large head and shoulders top pattern. In fact, over the past 12 months, the Nasdaq only had two down months (Oct 2016 and June 2017).
Normally, a down month is not a big deal. However, when it is a big negative reversal on a monthly basis, occurs after a big move, happens on heavy volume, and a slew of leading stocks are smacked, then something else is at play. The market went from being exceptionally strong to showing signs of near-term fatigue in June.
 As of Friday’s close, the so-called FAANG stocks are not acting well. Only Facebook closed above its 50 DMA line while Amazon, Apple, Netflix and Google (Alphabet) are all below their respective 50 DMA lines. Remember, the 50 DMA line is a normal area of support, so a close below that level is not ideal.
The bulls argue that this is another normal and healthy pullback because even with all the technical damage occurring, the major averages are still only a few (<4%) percentage points below their record highs. From where I sit, if the bulls show up and send the market higher from here- then we will have another very nice buying opportunity and there are a ton of early entry points forming in leading stocks. Conversely, if the selling gets worse, and all the major indices close below their respective 50 DMA lines, then a much more defensive stance will be warranted.
A Closer Look at What Happened Last Week…
Mon-Wed Action:
Stocks opened higher but closed in the lower half of the range on Monday on the last full trading week of the month and quarter. Durable goods orders fell -1.1%, missing estimates for negative -0.4%. The Chicago Fed National Activity Index fell -0.26, missing estimates for a small gain of 0.32. The Dallas Fed Mfg Survey came in at 12.3, lower than the last reading of 23.3.
On Tuesday, stocks fell hard after the Senate delayed the healthcare vote and sellers showed up and sent a slew of tech stocks lower in heavy volume. Once again, economic data was mixed. The S&P Corelogic Case-Shiller HPI came in at +0.3%, missing estimates for +0.6%. Separately, consumer confidence came in at 118.9, slightly higher than the Street’s forecast of 116.7. Finally, the Richmond Fed Manufacturing Index came in at 7, missing the consensus reading of 8. Mixed to less-than-thrilling economic data aside, the heavy volume sell-off in tech stocks was definitely not a healthy sign.

Stocks bounced back hard on Wednesday after bank stocks soared and the bulls showed up and defended the 50 DMA line for the Nasdaq. After Wednesday’s close, the Fed released the results of its “stress test” and all the banks passed. Either the market was extremely lucky or someone leaked the information ahead of time. Separately, Janet Yellen and a few other Federal Reserve Officials publicly expressed concerns about the stock market. Mr. Williams said the stock market is running on ‘fumes’ and Dr. Yellen said, asset prices are ‘rich’ at these levels. Separately, pending home sales slid -0.8%, missing estimates for a gain of +0.5%.
Thur & Fri Action:
On Thursday, the sellers showed up in spades and sent a slew of tech stocks lower in heavy volume. The market appears to be tracing out a near-term top as so many stocks continue to fall in heavy volume. Before the open, the government said, GDP grew by +1.4%, in Q1 2017, beating estimates for a gain of +1.2%. That didn’t stop the sellers from showing up.
Stocks edged higher on Friday as the bulls showed up to defend the 50 DMA line for the Nasdaq on the last trading day of the month and quarter. June was littered with a spate of heavy volume down days which is not ideal for the market. We will see how this plays out over the summer.
Market Outlook: Bulls Defend Support
The bulls showed up and defended important support last week (50 dma line). As long as support holds, the bulls remain in control of this market. As always, keep your losses small and never argue with the tape


