

[su_heading style=”modern-2-dark” size=”20″] Market Update [/su_heading]
Stocks Fall As Earnings Season Begins
In a normal non QE world, Friday’s sell-off would signal a near term pullback will unfold. However, because of all the financial engineering from global central banks, all pullbacks over the past few years have been shallow in size and scope. Until that changes, this market has earned the bullish benefit of the doubt. Stocks fell hard last week as the market digested the latest round of mixed economic and earnings data. Investors continue to wait for a new catalyst to emerge to help the benchmark S&P 500 break out of its current 5-month trading range. Since December 2014, the S&P 500 has been trading between 2,119 (resistance) and 1,972 (support). At this point, investors want to see how the economy and corporate earnings performed in Q1 for a better sign of when the Fed will raise rates. So far, it is too early to tell for sure, but the “data” remains weak – which likely means a June rate hike is off the table. It is best to remain patient during a range-bound market until either support (bearish) or resistance (bullish) is broken. Until then, we have to expect this sloppy sideways action to continue. Stepping back, it is important to note that even with Friday’s sell off, the S&P 500 is only -2% below its record high – which is very impressive. Eventually, this market will get in trouble and roll over, but it has earned the bullish benefit of the doubt until more technical damage emerges.
[su_heading style=”modern-2-dark” size=”20″] Portfolio Update [/su_heading]
Thankfully, the FLS portfolio is doing well even as the market gets in a little trouble as we enter the heart of earnings season. We want to exercise patience until we get through the bulk of earnings.
[su_heading style=”modern-1-dark” size=”18″] Positions [/su_heading]
-
The service owns: MTH +20.28%, FB -1.74%, SPY +0.47%, TSLA +1.03%, HACK +0.66%, IBB +0.94%, GDX + -1.79%
-
The service will exit: MTH @ 45.11, FB @ 78.42, SPY @ 203.87, TSLA @ 193.97, HACK @ 27.49, IBB @ 333.57, GDX @ 19.24
[su_heading style=”modern-1-dark” size=”18″] Working Buy Orders [/su_heading]
[su_table]
| Status | Order | Ticker | Buy Stop | Protective Sell Stop | Risk from Entry |
| Working | Buy | AAPL | 130.38 | 125.66 | -3.62% |
[/su_table]
[su_heading style=”modern-2-dark” size=”20″] Analyzing The S&P 500’s Latest Moves (Up & Down) [/su_heading]
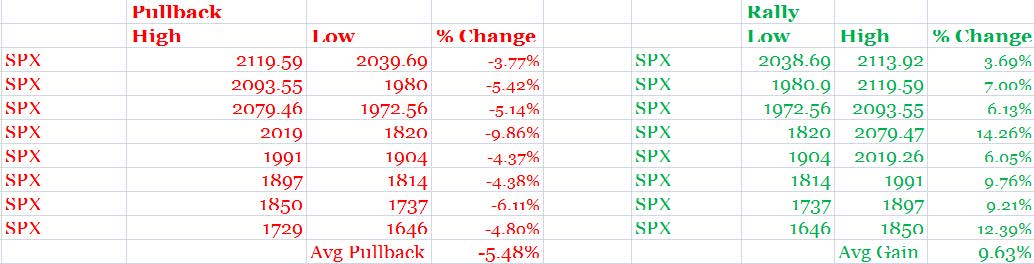
Nearly every pullback has been shallow in both size (small percent decline) and scope (short in duration) which is bullish for this ongoing and very powerful rally.
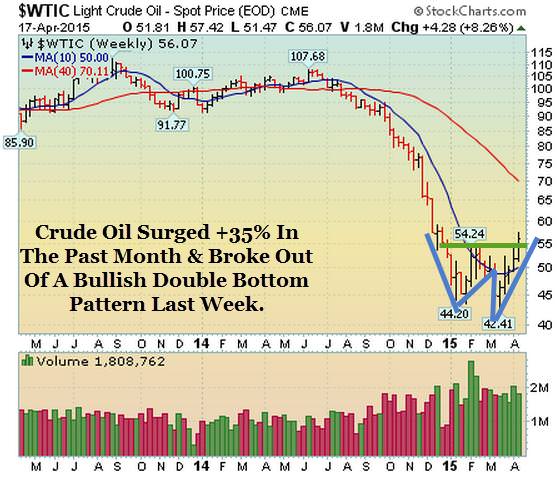
[su_heading style=”modern-2-dark” size=”20″] Chart of the Week [/su_heading]
Crude Oil Surged +35 In The Past Month & Broke Out Of A Bullish Double Bottom Base Last Week
[su_heading style=”modern-2-dark” size=”20″] 2015 Scorecard [/su_heading]
Nasdaq Comp +4.1% YTD, Russell 2k +4.0% YTD, S&P 500 +1.1%, DJ Industrials UNCH
[su_heading style=”modern-1-dark” size=”18″] Key Points [/su_heading]
Uptrend: Short-Term Pulling Back, Intermediate & Long Term Remain Strong
SPX Support = 2039, 1980, 1972, 1904, 1820
SPX Resistance = 2119.59
Sarhan’s Crowd Behavior Index: Neutral
(Proprietary market indicator that measures crowd sentiment: Bullish Bearish or Neutral)
[su_heading style=”modern-1-dark” size=”18″] Global Macro Update [/su_heading]
[su_row]
[su_column size=”1/2″]
Stocks: Uptrend
Bonds: Uptrend
Currencies (Euro/USD): Downtrend
Softs: Downtrend
[/su_column]
[su_column size=”1/2″]
Energy: Sideways
Metals: Sideways
Grains: Downtrend
[/su_column]
[/su_row]


