

[su_heading style=”modern-2-dark” size=”20″] Market Update [/su_heading]
Stocks End Mixed On Tepid Economic Data
Stocks ended mixed during the shortened holiday week as investors digested the latest round of weaker-than-expected economic data. The self-described data-dependent Fed will likely err on the side of keeping rates low for the foreseeable future because the “data” remains very weak. The Fed has held rates near zero since the 2008 financial crisis and has engaged in three rounds of massive QE (printing money). Even after all this, the Fed finds itself between a rock and a hard place. Remember, the Fed has a dual mandate, steady economic growth and keep inflation around 2%. Right now, they are failing on both fronts. Deflation remains more of a threat than inflation and the “data” suggests the economy remains very weak (possibly contracted in Q1). In addition, Q1 earnings are projected to be negative which is not ideal. All this tells us that the Fed will continue to err on the side of EASY MONEY for the foreseeable future. Futures fell hard on Friday and many people are calling for a Black Monday. While anything is possible, we do not feel it is probable (b/c nearly every major central bank in the world is still printing gobs of money every day and b/c the major averages are only 1-4% below their record/multi-decade highs. There was a significant amount of technical damage on the charts – before the last few market crashes. Again anything is possible, but until material weakness emerges – this aging bull market is still kicking and we want to give it the bullish benefit of the doubt for as long as possible.
[su_heading style=”modern-2-dark” size=”20″] Portfolio Update [/su_heading]
Thankfully, the FLS portfolio is doing well considering the S&P 500 is flat for the year. We will be slowly adding more positions, if/when the market rallies. We are heading into earnings seasons so most of our positions will be ETF’s whenever possible (until the brunt of earnings season passes). Here is a snapshot as of last week’s close:
[su_heading style=”modern-1-dark” size=”18″] Positions [/su_heading]
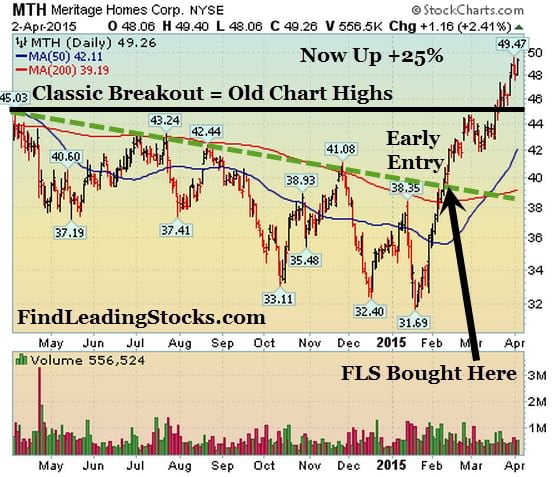
- The service owns: MTH +25.03%, FB -0.79%, SPY -0.27%
- The service will exit: MTH @ 45.11, FB @ 78.42, SPY @ 203.87
[su_heading style=”modern-1-dark” size=”18″] Working Buy Orders [/su_heading]
[su_table]
| Status | Order | Ticker | Buy Stop | Protective Sell Stop | Risk from Entry |
| Working | Buy | AAPL | 130.38 | 125.66 | -3.62% |
| Working | Buy | TSLA | 204.69 | 193.97 | -5.24% |
| Working | Buy | IBB | 353.14 | 333.57 | -5.54% |
| Working | Buy | HACK | 28.82 | 27.49 | -4.61% |
| Working | Buy | GDX | 20.08 | 19.24 | -4.18% |
[/su_table]
[su_heading style=”modern-2-dark” size=”20″] Analyzing The S&P 500’s Latest Moves (Up & Down) [/su_heading]
Nearly every pullback has been shallow in both size (small percent decline) and scope (short in duration) which is bullish for this ongoing and very powerful rally.
[su_table]
| Pullback | Rally | |||||
| High | Low | % Change | Low | High | % Change | |
| SPX | 2119.59 | 2040 | -3.77% | 2038.69 | 2113.92 | 3.69% |
| SPX | 2093.55 | 1980 | -5.42% | 1980.9 | 2119.59 | 7.00% |
| SPX | 2079.46 | 1973 | -5.14% | 1972.56 | 2093.55 | 6.13% |
| SPX | 2019 | 1820 | -9.86% | 1820 | 2079.47 | 14.26% |
| SPX | 1991 | 1904 | -4.37% | 1904 | 2019.26 | 6.05% |
| SPX | 1897 | 1814 | -4.38% | 1814 | 1991 | 9.76% |
| SPX | 1850 | 1737 | -6.11% | 1737 | 1897 | 9.21% |
| SPX | 1729 | 1646 | -4.80% | 1646 | 1850 | 12.39% |
| Avg Pullback | -5.48% | Avg Gain | 9.63% | |||
[/su_table]
[su_heading style=”modern-2-dark” size=”20″] Chart of the Week [/su_heading]
MTH: +25% Since Entry. Great example of how our early entry signals work! & when they don’t – you’re out for a VERY small low single digit loss
[su_heading style=”modern-2-dark” size=”20″] 2015 Scorecard [/su_heading]
Russell 2k +4.1% YTD, Nasdaq +3.2% YTD, S&P 500 +0.4%, Dow Jones Industrial -0.3%.
[su_heading style=”modern-1-dark” size=”18″] Key Points [/su_heading]
- Uptrend: Short-Term Pulling Back, Intermediate & Long Term Remain Strong
- SPX Support = 2039, 1980, 1972, 1904, 1820
- SPX Resistance = 2119.59
- Sarhan’s Crowd Behavior Index: Neutral
(Proprietary market indicator that measures crowd sentiment: Bullish Bearish or Neutral)
[su_heading style=”modern-1-dark” size=”18″] Global Macro Update [/su_heading]
[su_row]
[su_column size=”1/2″]
- Stocks: Uptrend
- Bonds: Uptrend
- Currencies (Euro/USD): Downtrend
- Softs: Downtrend
[/su_column]
[su_column size=”1/2″]
- Energy: Sideways
- Metals: Sideways
- Grains: Downtrend
[/su_column]
[/su_row]


