

[su_heading style=”modern-2-dark” size=”20″] Market Update [/su_heading]
July 2015 was a volatile month as investors had to navigate two potential external shocks (Greece and China) and digest a slew of economic and earnings data. After all was said and done, stocks ended the week and month higher after successfully testing critical support (bottom of the year-long trading range and the 200 DMA line) twice in July. Stepping back, the major indices are still in the middle of their year-long trading range with the Nasdaq leading and the Dow Industrials lagging. By definition, until either support (floor) or resistance (ceiling) is taken out we have to expect this sideways action to continue. That one reason we have been patient in adding new stocks in recent weeks. Thankfully, the FLS portfolio navigated earnings season with grace and is well positioned for a strong second half of the year. For the benchmark S&P 500, support resides near 2039 and resistance near 2134. In the short term, the market is moving sideways while the intermediate and long term trend remains up. We are still in a very strong (but aging) bull market which, by definition, means the path of least resistance remains higher (until any material technical damage emerges). The big take-away from earnings season (so far) is that investors do not “like” social media stocks ($FB, $TWTR, $LNKD, $YELP) and have an “appetite” for restaurant stocks ($CAKE, $PNRA, $CMG, $BWLD, etc).
[su_heading style=”modern-2-dark” size=”20″] Portfolio Update [/su_heading]
Thankfully, the FLS portfolio continues acting well. Thankfully, we tightened our stops last week and are comfortable with our current exposure. Here is a snapshot of the FLS portfolio as of Friday’s close,
[su_heading style=”modern-1-dark” size=”18″] Positions [/su_heading]
- The service owns: TSLA +30.03%, XLF +1.37%, AMZN +22.13%, REGN +6.27%, UA +14.05%
- The service will exit: TSLA @ 245.77, XLF @24.03, AMZN @482, REGN @ 521, UA @ 92.77
[su_heading style=”modern-1-dark” size=”18″] Working Buy Orders [/su_heading]
There are no new orders today and will look to do some buying in the near future as we make our way through earnings season.
[su_heading style=”modern-2-dark” size=”20″] Analyzing The S&P 500’s Latest Moves (Up & Down) [/su_heading]
Nearly every pullback has been shallow in both size (small percent decline) and scope (short in duration) which is bullish for this ongoing and very powerful rally.
[su_table]
| Pullback | Rally | |||||
| High | Low | % Change | Low | High | % Change | |
| SPX | 2132.8 | 2079.65 | -2.49% | 2044 | 2126.64 | 4.04% |
| SPX | 2134.7 | 2044.02 | -4.25% | 2039.7 | 2137.72 | 4.66% |
| SPX | 2129.9 | 2056.32 | -3.45% | 1980.9 | 2119.59 | 7.00% |
| SPX | 2134.7 | 2085.67 | -2.30% | 1972.6 | 2093.55 | 6.13% |
| SPX | 2119.6 | 2039.69 | -3.77% | 1820 | 2079.47 | 14.26% |
| SPX | 2093.6 | 1980 | -5.42% | 1904 | 2019.26 | 6.05% |
| SPX | 2079.5 | 17972.56 | -5.14% | 1814 | 1991 | 9.76% |
| SPX | 2019 | 1820 | -9.86% | 1737 | 1897 | 9.21% |
| 1991 | 1904 | -4.37% | 1646 | 1850 | 12.39% | |
| 1897 | 1814 | -4.38% | ||||
| 1850 | 1737 | -6.11% | ||||
| 1729 | 1646 | -4.80% | ||||
| Avg Pullback | -4.69% | Avg Gain | 8.17% | |||
[/su_table]
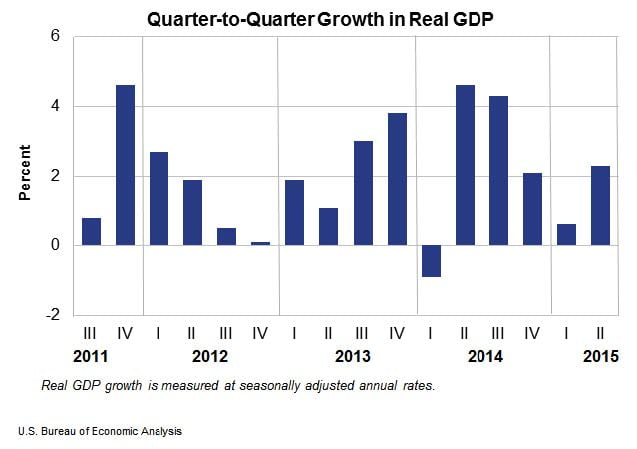
[su_heading style=”modern-2-dark” size=”20″] Chart of the Week [/su_heading]
GDP Grew by +2.3% in Q2 2015, missing estimates for +2.6% (With Rates At ZERO!)
[su_heading style=”modern-2-dark” size=”20″] Year-To-Date Scorecard [/su_heading]
Nasdaq Comp +8.3% YTD, S&P 500 +2.2% YTD, Russell 2k +2.8%, DJ Industrials -0.7%
[su_heading style=”modern-1-dark” size=”18″] Key Points [/su_heading]
- Uptrend: Short-Term Sideways, Intermediate & Long Term Remain Strong
- SPX Support: 2044, 2039, 1980, 1972, 1904, 1820
- SPX Resistance: 2134.72
- Sarhan’s Crowd Behavior Index: Bullish
(Proprietary market indicator that measures crowd sentiment: Bullish Bearish or Neutral)
[su_heading style=”modern-1-dark” size=”18″] Global Macro Update [/su_heading]
[su_row]
[su_column size=”1/2″]
- Stocks: Uptrend
- Bonds: Sideways
- Currencies (Euro/USD): Downtrend
- Softs: Downtrend
[/su_column]
[su_column size=”1/2″]
- Energy: Downtrend
- Metals: Downtrend
- Grains: Downtrend
[/su_column]
[/su_row]


