

[su_heading style=”modern-2-dark” size=”20″] Market Update [/su_heading]
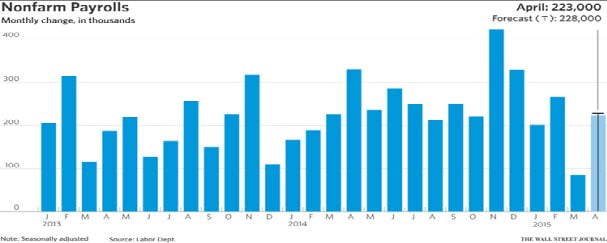
Last week was a bullish week on Wall Street as investors sent stocks higher after the “data” pretty much took a June rate hike off the table. The Fed believes that the economic weakness was ‘transitory’ in Q1 2015 which is their way of saying they believe the economy will improve in the second half of the year. April’s jobs report was slightly higher than expected which helped support that thesis. History shows us that some of the market’s strongest performers occur from big gaps up on earnings and some of the weakest stocks continue falling after gapping down after reporting numbers. That is why we want to separate the strong names from the weak names each earnings season. So far, the big winners from earnings season include: Amazon.com ($AMZN), Netflix ($NFLX), Hasbro ($HAS), Domino’s Pizza ($DPZ), Skechers ($SKX), Dunkin (Donuts) Brands Group ($DNKN), Microsoft Corp ($MSFT), O’Reilly Automotive ($ORLY), and YUM Brands ($YUM), Skywest ($SKYW), Web.com ($WWWW), Equinix ($EQIX), Styngenta ($SYT), Nutri System ($NTRI), Brink’s Co ($BCO), Teradyne Inc ($TER), Skyworks Solutions ($SWKS), GoPro ($GPRO), Estee Lauder ($EL), Abiomed Inc ($ABMD), Golar LNG ($GLNR), Energizer Holdings ($ENR), RetailMeNot, Inc ($SALE), Herbalife ($HLF), BlueBird Bio ($BLUE), HubSpot Inc ($HUBS), Alibaba Group ($BABA), Qorvo Inc ($QRVO), Visteon Copr ($VC), Norwegian Cruise Line Holdings ($NCLH), Activision Blizzard Inc ($ATVI), Stamps.com ($STMP), Imperva Inc ($IMPV), Tableau Systems ($DATA), AOL Inc ($AOL), Universal Display Corp ($OLED), CyberArk Software ($CYBR). On the downside: Monster Beverage Corp ($MNST), Cerner Corp ($CERN), Sprouts Farmers Market ($SFM), Priceline.com ($PCLN), Whole Foods Market ($WFM), Keurig Green Mountain ($GMCR), Kate Spade ($KATE), Lannett Co ($LCI), Nu Skin ($NUS), Terra Nitrogen ($TNH), Tumi Holdings ($TUMI), Noodles & Company ($NDLS), Qualys ($QLYS), Groupon Inc ($GRPN), just to name a few.
[su_heading style=”modern-2-dark” size=”20″] Portfolio Update [/su_heading]
Thankfully, FLS has navigated this latest pullback with grace and did not get caught with any big gap downs (and there were many this earnings season). There are a lot of quality setups and some of our favorite names are a little ended – which means we will look to buy them on secondary buy points in the weeks/months ahead. The service is returning to a few positions we just exited for nice gains and a few new ones to add, if they move higher.
[su_heading style=”modern-1-dark” size=”18″] Positions [/su_heading]
- The service owns: TSLA +15.59%, GDX -0.95%, AAPL -1.83%, NFLX -0.27%
- The service will exit: TSLA @ 204.69, GDX @ 19.24, AAPL @ 121.62, NFLX @ 551.97
[su_heading style=”modern-1-dark” size=”18″] Working Buy Orders [/su_heading]
[su_table]
| Status | Order | Ticker | Buy Stop | Protective Sell Stop | Risk From Entry |
| Working | Buy | SWKS | 99.57 | 94.57 | -5.02% |
| Working | Buy | HACK | 30.47 | 28.69 | -5.84% |
| Working | Buy | REGN | 486.1 | 453 | -6.81% |
| Working | Buy | MTH | 45.67 | 43.25 | -5.30% |
| Working | Buy | XLF | 24.87 | 24.03 | -3.38% |
[/su_table]
[su_heading style=”modern-2-dark” size=”20″] Analyzing The S&P 500’s Latest Moves (Up & Down) [/su_heading]
[su_table]
| Pullback | Rally | |||||
| High | Low | % Change | Low | High | % Change | |
| SPX | 2119.59 | 2040 | -3.77% | 2039.69 | 2125.92 | 4.23% |
| SPX | 2093.55 | 1980 | -5.42% | 1980.9 | 2119.59 | 7.00% |
| SPX | 2079.46 | 1973 | -5.14% | 1972.56 | 2093.55 | 6.13% |
| SPX | 2019 | 1820 | -9.86% | 1820 | 2079.47 | 14.26% |
| SPX | 1991 | 1904 | -4.37% | 1904 | 2019.26 | 6.05% |
| SPX | 1897 | 1814 | -4.38% | 1814 | 1991 | 9.76% |
| SPX | 1850 | 1737 | -6.11% | 1737 | 1897 | 9.21% |
| SPX | 1729 | 1646 | -4.80% | 1646 | 1850 | 12.39% |
| Avg Pullback | -5.48% | Avg Gain | 9.63% |
[/su_table]
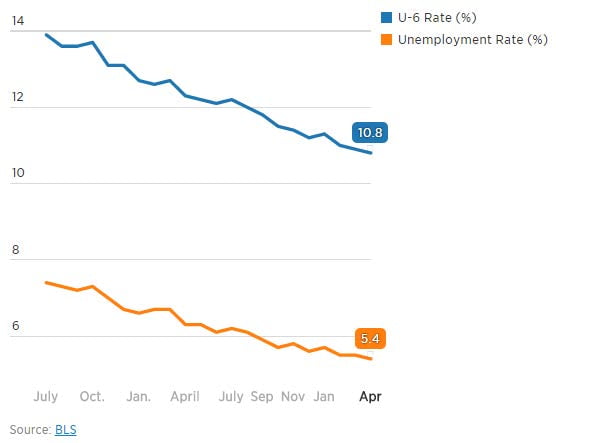
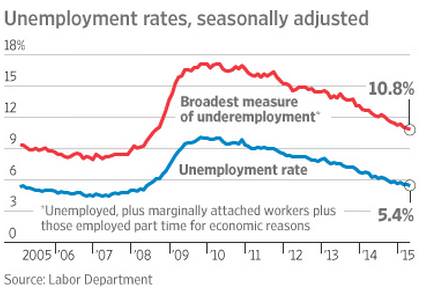
[su_heading style=”modern-2-dark” size=”20″] Chart of the Week [/su_heading]
A Closer Look At The Jobs Data
[su_heading style=”modern-2-dark” size=”20″] 2015 Scorecard [/su_heading]
Nasdaq Comp +5.4% YTD, S&P 500 +2.7%, Russell 2k +2.3% YTD, DJ Industrials +2.0%
[su_heading style=”modern-1-dark” size=”18″] Key Points [/su_heading]
- Uptrend: Short-Term, Intermediate & Long Term Remain Strong
- SPX Support = 2039, 1980, 1972, 1904, 1820
- SPX Resistance = 2126
- Sarhan’s Crowd Behavior Index: Bullish
(Proprietary market indicator that measures crowd sentiment: Bullish Bearish or Neutral)
[su_heading style=”modern-1-dark” size=”18″] Global Macro Update [/su_heading]
[su_row]
[su_column size=”1/2″]
- Stocks: Uptrend
- Bonds: Looks Toppy
- Currencies (Euro/USD): Trying to Bottom
- Softs: Downtrend
[/su_column]
[su_column size=”1/2″]
- Energy: Uptrend
- Metals: Sideways
- Grains: Downtrend
[/su_column]
[/su_row]


