

[su_heading style=”modern-2-dark” size=”20″] Market Update [/su_heading]
In the short-term the market remains range-bound while the intermediate and long term action remain strong. All the major averages are only 1-3% below their record highs which is a strong sign of strength. To be clear the tape remains very split with so many areas breaking down and acting weak. Confidence is extremely shaky in this bull market and we are way overdue for a correction. Until that occurs, the market deserves the bullish benefit of the doubt but we do remain cognizant of the fact that we are WAY overdue for a normal 10% correction. On to last week’s action – stocks opened higher but closed lower last week after the latest proposal from Greece was rejected and a slew of historic Supreme Court rulings were announced. Stocks opened higher after Greece announced a new proposal to appease their creditors. The deal was quickly rejected and stocks turned lower after Germany and other European countries said the deal was not satisfactory. Keep in mind Greece itself is small and doesn’t matter but what does matter is the precedent that will be set if Greece is allowed to default (Spain, Portugal, Italy etc may quickly follow and that could break up the entire Eurozone). That’s why Greece matters for now. On to our markets, the two big standout losers last week were the Utilities ($XLU) and the Transports ($IYT). Both of these important areas of the market are in correction territory (defined by a decline of >10%-19.9% from a recent high) sliced below key levels of support last week. This negative action bodes poorly for both Main Street and Wall Street and it will be very interesting to see how what happens with the incoming “data” over the next few months. At this point, we do not expect the Fed to raise rates until the “data” improves markedly which means the easy money trade remains alive and well.
[su_heading style=”modern-2-dark” size=”20″] Portfolio Update [/su_heading]
The FLS portfolio continues acting well. Remember, there is a time to buy and a time not to buy. To protect our positions we are moving our stops up wherever possible. For our newer members, we have not been buying adding exposure over the past two weeks and that turned out to be the right decision. Patience in this business is vital. Here is a snapshot of the FLS portfolio as of Friday’s close,
[su_heading style=”modern-1-dark” size=”18″] Positions [/su_heading]
- The service owns: TSLA +30.49%, NFLX +13.10%, XLF +0.08%, HACK +5.68%, DPZ +3.11%, MTH +5.11% AMZN -0.21%
- The service will exit: TSLA @ 245.77, NFLX @ 611.67, XLF @24.03, HACK @ 30.47, DPZ @ 111.14, MTH @ 46.05, AMZN @414.55
[su_heading style=”modern-1-dark” size=”18″] Working Buy Orders [/su_heading]
There are no new orders today
[su_heading style=”modern-2-dark” size=”20″] Analyzing The S&P 500’s Latest Moves (Up & Down) [/su_heading]
[dummy_text]
[su_table]
| Pullback | Rally | |||||
| High | Low | % Change | Low | High | % Change | |
| SPX | 2134.7 | 2085.67 | -2.30% | 2039.7 | 2134.72 | 4.66% |
| SPX | 2119.6 | 2039.69 | -3.77% | 1980.9 | 2119.59 | 7.00% |
| SPX | 2093.6 | 1980 | -5.42% | 1972.6 | 2093.55 | 6.13% |
| SPX | 2079.5 | 1972.56 | -5.14% | 1820 | 2079.47 | 14.26% |
| SPX | 2019 | 1820 | -9.86% | 1904 | 2019.26 | 6.05% |
| SPX | 1991 | 1904 | -4.37% | 1814 | 1991 | 9.76% |
| SPX | 1897 | 1814 | -4.38% | 1737 | 1897 | 9.21% |
| SPX | 1850 | 1737 | -6.11% | 1646 | 1850 | 12.39% |
| SPX | 1729 | 1646 | -4.80% | |||
| Avg Pullback | Avg Gain | 9.63% | ||||
[/su_table]
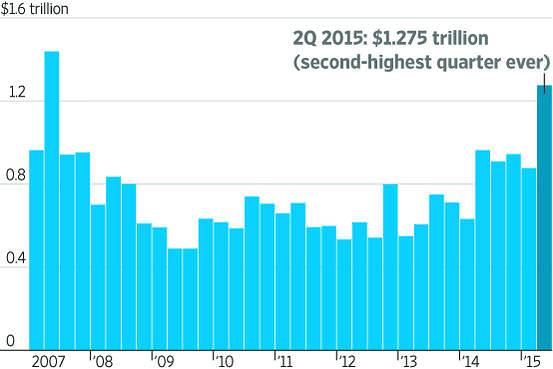
[su_heading style=”modern-2-dark” size=”20″] Chart of the Week [/su_heading]
WSJ: With $2.15 trillion of M&A activity so far, this year is on pace to challenge 2007 record
[su_heading style=”modern-2-dark” size=”20″] 2015 Scorecard [/su_heading]
Nasdaq Comp +6.8% YTD, Russell 2k +5.9%, S&P 500 +2% YTD, DJ Industrials +0.7%
[su_heading style=”modern-1-dark” size=”18″] Key Points [/su_heading]
- Uptrend: Short-Term Pulling Back, Intermediate & Long Term Remain Strong
- SPX Support = 2067, 2039, 1980, 1972, 1904, 1820
- SPX Resistance = 2134.72
- Sarhan’s Crowd Behavior Index: Neutral
(Proprietary market indicator that measures crowd sentiment: Bullish Bearish or Neutral)
[su_heading style=”modern-1-dark” size=”18″] Global Macro Update [/su_heading]
[su_row]
[su_column size=”1/2″]
- Stocks: Uptrend
- Bonds: Downtrend
- Currencies (Euro/USD): Sideways
- Softs: Sideways
[/su_column]
[su_column size=”1/2″]
- Energy: Sideways
- Metals: Sideways
- Grains: Downtrend
[/su_column]
[/su_row]


