

[su_heading style=”modern-2-dark” size=”20″] Market Update [/su_heading]
Stocks rallied last week after the Fed held rates near zero and created the “perfect hedge” by remaining “data-dependent.” Yellen told us that she is ready to raise rates if the “data” improves but is also ready not to raise rates (and implied that QE4 is not off the table) if the “data” weakens. This is exactly we have been saying in this column over the past few months because the data remains too weak. At this point, we do not expect the Fed to raise rates until the “data” markedly improves which means the easy money trade remains alive and well. The bulls were happy to see the Nasdaq composite, Biotechs, and small-cap Russell 2000 index all break out and hit fresh record highs last week. The Nasdaq composite finally surpassed its 2,000 high. It would be very healthy to see the Dow Industrials and the S&P 500 also breakout and hit new highs in the near future.
[su_heading style=”modern-2-dark” size=”20″] Portfolio Update [/su_heading]
The FLS portfolio continues acting well. Here is a snapshot of the FLS portfolio as of Friday’s close:
[su_heading style=”modern-1-dark” size=”18″] Positions [/su_heading]
- The service owns: TSLA +28.25%, NFLX +14.05%, XLF -0.52%, HACK +9.78%, DPZ +0.43%, MTH -1.43%, AMZN -0.93%
- The service will exit: TSLA @ 234.87, NFLX @ 576.13, XLF @24.03, HACK @ 28.69, DPZ @ 105.14, MTH @ 43.13, AMZN @414.55
[su_heading style=”modern-1-dark” size=”18″] Working Buy Orders [/su_heading]
There are no new orders today
[su_heading style=”modern-2-dark” size=”20″] Analyzing The S&P 500’s Latest Moves (Up & Down) [/su_heading]
Nearly every pullback has been shallow in both size (small percent decline) and scope (short in duration) which is bullish for this ongoing and very powerful rally.
[su_table]
| Pullback | Rally | |||||
| High | Low | % Change | Low | High | % Change | |
| SPX | 2134.7 | 2085.67 | -2.30% | 2039.7 | 2134.72 | 4.66% |
| SPX | 2119.6 | 2039.69 | -3.77 % | 1980.9 | 2119.59 | 7.00% |
| SPX | 2093.6 | 1980 | -5.42% | 1972.6 | 2093.55 | 6.13% |
| SPX | 2079.5 | 1972.56 | -5.14% | 1820 | 2079.47 | 14.26% |
| SPX | 2019 | 1820 | -9.86% | 1904 | 2019.26 | 6.05% |
| SPX | 1991 | 1904 | -4.37% | 1814 | 1991 | 9.76% |
| SPX | 1897 | 1814 | -4.38% | 1737 | 1897 | 9.21% |
| SPX | 1850 | 1737 | -6.11% | 1646 | 1850 | 12.39% |
| 1729 | 1646 | -4.80% | ||||
| Avg Pullback | -5.48% | Avg Gain | 9.63% | |||
[/su_table]
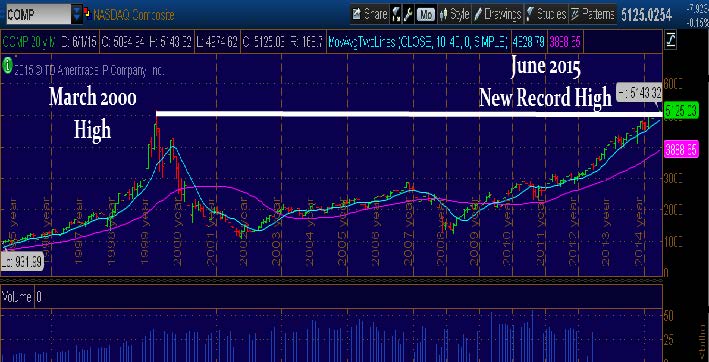
%[su_heading style=”modern-2-dark” size=”20″] Chart of the Week [/su_heading]
Nasdaq Composite – Hit A New Record High Last Week
[su_heading style=”modern-2-dark” size=”20″] 2015 Scorecard [/su_heading]
Nasdaq Comp +6.7% YTD, Russell 2k +5.0%, S&P 500 +1.8% YTD, DJ Industrials +0.5%
[su_heading style=”modern-1-dark” size=”18″] Key Points [/su_heading]
- Uptrend: Short-Term, Intermediate & Long Term Remain Strong
- SPX Support = 2067, 2039, 1980, 1972, 1904, 1820
- SPX Resistance = 2134.72
- Sarhan’s Crowd Behavior Index: Bullish
(Proprietary market indicator that measures crowd sentiment: Bullish Bearish or Neutral)
[su_heading style=”modern-1-dark” size=”18″] Global Macro Update [/su_heading]
[su_row]
[su_column size=”1/2″]
- Stocks: Uptrend
- Bonds: Downtrend
- Currencies (Euro/USD): Sideways
- Softs: Downtrend
[/su_column]
[su_column size=”1/2″]
- Energy: Sideways
- Metals: Sideways
- Grains: Downtrend
[/su_column]
[/su_row]


