

[su_heading style=”modern-2-dark” size=”20″] Market Update [/su_heading]
The year-long trading range we have seen on Wall Street continued as the benchmark S&P 500 pulled back last week after flirting with resistance (the top of its year-long range). There is a very high probability that the major averages are forming a large topping pattern after a strong 6.5 year bull market. We will need to support break for the major averages before that top will be confirmed. Conversely, if resistance is taken out – we have to expect a new leg higher to commence. Earnings remain front and center as a slew of companies announced their Q2 results. So far, approximately 75% of companies have beat earnings estimates while just over 50% have beat revenue estimates. At first glance, the fact that two-thirds of the companies beat earnings estimates looks healthy but it is important to note that estimates have been lowered substantially in recent months. So the “bar” is very low and that is why investors are not aggressively buying stocks. For example, if company XYZ was expected to lose 10 cents per share in Q2 but “only” lost 5 cents – technically, they beat estimates but they still lost money – which is not healthy for this lackluster economic recovery. The bulls would argue that over the past 6.5 years we haven’t really seen a robust earnings season – yet the market continues to rally (Thanks to easy money from global central banks). In the short term, the market is moving sideways while the intermediate and long term trend remains up. We are still in a very strong (but aging) bull market which, by definition, means the path of least resistance remains higher (until any material technical damage emerges -e.g. support breaks). It is also important to note that we are seeing a lot of areas break down and act very weak and notwithstanding more easy money from global central banks – the market appears to be getting weaker up here – not stronger.
[su_heading style=”modern-2-dark” size=”20″] Portfolio Update [/su_heading]
Thankfully, the FLS portfolio had a great week and continues acting very well. We are tightening our stops in case the market decides to roll over. We have large gains and it is prudent (especially considering the way the market has been acting this month) – to raise our stops wherever possible. Here is a snapshot of the FLS portfolio as of Friday’s close,
[su_heading style=”modern-1-dark” size=”18″] Positions [/su_heading]
-
The service owns: TSLA +29.66%, NFLX +32.86%, XLF +1.01%, AMZN +20.60%, REGN +4.00%, UA +10.29%
-
The service will exit: TSLA @ 245.77, NFLX @ 107.57, XLF @24.03, AMZN @482, REGN @ 521, UA @ 92.77
[su_heading style=”modern-1-dark” size=”18″] Working Buy Orders [/su_heading]
We are comfortable with our current exposure and are entering the heard of earnings season so there are no new orders today.
[su_heading style=”modern-2-dark” size=”20″] Analyzing The S&P 500’s Latest Moves (Up & Down) [/su_heading]
[dummy_text]
[su_table]
| Pullback | Rally | |||||
| High | Low | % Change | Low | High | % Change | |
| SPX | 2132.8 | 2079.65 | -2.49% | 2044 | 2126.64 | 4.04% |
| SPX | 2134.7 | 2044.02 | -4.25% | 2039.7 | 2134.72 | 4.66% |
| SPX | 2129.9 | 2056.32 | -3.45% | 1980.9 | 2119.59 | 7.00% |
| SPX | 2134.7 | 2085.67 | -2.30% | 1972.6 | 2093.55 | 6.13% |
| SPX | 2119.6 | 2039.69 | -3.77% | 1820 | 2079.47 | 14.26% |
| SPX | 2093.6 | 1980 | -5.42% | 1904 | 2019.26 | 6.05% |
| SPX | 2079.5 | 1972.56 | -5.14% | 1814 | 1991 | 9.76% |
| SPX | 2019 | 1820 | -9.86% | 1737 | 1897 | 9.21% |
| SPX | 1991 | 1904 | -4.37% | 1646 | 1850 | 12.39% |
| SPX | 1897 | 1814 | -4.38% | |||
| SPX | 1850 | 1737 | -6.11% | |||
| SPX | 1729 | 1646 | -4.80% | |||
| Avg Pullback | -4.69% | Avg Gain | 8.17% | |||
[/su_table]
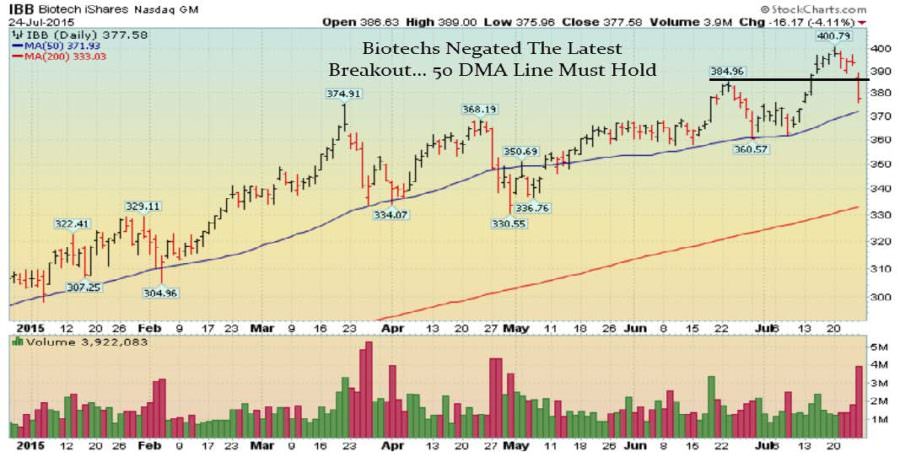
[su_heading style=”modern-2-dark” size=”20″] Chart of the Week [/su_heading]
The All-Important Biotech ETF Negated Its Latest Breakout & Now The 50 DMA Must Hold
[su_heading style=”modern-2-dark” size=”20″] 2015 Scorecard [/su_heading]
Nasdaq Comp +7.4% YTD, Russell 2k +1.8%, S&P 500 +1.0% YTD, DJ Industrials -1.4%
[su_heading style=”modern-1-dark” size=”18″] Key Points [/su_heading]
-
Uptrend: Short-Term Sideways, Intermediate & Long Term Remain Strong
-
SPX Support: 2044, 2039, 1980, 1972, 1904, 1820
-
SPX Resistance: 2134.72
-
Sarhan’s Crowd Behavior Index: Neutral
(Properitary market indicator that measures crowd sentiment: Bullish Bearish or Neutral)
[su_heading style=”modern-1-dark” size=”18″] Global Macro Update [/su_heading]
[su_row]
[su_column size=”1/2″]
- Stocks: Uptrend
- Bonds: Sideways
- Currencies (Euro/USD): Downtrend
- Softs: Downtrend
[/su_column]
[su_column size=”1/2″]
- Energy: Downtrend
- Metals: Downtrend
- Grains: Downtrend
[/su_column]
[/su_row]


