

[su_spoiler title=”Monday-Wednesday’s Action: Stocks Rally On Greek Deal” style=”fancy”]
Stocks soared on Monday after lengthy negotiations between Greek officials and euro zone creditors produced a framework for the third bailout package for the tiny nation-state in the past few years. The latest agreement includes EUR 25 billion in bank recapitalization funds to help keep Greece in the eurozone (for now). The deal requires Greece to streamline value-added taxes, broaden its tax base to increase revenue, curb pension costs, and privatize public assets worth as much as 50 billion euros into a separate trust. Economic data was light, the Treasury Budget statement for June showed a surplus of $51.80 billion, beating the consensus for a $51 billion surplus. Stocks rallied for a fourth straight day on Tuesday after a US-led coalition of 5 other nations inked a deal with Iran regarding their nuclear program. In the US, economic data did not impress. Retail sales fell -0.3%, missing estimates for a gain of +0.3%. The NFIB small business optimism index was 94.1, missing estimates for 97.5. JPMorgan Chase ($JPM) and Wells Fargo ($WFC) both rallied after reporting Q2 results. On Wednesday, stocks opened higher but closed lower after Greek protests turned violent in Athens before the Greek parliament passed their latest bailout package. In earnings news, Bank of America ($BAC), PNC ($PNC) and U.S. Bancorp ($USB) all rallied after releasing their Q2 results. Celgene ($CELG) raised guidance and said they are buying Receptos (RCPT) for $232/share in cash, causing both biotech stocks to gap higher. The Biotech ETF ($IBB) broke out and continues to be a very strong group for this 6.5 year bull market. Elsewhere, Janet Yellen told the House Financial Services Committee that she expects a rate hike later this year if economic conditions hold up. Economic data was mixed. Producer prices rose +0.4% in June, beating estimates for a gain of +0.3%. The Empire Manufacturing Survey for July came in at 3.86, beating the forecast for 3.5. Industrial production rose 0.3% in June, beating estimates for a 0.2% gain. The Atlanta Fed Business Inflation expectation came in at 2%, slightly higher than the 1.9% estimate. The Fed’s beige book showed economic activity is still not humming.
[/su_spoiler]
[su_spoiler title=”Thursday-Friday’s Action: Financials, Netflix, Ebay, Google Among Big Earnings Winners So Far” style=”fancy”]
The Nasdaq 100 broke out of its year-long trading range and hit a new 15-year high on Thursday as investors digested a slew of economic and earnings data. Overseas, the ECB held rates steady, said Greece’s place in the Euro is not doubted, and raised emergency funding. Netflix ($NFLX), Citigroup ($C) and Ebay ($EBAY) rallied after reporting their latest quarterly results. Jobless claims came in at 281k, beating estimates for 282k. The Philly Fed index slowed considerably to 5.7, missing estimates for 12.0. The housing market index was unchanged at 60, beating estimates for 59. Ms. Yellen testified to the Senate and reiterated her recent stance. Stocks were relatively quiet on Friday as the market paused to digest the latest rally. Economic data was mixed, the consumer price index rose 3% which matched estimates. Housing starts jumped to 1.174M, beating estimates for 1.125M. Consumer sentiment came in at 93.3, missing estimates for 96.0.
[/su_spoiler]
[su_spoiler title=”Market Outlook: The Central Bank Put Is Alive And Well” style=”fancy”]
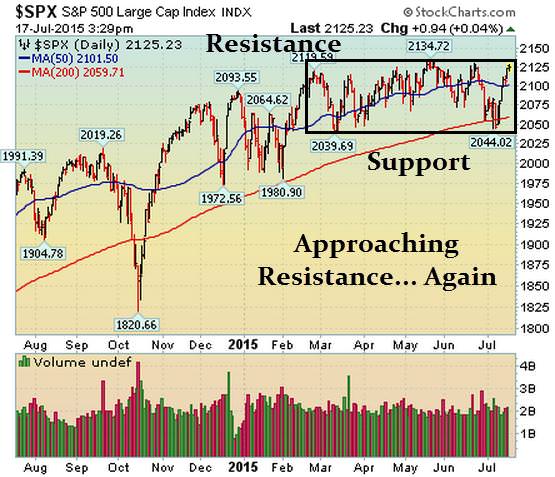
Remember, in bull markets surprises happen to the upside. This has been our primary thesis since the end of 2012. We would be remiss not to note that this very strong bull market is aging (celebrated its 6th anniversary in March 2015) and the last two major bull markets ended shortly after their 5th anniversary; 1994-2000 & 2002-Oct 2007). To be clear, the central bank put is very strong and until material damage occurs, the stock market deserves the longer-term bullish benefit of the doubt. As always, keep your losses small and never argue with the tape.
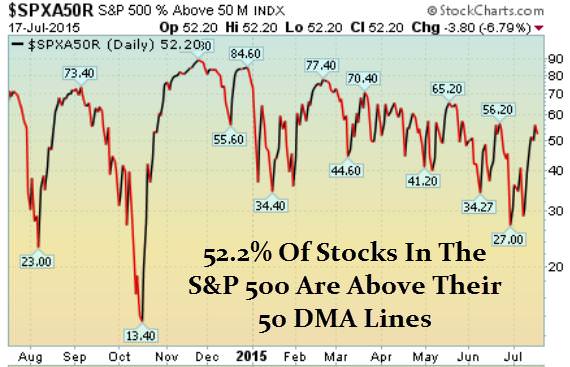
52.2% Of Stocks in the S&P 500 Are Above Their Respective 50 DMA
(Market Tends To Turn When This Reading Gets Above 70% or Below 40%)
Observation: Readings above 70% usually (not always) correspond with a short term pullback
Conversely, reads below 40% usually (not always) correspond with a short term bounce
[/su_spoiler]
[su_spoiler title=”Big Stock List” style=”fancy”]
- AAPL – Strong rally last week and closed above 50 DMA line after testing 200 DMA. Earning 7/21
- AMZN – HUGE rally last week ahead of earnings. Bulls recently defended 50 DMA. Earnings 7/23
- EA – Remains very extended. Earnings 7/30
- FB – Very strong rally last week helping it breakout above bullish 3-week handle. Extended in near term. Earnings 7/29
- FLT – Down 5th straight week. 50 DMA line is resistance. Earnings 7/30
- GOOGL – Explosive post-earnings breakaway gap!
- ILMN – Extended but very strong action continues. Only 2 down wks in past 3 months. Earnings 7/21
- NFLX – Huge Post Earnings gap. Extended. Only 4 down wks since mid-April. Very strong action
- SBUX – Extended but very healthy action continues. Broke out of nice 3 wk handle. Earnings 7/23
- TSLA – Very strong rally after 50 DMA line was defended. Earnings 8/5
- UA – Continues forming right side of large cup shaped base. Earnings 7/23
- V – Broke out of latest base late last week. Earnings 7/23
[/su_spoiler]
[su_spoiler title=”21 New Setups” style=”fancy”]
These hand-picked stocks are carefully selected to help with your idea generation and offer you additional setups each week. The setups are based on our proprietary criteria and offer advanced (dotted line) & classic long and short entry points (solid line). Short patterns are typically mirror images of long patterns.
Note: Please Verify All Earnings Dates/Data from Multiple Sources for Every Stock in all our report(s).
Charts Courtesy of FreeStockCharts.com and/or Stockcharts.com
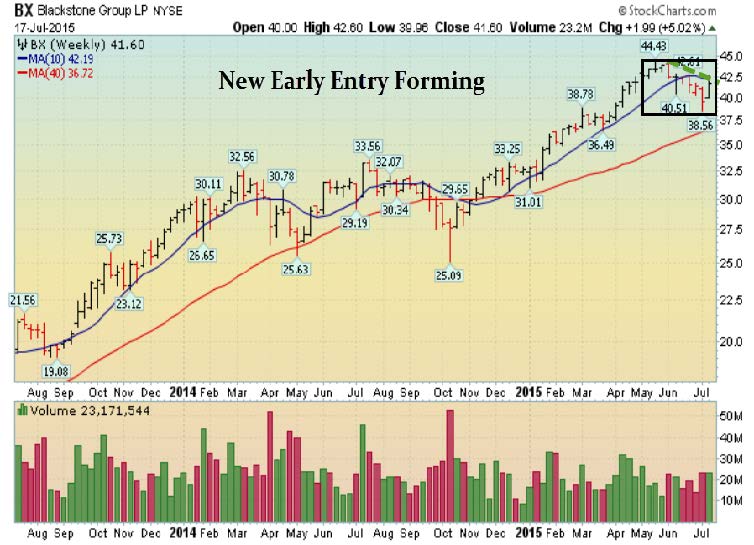
BX Setup – New Early Entry Forming
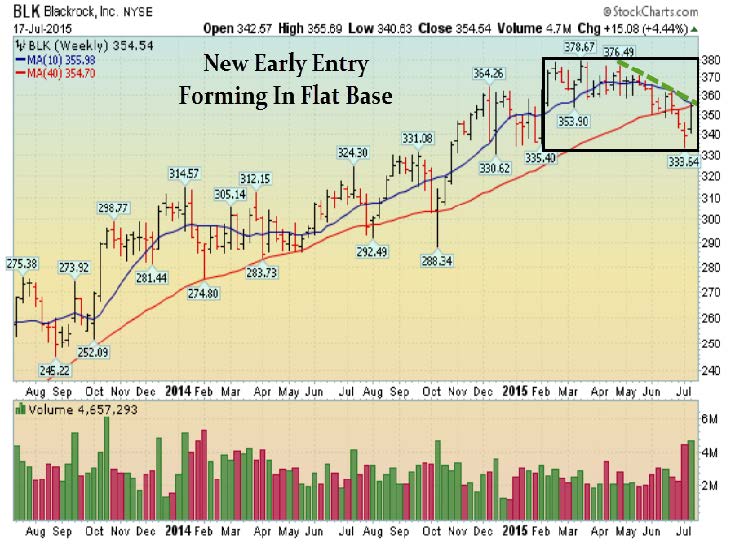
BLK Setup: Early Entry In Flat Base
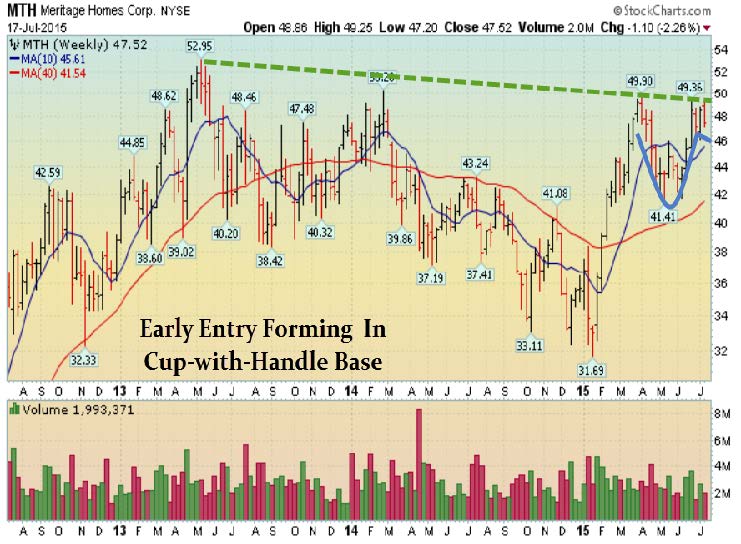
MTH Setup: New Early Entry Forming In Cup-with-Handle Base
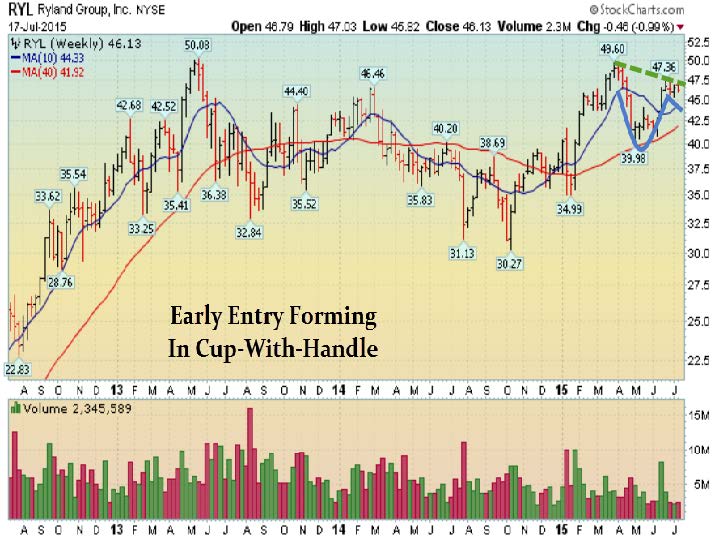
RYL Setup: New Early Entry Forming In Bullish Cup-with-Handle Pattern
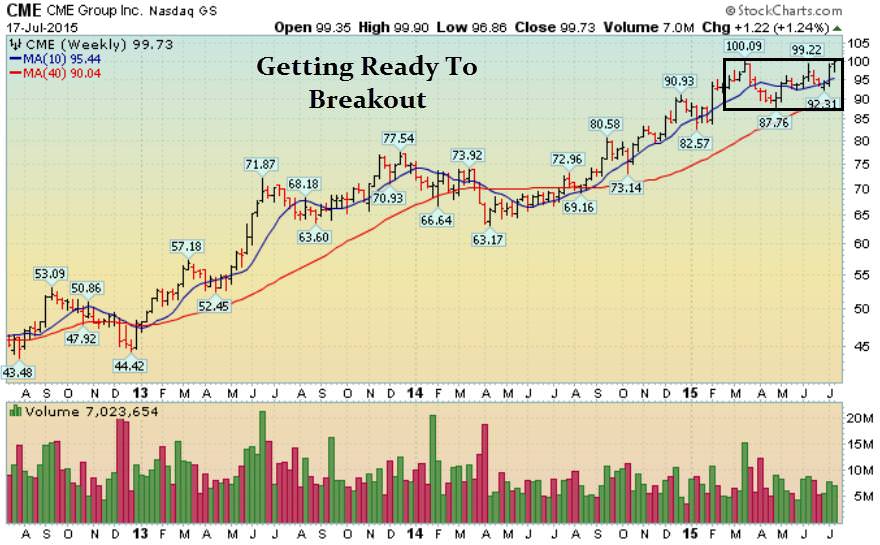
CME Setup: Getting Ready To Breakout
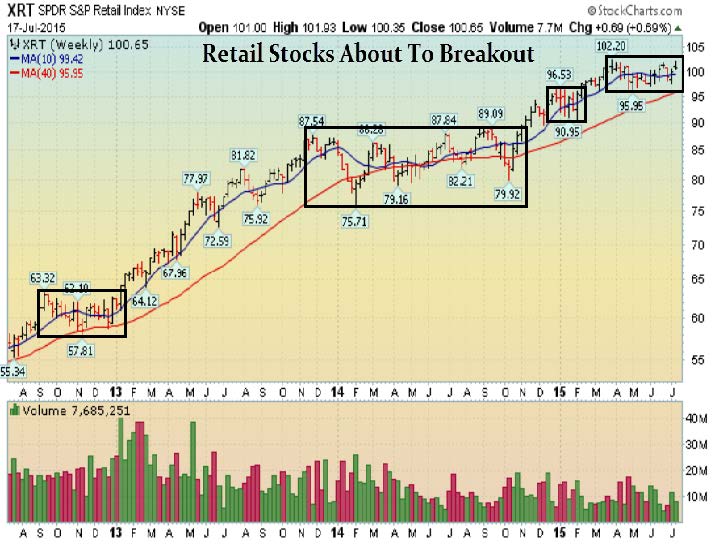
XRT Setup: Getting Ready To Breakout – Again
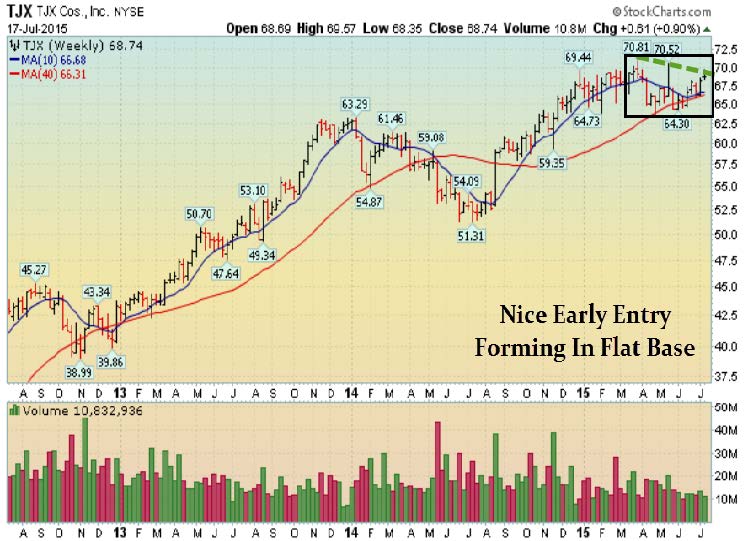
TJX Setup: Early Entry In New Flat Base
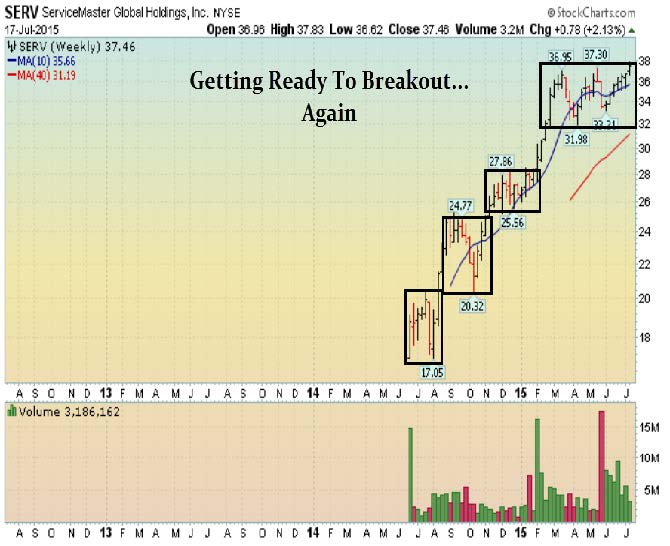
SERV Setup: Getting Ready To Breakout… Again
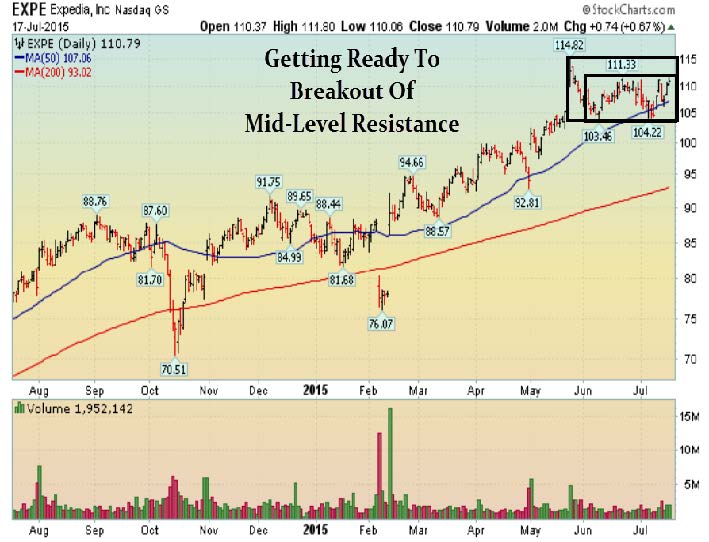
EXPE Setup: Getting Ready To Breakout of Mid-Level Resistance
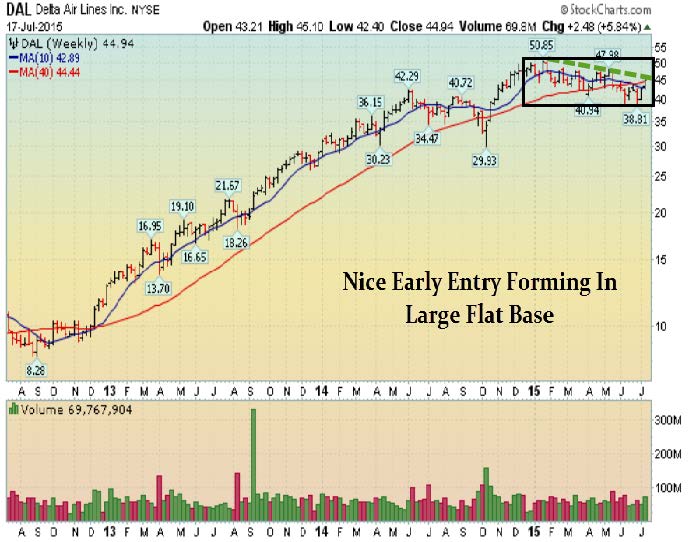
DAL Setup: New Early Entry Forming In Large Flat Base
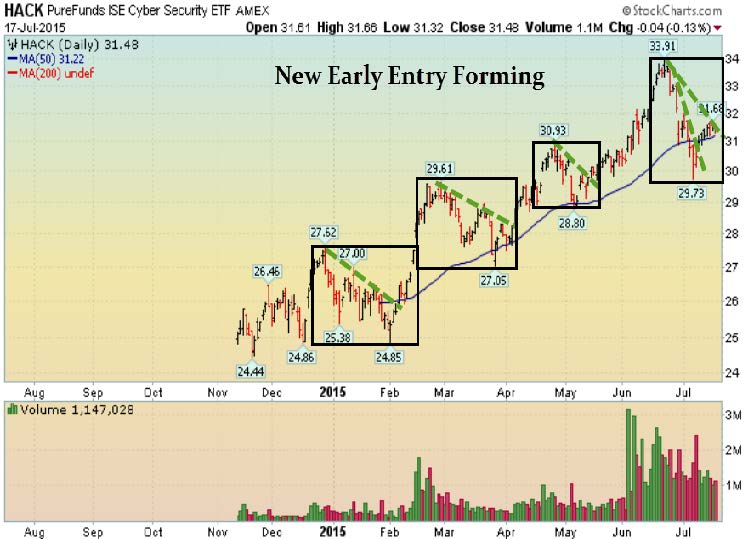
HACK Setup: New Early Entry Forming
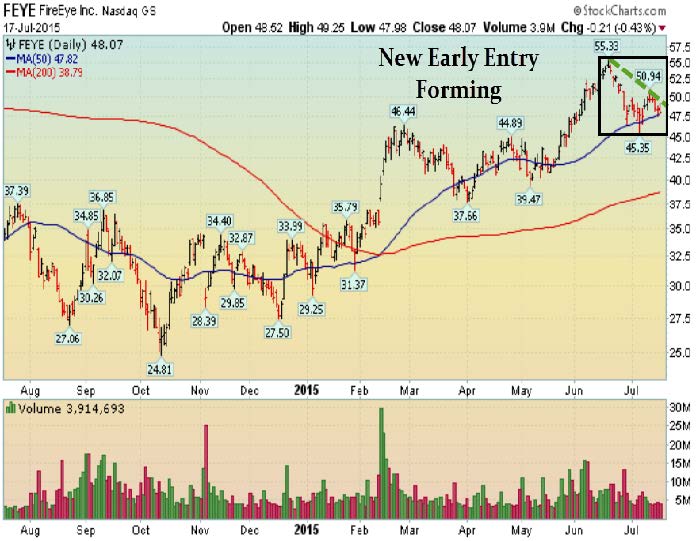
FEYE Setup: A New Early Entry Forming
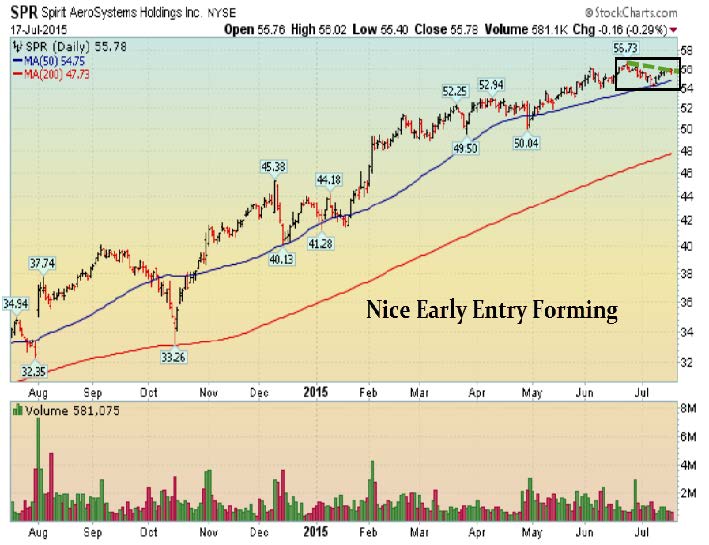
SPR Setup – Nice Early Entry Forming
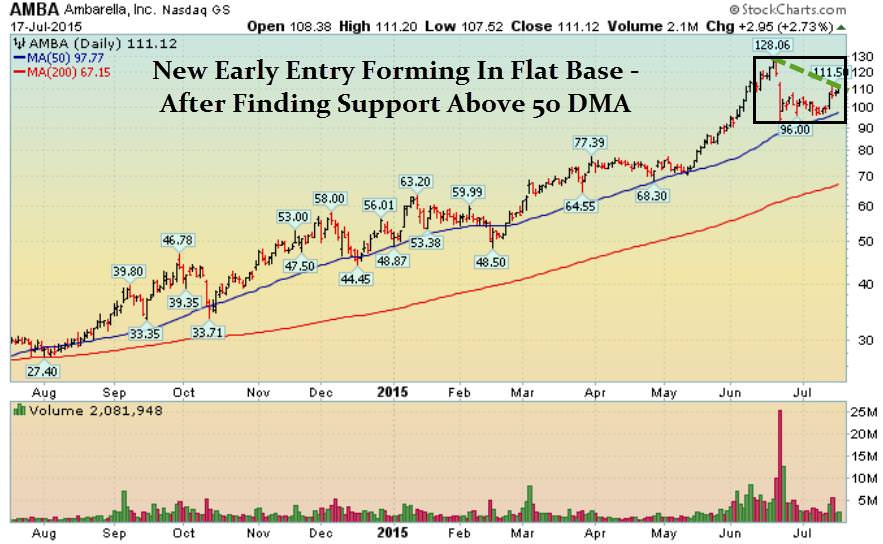
AMBA Setup – New Early Entry Forming In Flat Base
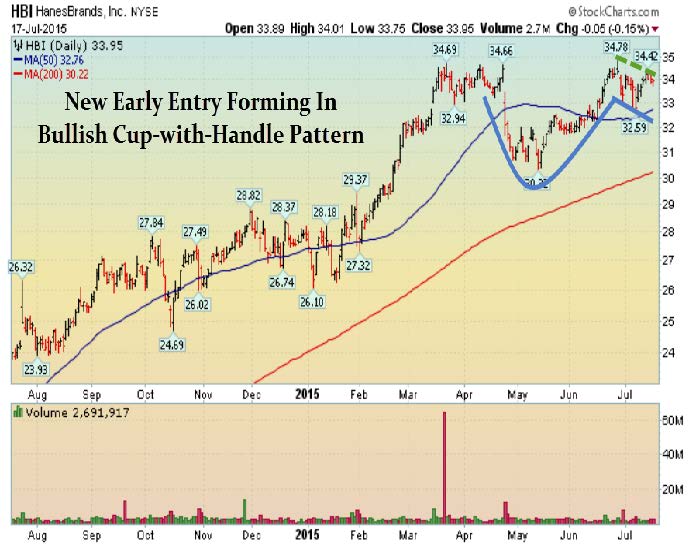
HBI Setup – New Early Entry Forming In Cup-with-Handle Base
[/su_spoiler]
[su_spoiler title=”Strongest Sectors, Groups, & Symbols” style=”fancy”]
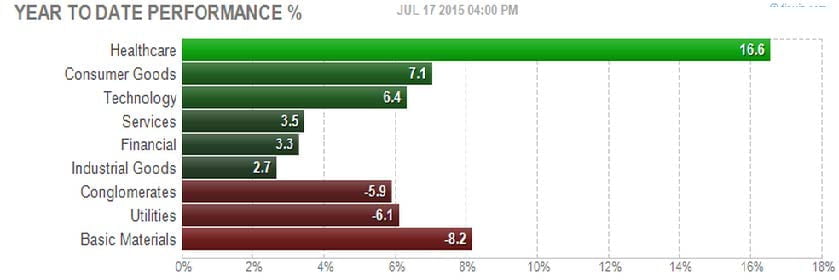
[su_heading style=”modern-1-dark” size=”18″]Strongest Sectors [/su_heading]
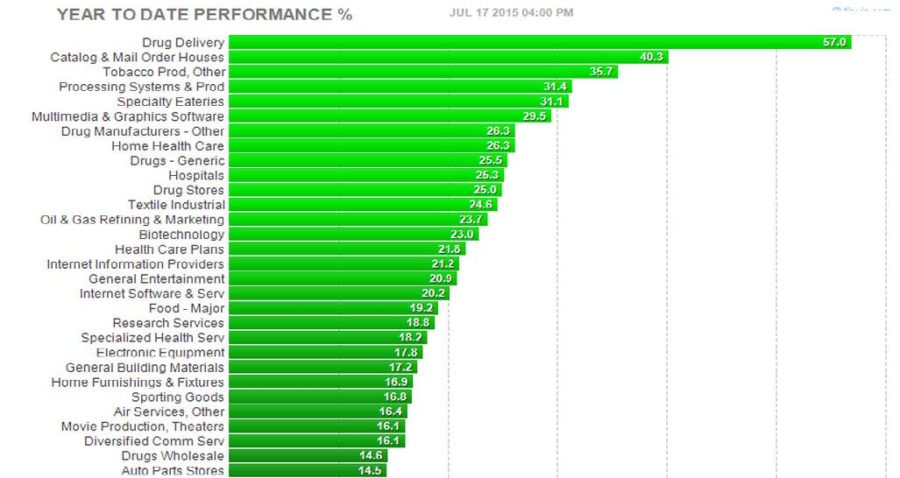
[su_heading style=”modern-1-dark” size=”18″]Strongest Groups [/su_heading]
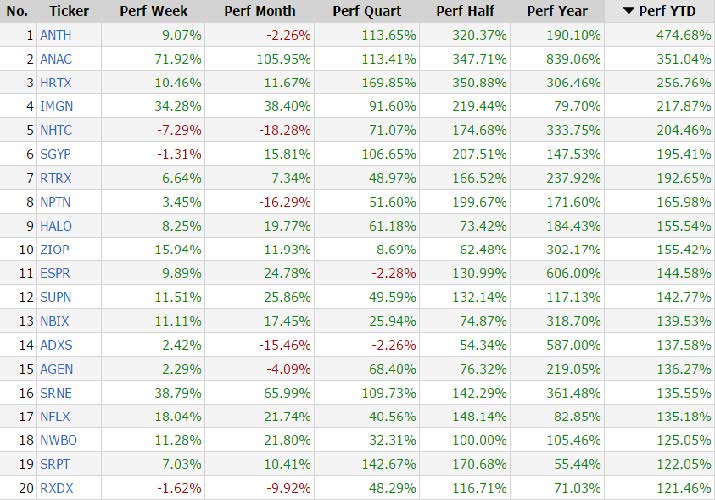
[su_heading style=”modern-1-dark” size=”18″]Strongest Performing Symbols This Year [/su_heading]
These are the top 20 strongest performing tickers on a year-to-date basis that are trading over $5, average daily volume over 500k and have a market cap >300M (Small cap-Mega Cap)
[/su_spoiler]


