

[su_spoiler title=”Monday-Wednesday’s Action: Stocks Drift Lower Top Of Range” style=”fancy”]
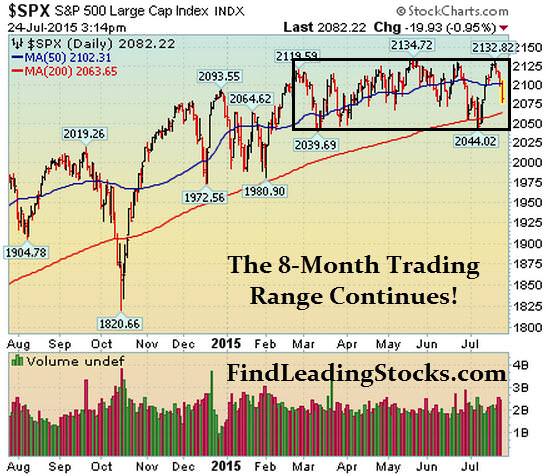
Stocks edged higher on Monday helping the S&P 500 rally into resistance (top of year-long trading range) near 2130 area. The Nasdaq 100 and Nasdaq composite jumped to fresh 15-year highs and continue to out-perform the other popular indices. Overnight, the big story was a massive drop in the price of Gold. Gold, (and most commodities for that matter) is in a very long bear market so the path of least resistance is down until the buyers can regain control. Gold hit an all-time high of $1,923.70/ounce in September 2011 and has plunged over 800 points, -43%, since that record high.
Stocks fell hard on Tuesday after a few closely followed blue chip stocks missed numbers and dragged the major averages lower. The S&P 500 simply pulled back from resistance of its year long range. IBM ($IBM) and United Technologies ($UTX), two Dow stocks, both fell hard on Tuesday. IBM ‘s year-over-year revenue showed the 13th consecutive quarterly decline which does not bode well for big blue. Separately, United Technologies plunged over -7% after revenue missed estimates and the company lowered earnings guidance for the rest of the year.
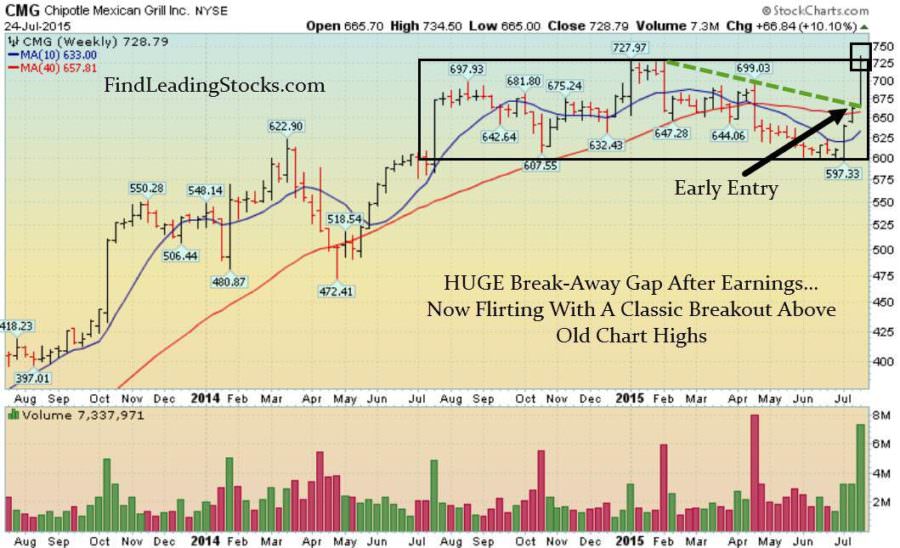
Stocks fell on Wednesday after Apple ($AAPL) and Microsoft (MSFT) disappointed the Street with their latest quarterly reports. Chipotle Mexican Grill ($CMG) enjoyed an explosive gap up after reporting earnings. Commodities also remained front and center as gold fell for the 10th consecutive day and fell below $1,100 an ounce and crude oil fell to near $50/barrel. Economic data was light. The FHFA said U.S. home prices matched estimates and rose +5.7% vs May 2014. Separately, existing home sales jumped +3.2% from the previous month in June hitting their highest level in over eight years. Existing homes sales rose to 5.49M, beating estimates for 5.4M.
[/su_spoiler]
[su_spoiler title=”Thursday-Friday’s Action: Earnings Continue Coming Out In Droves” style=”fancy”]
Stocks fell on Thursday as stocks continued to drift lower sending the S&P 500 back to its 50 DMA line. Four big Dow stocks were hit hard after reporting their quarterly results. Credit card giant American Express ($AXP), 3M ($MMM), and Caterpillar ($CAT) all gapped down after reporting their numbers. After the bell, Amazon ($AMZN) soared after surprising the Street with a quarterly profit. The stock surged nearly 20% on the very strong quarter. Coffee giant Starbucks ($SBUX) and Visa ($V) also gapped up after reporting quarterly results. In other news, Anthem ($ANTM) agreed to buy Cigna ($CI) for about $188/share. Initial jobless claims plunged to 255k, easily beating estimates for 279k and hit the lowest level in over three decades. A separate report showed leading Indicators rose by +0.6% in June, beating estimates for +0.2% gain. The Chicago Fed National Activity Index rose to 0.08, beating estimates for -0.05. Kansas City Fed Manufacturing Index remains in negative territory and contracted to -7. Stocks fell hard on Friday after the latest round of earnings failed to impress investors and rumors spread that the FOMC’s projections were leaked. Finally, new home sales plunged -6.8% to 482k, missing estimates for 550k and erased the past two months of gains.
[/su_spoiler]
[su_spoiler title=”Market Outlook: The Central Bank Put Is Alive And Well” style=”fancy”]
Remember, in bull markets surprises happen to the upside. This has been our primary thesis since the end of 2012. We would be remiss not to note that this very strong bull market is aging (celebrated its 6th anniversary in March 2015) and the last two major bull markets ended shortly after their 5th anniversary; 1994-2000 & 2002-Oct 2007). To be clear, the central bank put is very strong and until material damage occurs, the stock market deserves the longer-term bullish benefit of the doubt. As always, keep your losses small and never argue with the tape.
39% Of Stocks in the S&P 500 Are Above Their Respective 50 DMA
(Market Tends To Turn When This Reading Gets Above 70% or Below 40%)
Observation: Readings above 70% usually (not always) correspond with a short term pullback
Conversely, reads below 40% usually (not always) correspond with a short term bounce
[image]
[/su_spoiler]
[su_spoiler title=”Conviction Leaders List” style=”fancy”]
-
AAPL – Big negative reversal on a weekly basis after earnings
-
AMZN – HUGE gap up after blowing away the Street’s estimate. Very extended in near term
-
EA – Closed lower last week but still extended ahead of Earnings on 7/30
-
FB – Extended in near term ahead of Earnings 7/29
-
FLT – 6th straight weekly decline. 50 DMA line is resistance. Earnings 7/30
-
GOOGL – Big negative reversal last week from a new record high and now filling the explosive post-earnings breakaway gap
-
ILMN – Gapped down after reporting earnings last week but 50 DMA line is defended – for now.
-
NFLX – Fell last week but still acting very well after huge breakaway earnings gap
-
SBUX – Remains Extended. Very nice gap up after reporting earnings last week
-
TSLA – Big negative reversal last week (weekly chart). 50 DMA line is support. Earnings 8/5
-
UA – HUGE Breakaway gap last week after reporting earnings
-
V – HUGE Breakaway gap last week after reporting earnings
[/su_spoiler]
[su_spoiler title=”15 New Setups” style=”fancy”]
These hand-picked stocks are carefully selected to help with your idea generation and offer you additional setups each week. The setups are based on our proprietary criteria and offer advanced (dotted line) & classic long and short entry points (solid line). Short patterns are typically mirror images of long patterns.
Note: Please Verify All Earnings Dates/Data from Multiple Sources for Every Stock in all our report(s).
Charts Courtesy of FreeStockCharts.com and/or Stockcharts.com
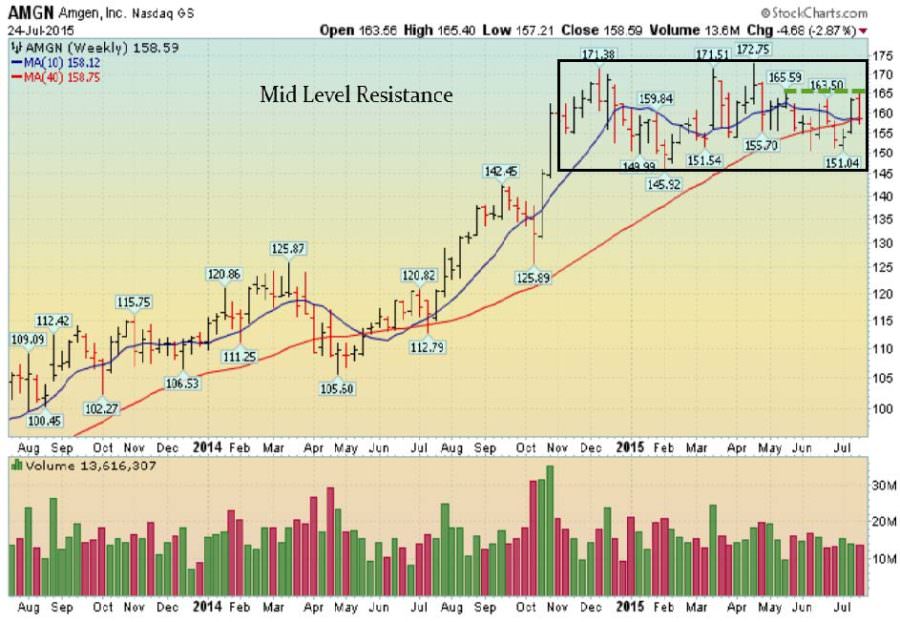
AMGN Setup – Watch For A Mid-Level Resistance Breakout
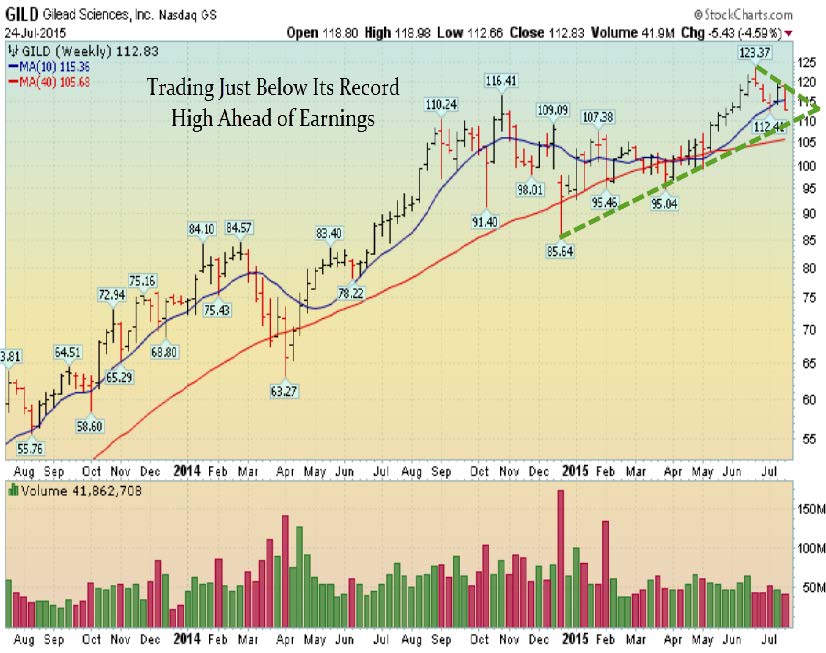
GILD Setup: Early Entry Forming
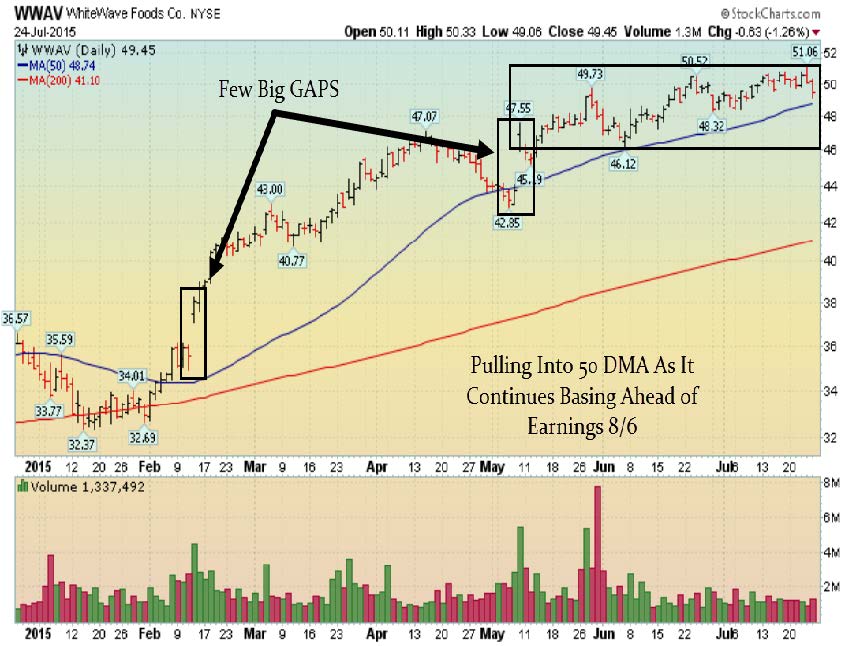
WWAV Setup: Pulling Into 50 DMA line Ahead of Earnings 8/6
CMG Setup: Flirting With A Classic Breakout Above Old Chart Highs
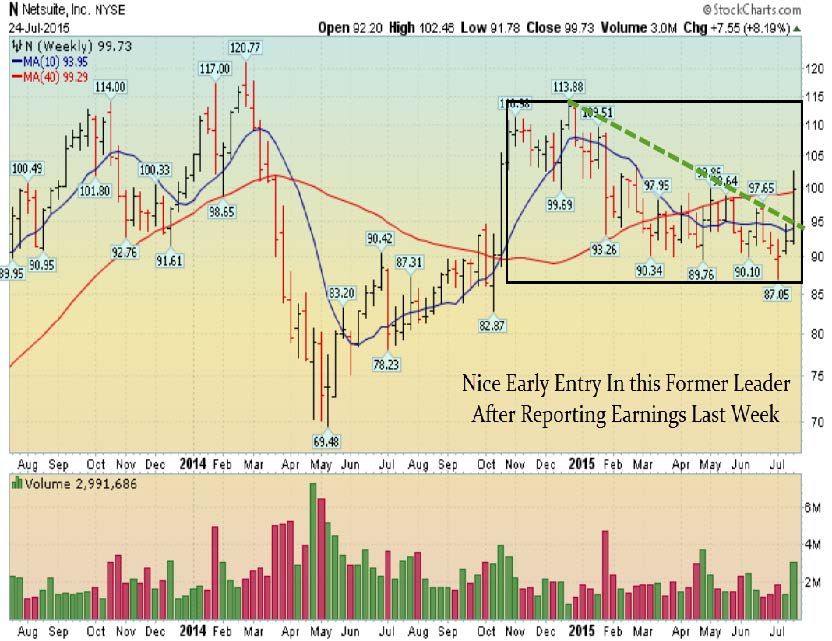
N Setup: Nice Early Entry After Reporting Earnings Last Week
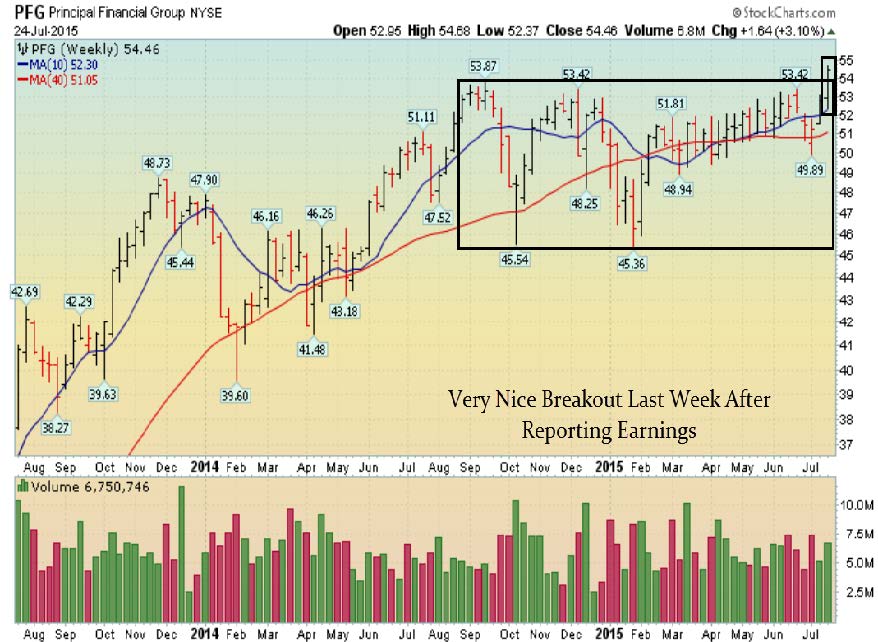
PFG Setup: Very Nice Breakout Last Week After Reporting Earnings
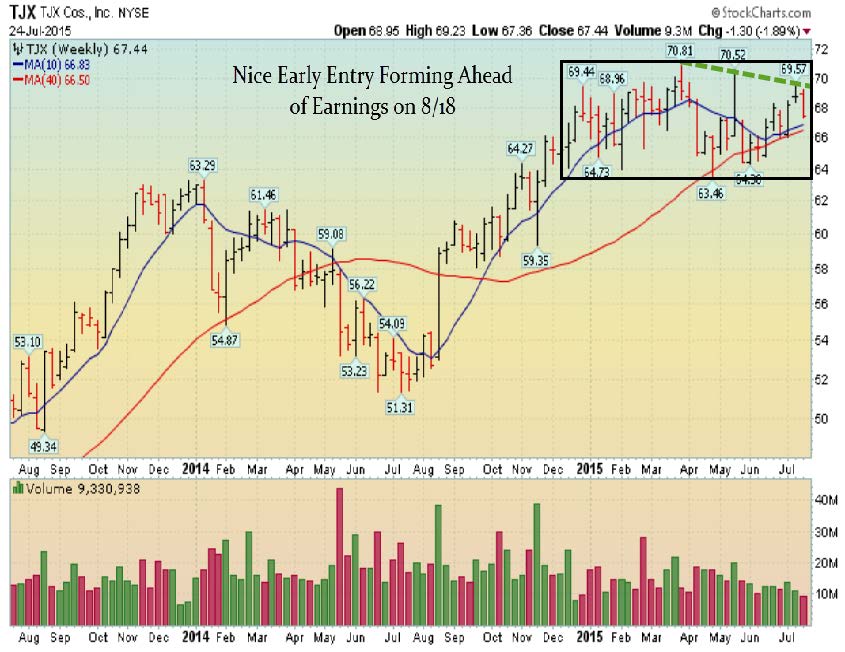
TJX Setup: Early Entry In New Flat Base Ahead of Earnings 8/18
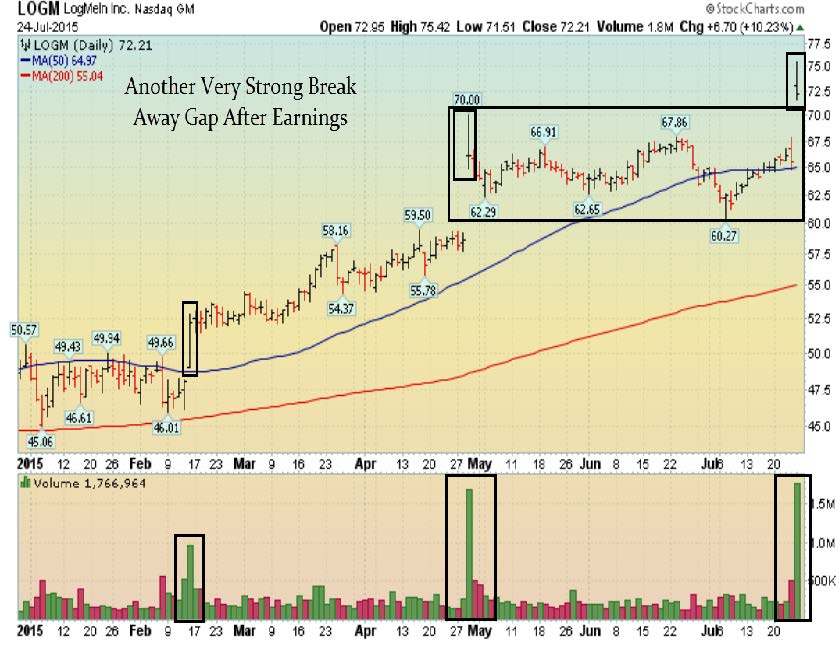
LOGM Setup: Another Very Strong Break-Away Gap After Earnings
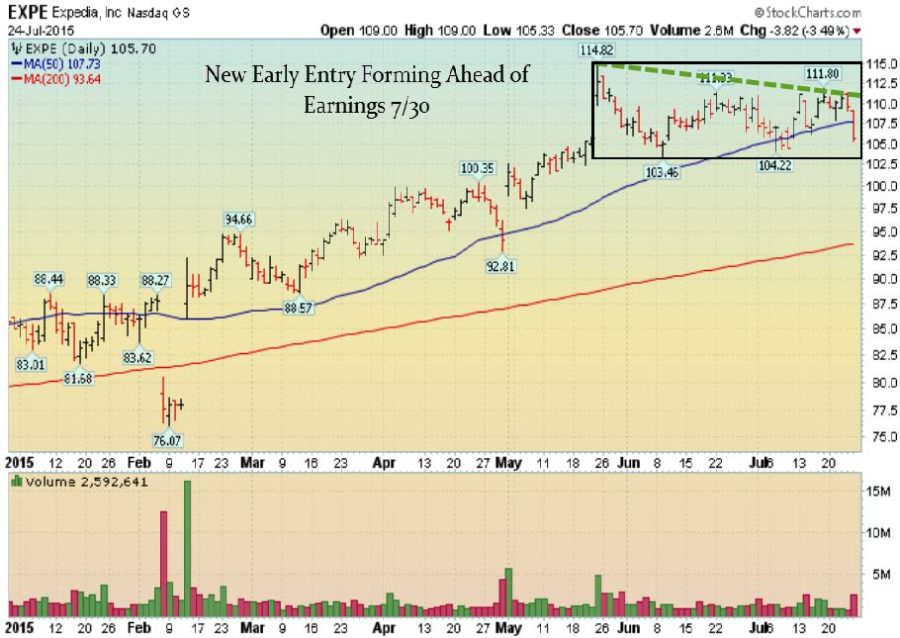
EXPE Setup: New Early Entry Forming Ahead of Earnings 7/30
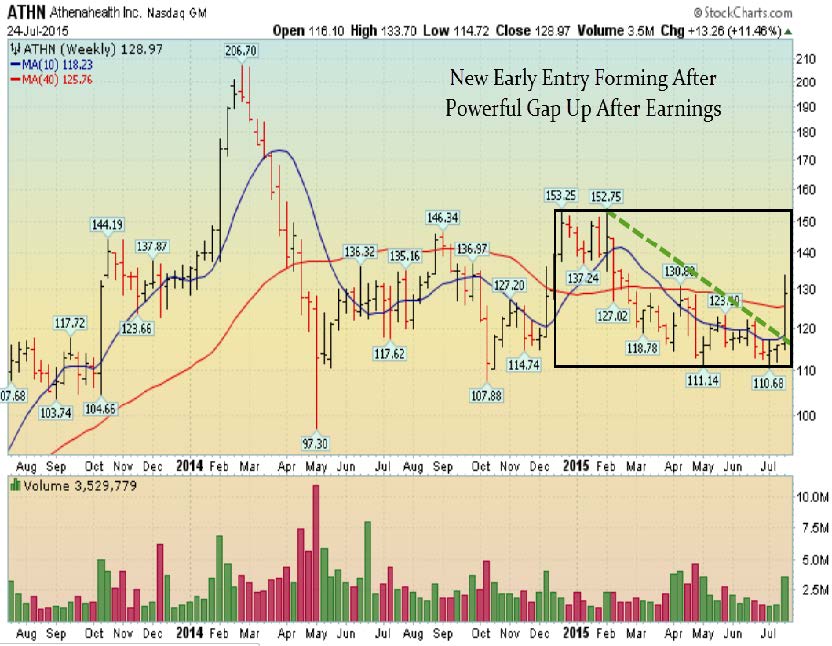
ATHN Setup: Powerful Gap Up After Earnings Last Week
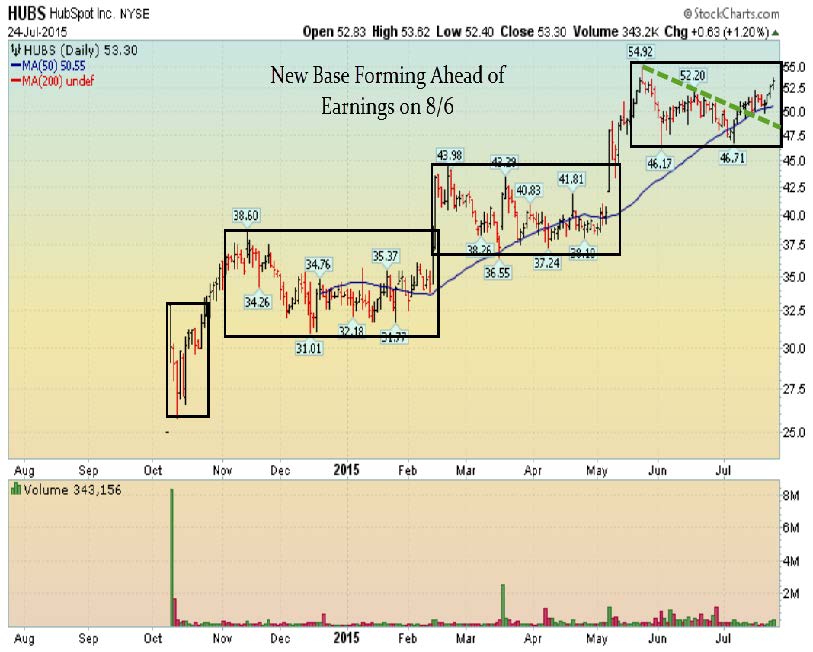
HUBS Setup: Nice Setup Ahead of Earnings 8/6
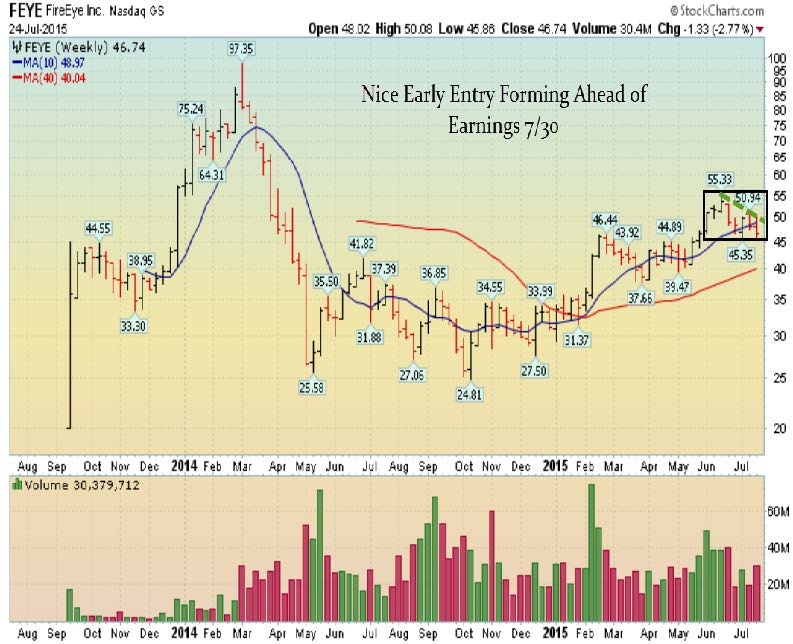
FEYE Setup: A New Early Entry Forming
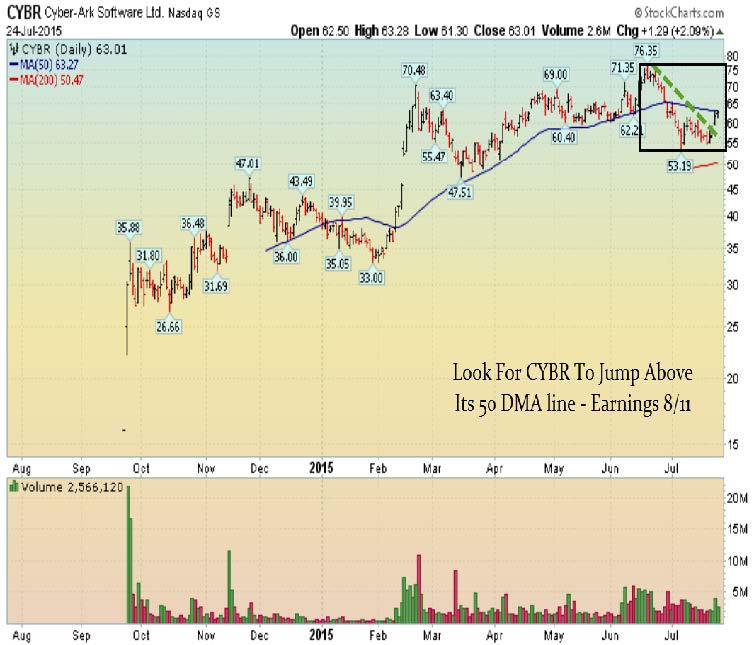
CYBR Setup – Nice Early Entry Last Week & Now Look For CYBR To Jump Back Above Its 50 DMA line – Earnings 8/11
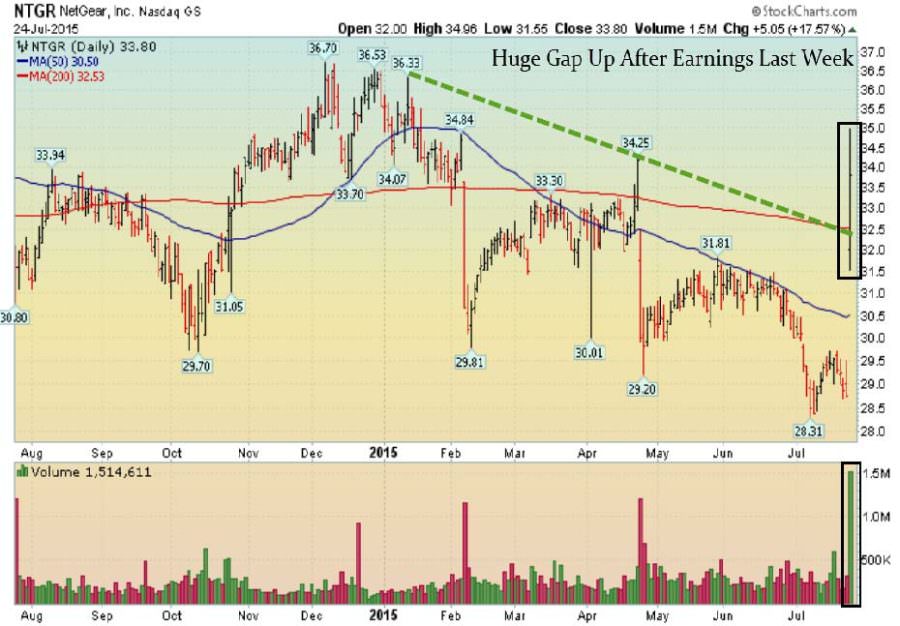
NTGR Setup – Huge Post Earnings Gap Last Week
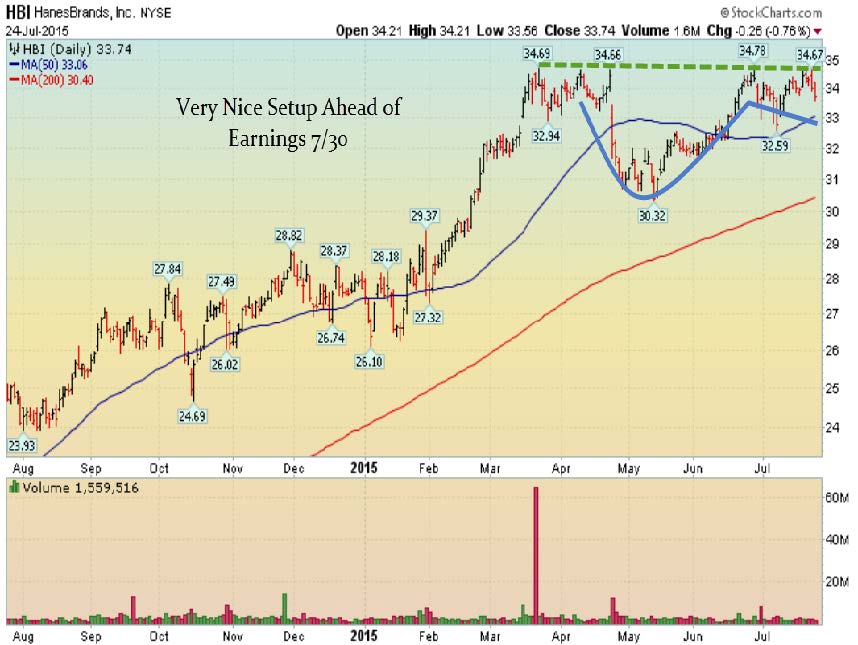
HBI Setup – New Early Entry Forming In Cup-with-Handle Base Ahead of Earnings on 7/30
[/su_spoiler]
[su_spoiler title=”Strongest Sectors, Groups, & Symbols” style=”fancy”]
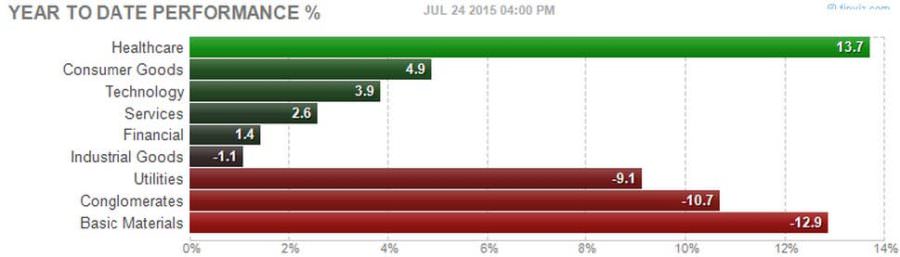
[su_heading style=”modern-1-dark” size=”18″]Strongest Sectors [/su_heading]
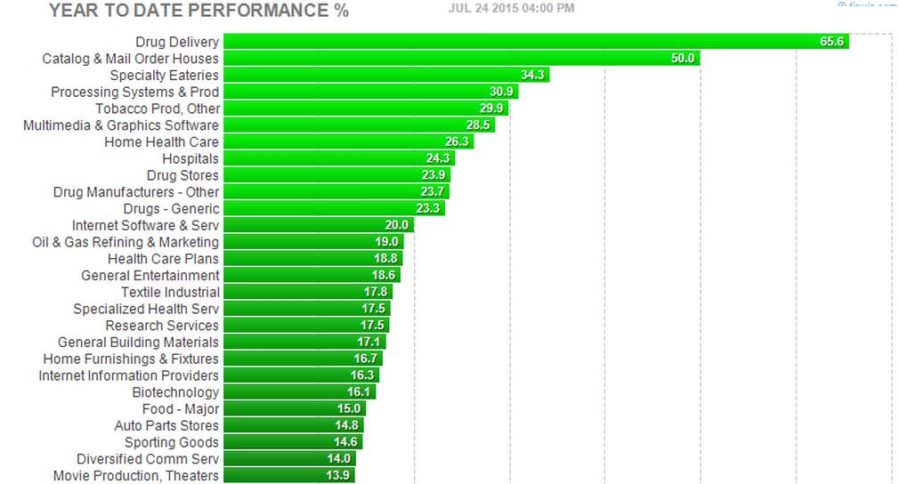
[su_heading style=”modern-1-dark” size=”18″]Strongest Groups [/su_heading]
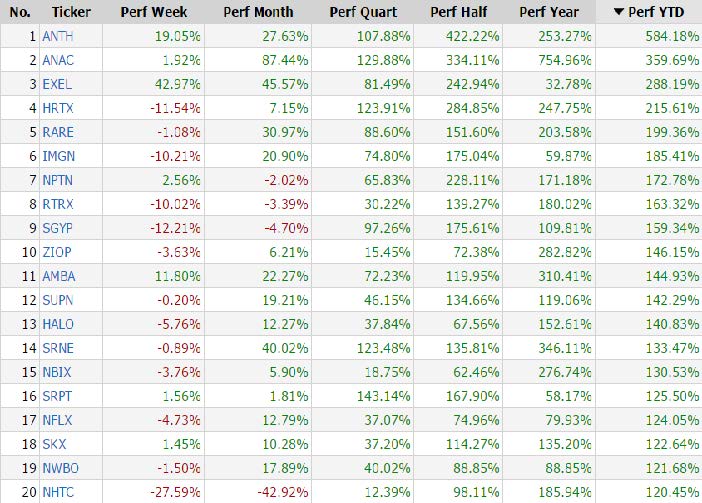
[su_heading style=”modern-1-dark” size=”18″]Strongest Performing Symbols This Year [/su_heading]
These are the top 20 strongest performing tickers on a year-to-date basis that are trading over $5, average daily volume over 500k and have a market cap >300M (Small cap-Mega Cap)
[/su_spoiler]


