

[image]
[su_spoiler title=”Monday-Wednesday’s Action: Bulls Defend 200 DMA” style=”fancy”]
Stocks fell hard on Monday dragged lower by a huge -8.5% decline in China’s Shanghai composite. A lot of technical damage occurred on Monday as the Dow Jones Industrial Average and the small-cap Russell 2000 index both sliced below their July 7, 2015 near term low which bodes poorly for the other averages. The benchmark S&P 500 closed just above its longer term 200 DMA line which is not ideal. The Nasdaq composite sliced below its 50 DMA. In more M&A news, Teva Pharmaceutical ($TEVA) said it will buy Allergan’s ($AGN) generic pharmaceuticals business for $40.5 billion. Separately, U.S. regulators slapped Fiat Chrysler with a record $105 million for lapses in safety recalls. This came one week after hackers said they can control Chrysler’s Jeep Cherokee. Economic data was light with durable goods rose 3.4%, beating 3.1% estimate. The Dallas Fed Manufacturing survey fell to -4.6%, vs a negative -7.0 in June. Stocks rallied on Tuesday after the bulls showed up and defended the 200 DMA line in the benchmark S&P 500 index. A slew of earnings and economic data was released. The PMI Services Flash index rose to 55.2, beating estimates for 54.8. The Richmond Fed Manufacturing index came in at 13, beating estimates for 7.5. On the downside: the Case-Shiller index fell -0.2%, missing estimates for +0.3% and consumer confidence slid to 90.9, missing the Street’s estimate for 99.6. That bodes poorly for the economy because nearly 2/3 of the economy is comprised of consumer spending. After Tuesday’s close, $TWTR and $YELP gapped down after reporting their latest quarterly results. Meanwhile, $PNRA and $BWLD both gapped up after releasing their numbers. Stocks rallied on Wednesday after the Fed concluded its two day meeting and held rates near zero. The Fed did not mention any changes to future rate hikes and remains “data-dependent.” Pending Homes sales fell sharply to -1.8%, missing estimates for a gain of 1%. A slew of earnings were announced and the big take away from earnings season (so far) is that social media stocks are getting sold ($TWTR, $FB, $LNKD, & $YELP) while restaurant stocks are being bought ($PNRA, $CMG, $BWLD, $CAKE, etc).
[/su_spoiler]
[su_spoiler title=”Thursday-Friday’s Action: Earnings Continue Coming Out In Droves” style=”fancy”]
Stocks were quiet on Thursday as investors digested a slew of earnings and economic data. Before the open, the government said U.S. GDP grew by +2.3% in Q2 2015, missing estimates for +2.6%. This directly contradicts the Fed’s narrative (that the economy will improve in the second half of the year and that will justify a rate hike). The problem the Fed faces is that the economy didn’t improve even with rates at zero! The employment cost index rose +0.2% in the second quarter which missed expectations and was the lowest level in the 33-year history of the report. The reading surprised the Street and basically eliminated the chance for the Fed to raise rates in September. Anything is possible with the Fed but so far, the ‘data” continues to disappoint. The Chicago PMI rose to 54.7, beating estimates for 50. Consumer sentiment softened to 93.1, missing estimates for 94.1.
[/su_spoiler]
[su_spoiler title=”Market Outlook: The Central Bank Put Is Alive And Well” style=”fancy”]
Remember, in bull markets surprises happen to the upside. This has been our primary thesis since the end of 2012. We would be remiss not to note that this very strong bull market is aging (celebrated its 6th anniversary in March 2015) and the last two major bull markets ended shortly after their 5th anniversary; 1994-2000 & 2002-Oct 2007). To be clear, the central bank put is very strong and until material damage occurs, the stock market deserves the longer-term bullish benefit of the doubt. As always, keep your losses small and never argue with the tape.
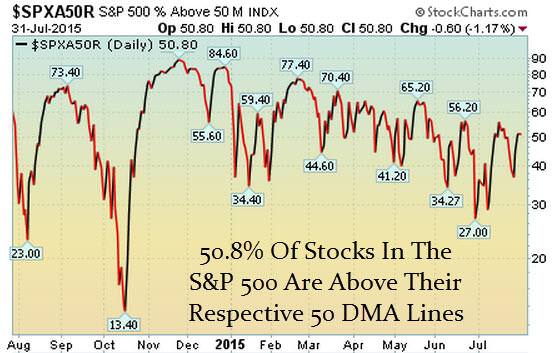
50.8% Of Stocks in the S&P 500 Are Above Their Respective 50 DMA
(Market Tends To Turn When This Reading Gets Above 70% or Below 40%)
Observation: Readings above 70% usually (not always) correspond with a short-term pullback
Conversely, reads below 40% usually (not always) correspond with a short-term bounce
[/su_spoiler]
[su_spoiler title=”FLS Conviction Leaders List” style=”fancy”]
- AAPL – Fell last week as it continues falling after latest quarterly report. 200 DMA is support
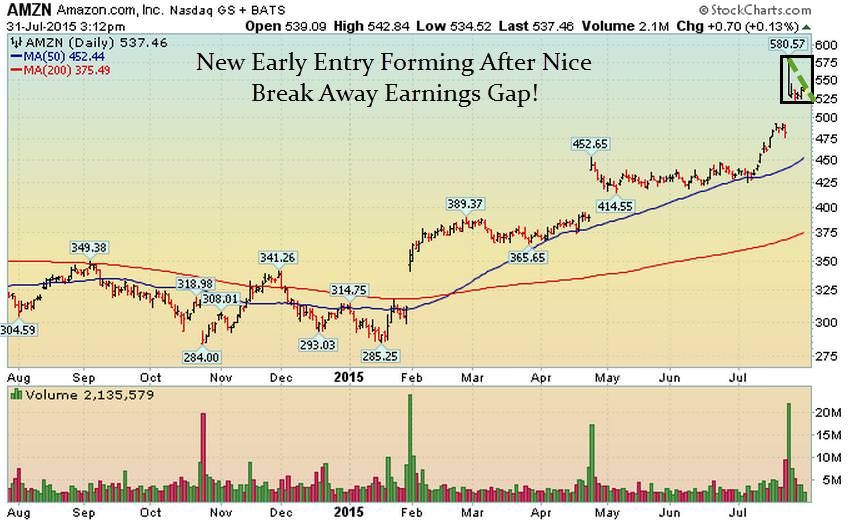
- AMZN – Rallied last week after huge break-away earnings gap in prior week.
- EA – Down for second straight week as healthy pullback continues into 50 DMA line
- FB – Fell after earnings but buyers showed up and still looks strong on closing basis (weekly chart)
- FLT – Snapped a 6 week losing streak and bulls defended 200 DMA
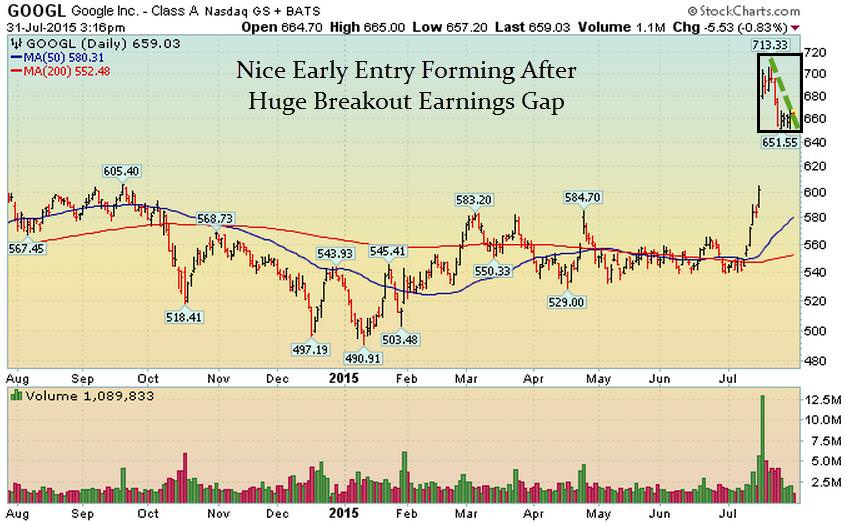
- GOOGL – Rallied last week as it continues consolidating huge breakaway earnings gap
- ILMN – Bulls trying to defend 50 DMA line after lackluster reaction to earnings
- NFLX – Perfect action last week after HUGE breakaway earnings gap two weeks earlier
- SBUX – Remains Extended. Very nice gap up after reporting earnings
- TSLA – Big positive reversal last week (weekly chart). 50 DMA line is support. Earnings 8/5
- UA – Extended – continued to rally after HUGE Breakaway earnings gap
- V – Extended – fourth consecutive weekly gain
[/su_spoiler]
[su_spoiler title=”15 Setups (This Week There Is A Heavy Focus on Winners From Earnings Season – So Far)” style=”fancy”]
These hand-picked stocks are carefully selected to help with your idea generation and offer you additional setups each week. The setups are based on our proprietary criteria and offer advanced (dotted line) & classic long and short entry points (solid line). Short patterns are typically mirror images of long patterns.
Note: Please Verify All Earnings Dates/Data from Multiple Sources for Every Stock in all our report(s).
Charts Courtesy of FreeStockCharts.com and/or Stockcharts.com
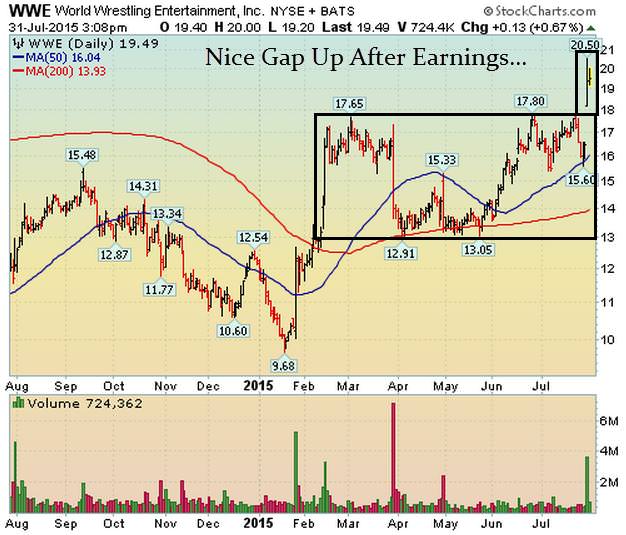
WWE Setup – Very Nice Earnings Gap Up!
AMZN Setup: New Early Entry Forming After Breakaway Earnings Gap
GOOGL Setup: Nice Early Entry Forming After Bullish Breakaway Earnings Gap
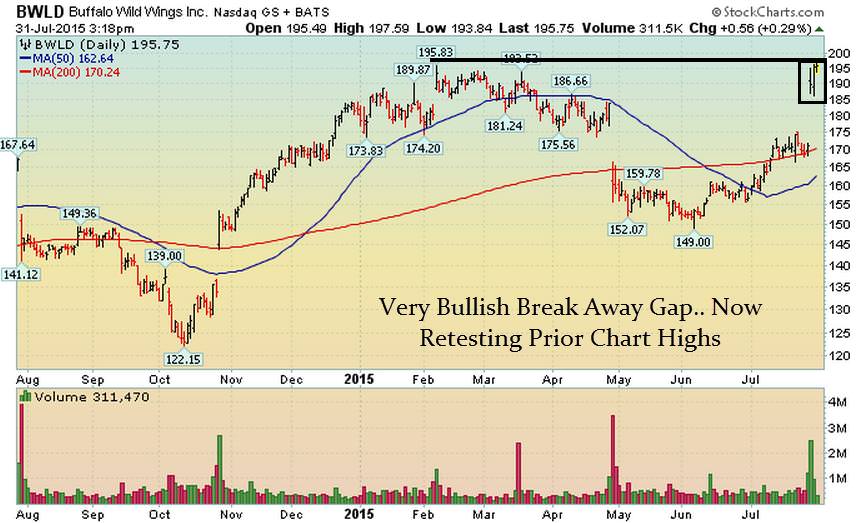
BWLD Setup: Flirting With Prior Chart Highs After Powerful Breakaway Gap
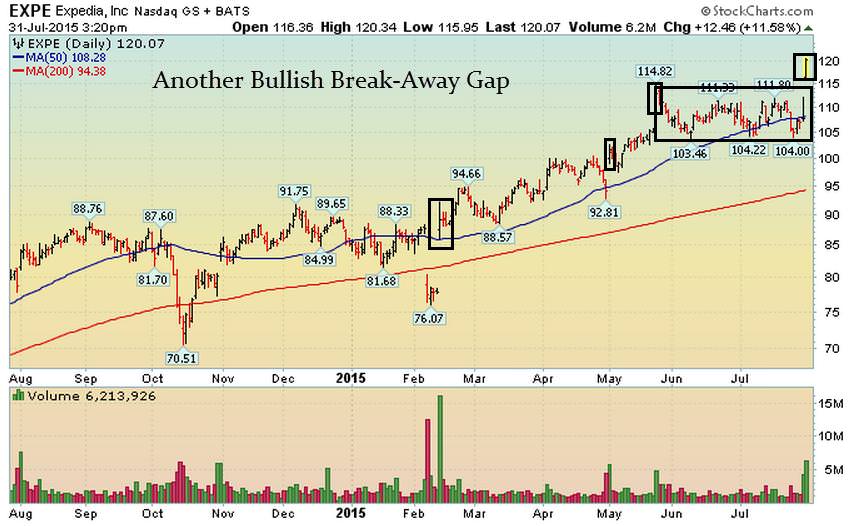
EXPE Setup: Big Institutions Are Aggressively Accumulating EXPE
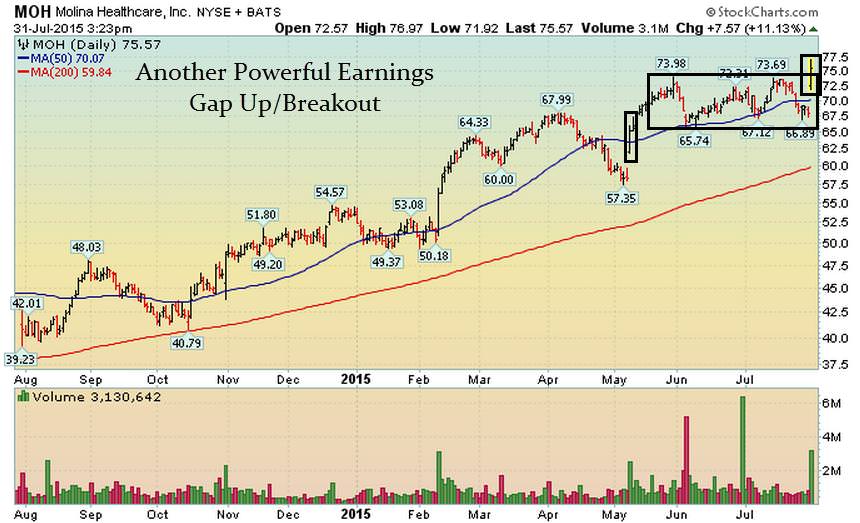
MOH Setup: Very Nice Breakout Last Week After Reporting Earnings
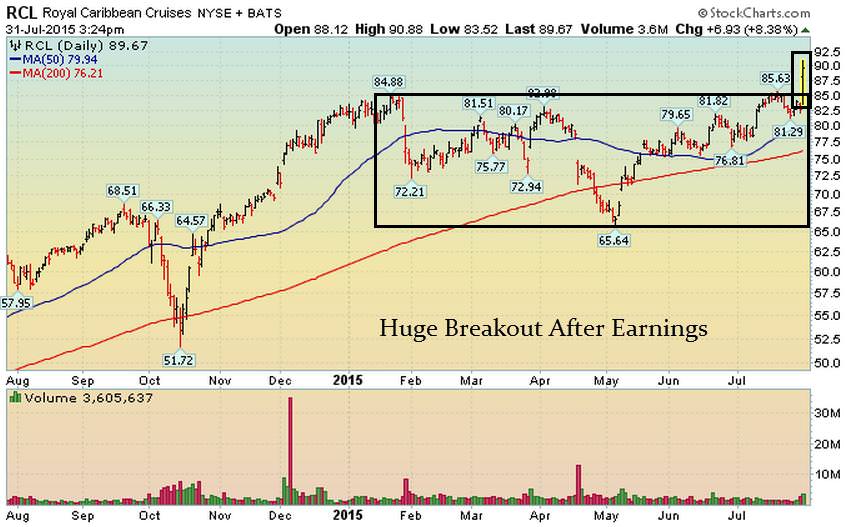
RCL Setup: Powerful Breakout After Earnings
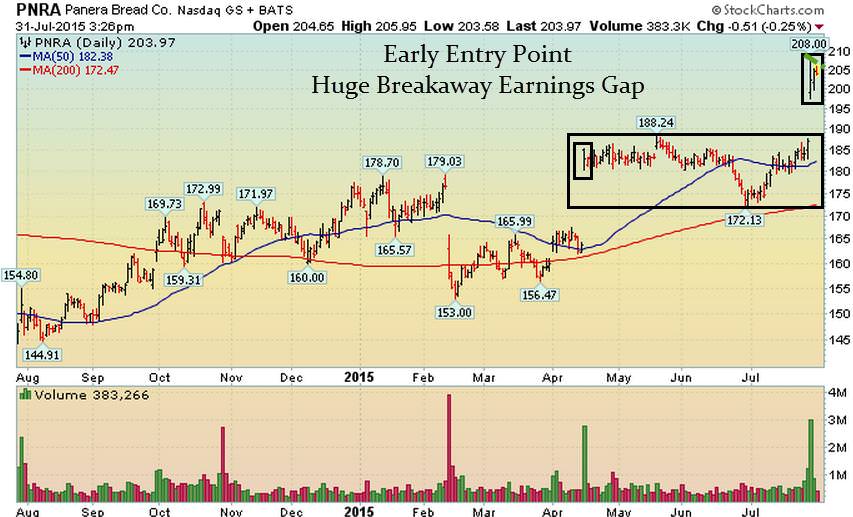
PNRA Setup: Another Very Strong Break-Away Gap After Earnings
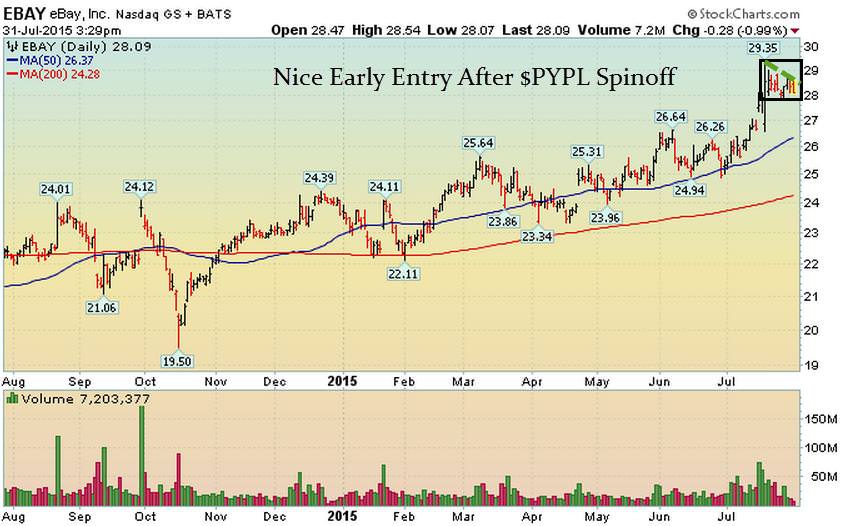
eBAY Setup: New Early Entry Forming After $PYPL Spinoff
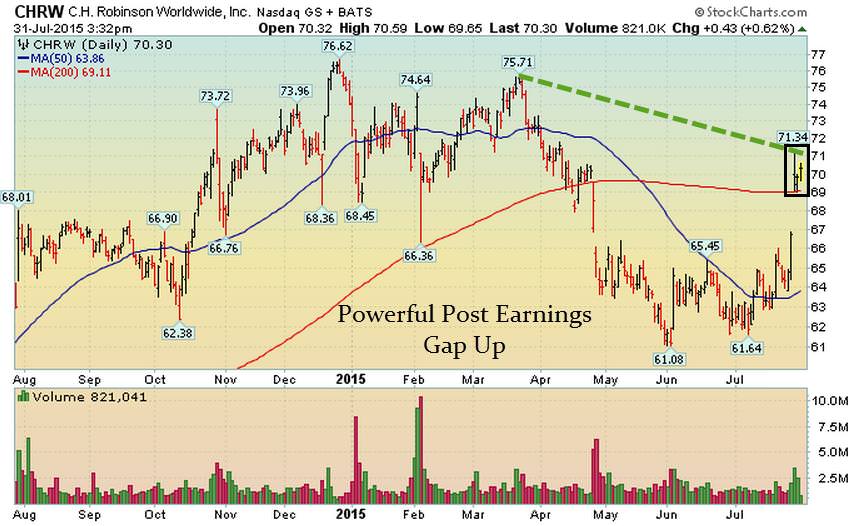
CHRW Setup: Powerful Gap Up After Earnings
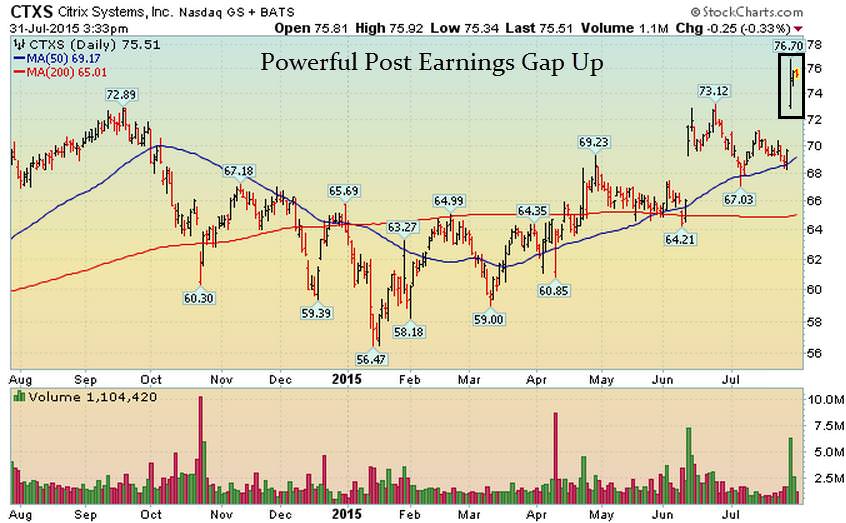
CTXS Setup: Powerful Post Earnings Gap Up
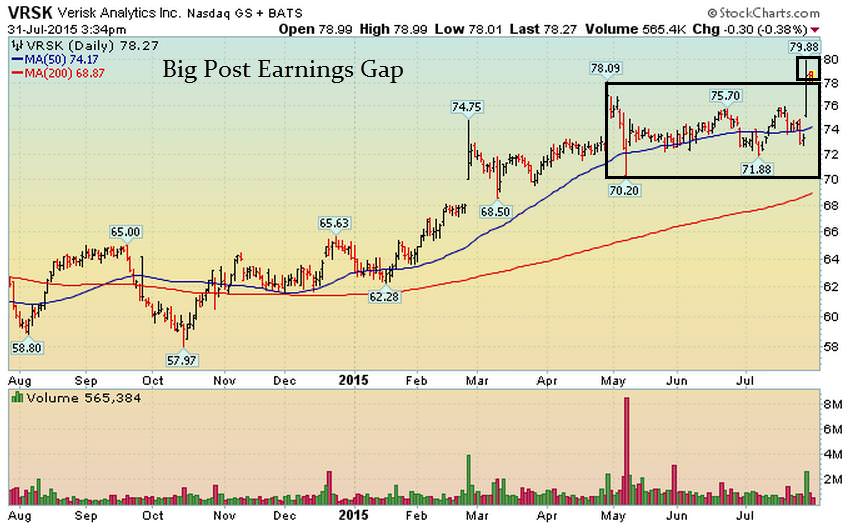
VRSK Setup: Huge Post Earnings Gap Up
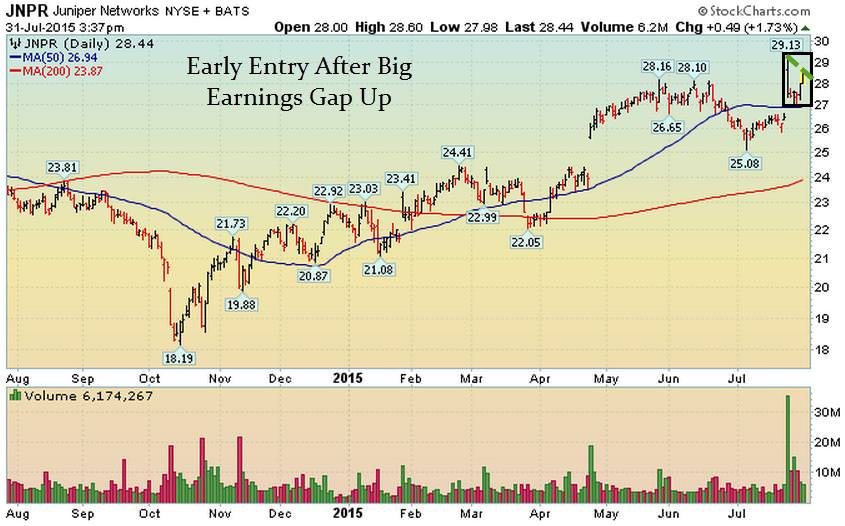
JNPR Setup – New Early Entry After Post Earnings Gap
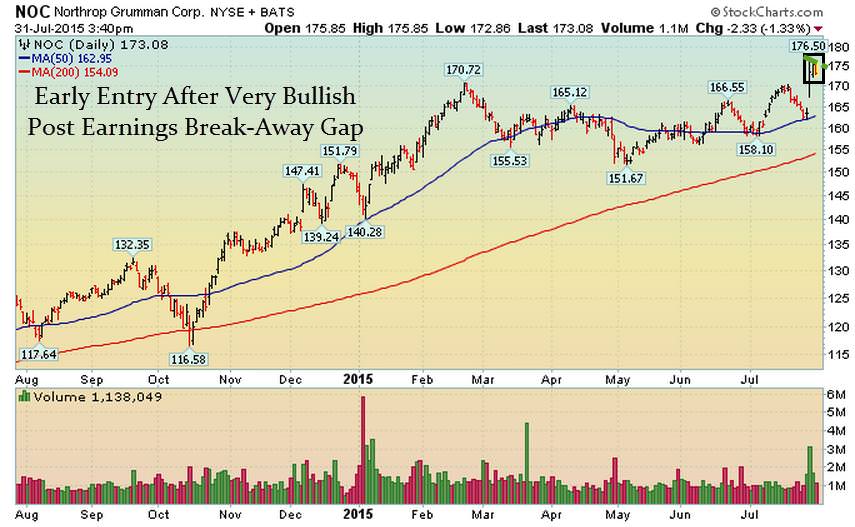
NOC Setup – Early Entry Forming After Post Earnings Gap
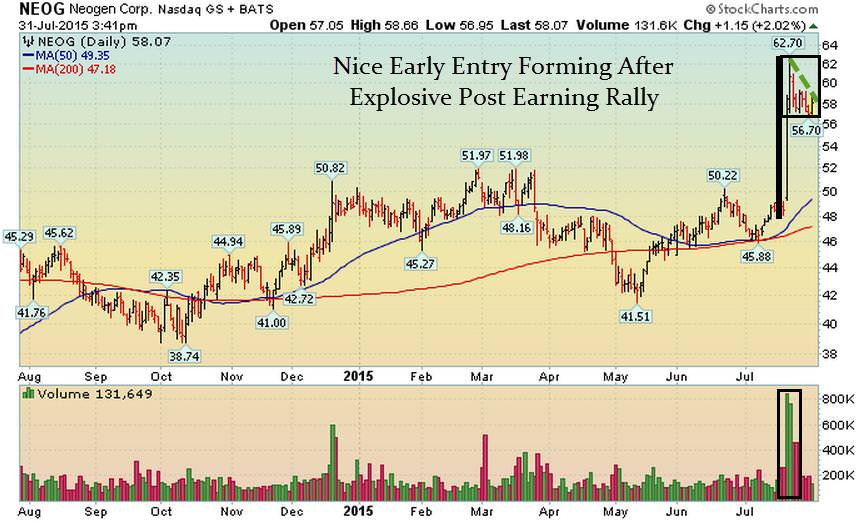
NEOG Setup – New Early Entry Forming After Very Strong Post Earnings Rally
 [/su_spoiler]
[su_spoiler title=”Strongest Sectors, Groups, & Symbols” style=”fancy”]
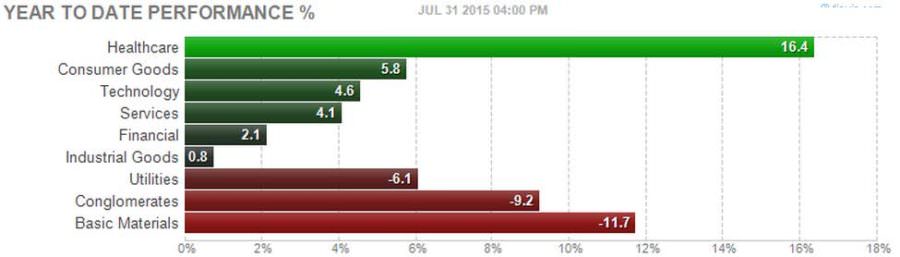
[su_heading style=”modern-1-dark” size=”18″]Strongest Sectors [/su_heading]
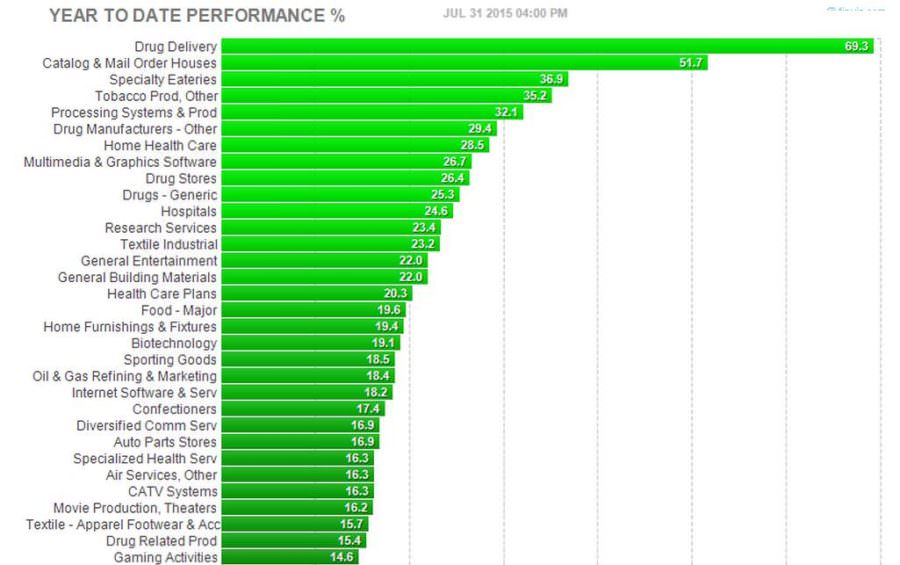
[su_heading style=”modern-1-dark” size=”18″]Strongest Groups [/su_heading]
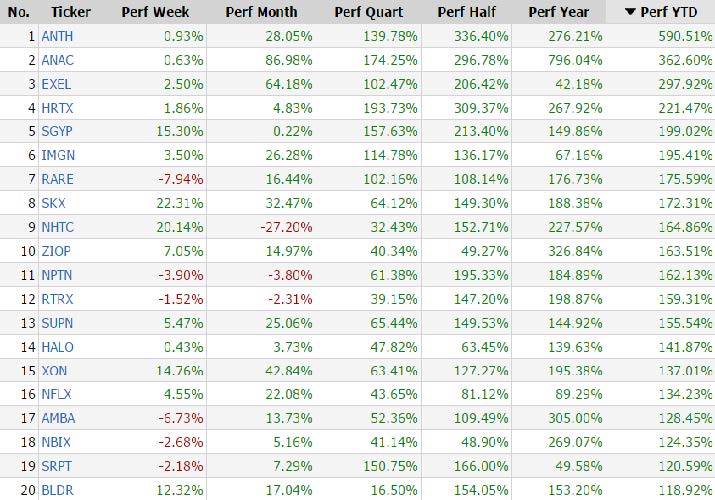
[su_heading style=”modern-1-dark” size=”18″]Strongest Stocks of the Year [/su_heading]
These are the top 20 strongest performing tickers on a year-to-date basis that are trading over $5, average daily volume over 500k and have a market cap >300M (Small cap-Mega Cap)
[/su_spoiler]


