

[su_spoiler title=”Monday-Wednesday’s Action: China Devalues Currency” style=”fancy”]
Stocks soared on Monday after more overseas news helped lift stocks. China’s Shanghai Composite jumped nearly 5% after below-consensus trade data from China was viewed as an argument in favor of more easy money. European stocks rallied on the news amid reports suggesting Greek officials and Eurozone negotiators are nearing a final agreement on a third bailout package for Greece. Precision Castparts ($PCP) surged after the company agreed to be acquired by Berkshire Hathaway ($BRKA) for $235/share. The Dow plunged 213 points on Tuesday after China devalued their currency (yuan) in the latest effort to simulate their economy. Oil prices and a slew of other demand-sensitive commodities plunged on the news. Shares of Google ($GOOG) jumped $27 after the company announced plans for a new operating structure. Google will create a new company called Alphabet, which will replace Google as a publicly-traded entity and should make it easier to evaluate different segments of the company’s business. The NFIB small business optimism index rose to 95.4, beating estimates for 95. Nonfarm productivity rose to 1.3%, missing estimates for 1.6%. Wednesday was a major support day for the market. The major indices opened lower but closed near their highs after China devalued their currency for a second consecutive day. Wednesday was a pivotal day as it signaled a “washout” low for the major indices. In the US, The Atlanta Fed Business Inflation Expectations rose 1.8%, missing estimates for 2% which signals deflation remains more of a threat than inflation.
[/su_spoiler]
[su_spoiler title=”Thursday-Friday’s Action: Stocks Turn Higher” style=”fancy”]
Stocks were relatively quiet on Thursday and Friday as the major indices turned higher for the week and paused to digest Wednesday’s strong rally off the lows. China’s central bank tried to calm investor fears during overnight action by holding a press conference and said the yuan adjustment “is almost complete” and called the rumors of a 10.0% devaluation “nonsense.” One thing we have learned from studying how government’s act is that their actions are worth more than their words. Weekly jobless claims rose to 274k, missing estimates for 270k. A separate report showed that retail sales rose 0.6%, beating estimates for 0.5%. Stocks were quiet on Friday as investors digested the latest round of economic and earnings data and continued to look for signs of what the Fed’s next move will be.
[/su_spoiler]
[su_spoiler title=”Market Outlook: A Major Top?” style=”fancy”]
Market Outlook: A Major Top?
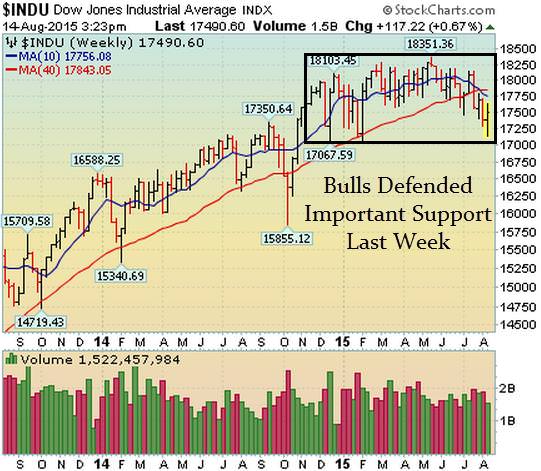
Remember, in bull markets surprises happen to the upside. This has been our primary thesis since the end of 2012. We would be remiss not to note that this very strong bull market is aging (celebrated its 6th anniversary in March 2015) and the last two major bull markets ended shortly after their 5th anniversary; 1994-2000 & 2002-Oct 2007). To be clear, the central bank put is the primary driver of this entire 6.5 year bull market and when that ends, we want you to be ready. Until then, the market deserves the longer-term bullish benefit of the doubt.
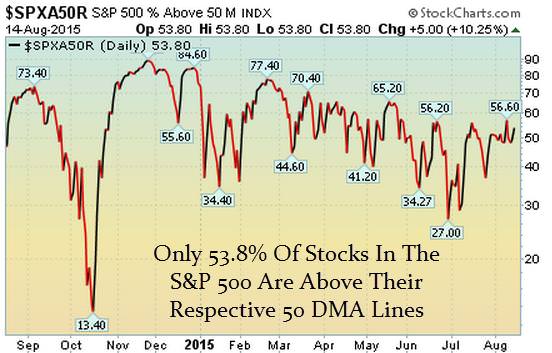
53.8% Of Stocks in the S&P 500 Are Above Their Respective 50 DMA
(Market Tends To Turn When This Reading Gets Above 70% or Below 40%)
Observation: Readings above 70% usually (not always) correspond with a short term pullback
Conversely, reads below 40% usually (not always) correspond with a short term bounce
[/su_spoiler]
[su_spoiler title=”FLS Conviction Leaders List” style=”fancy”]
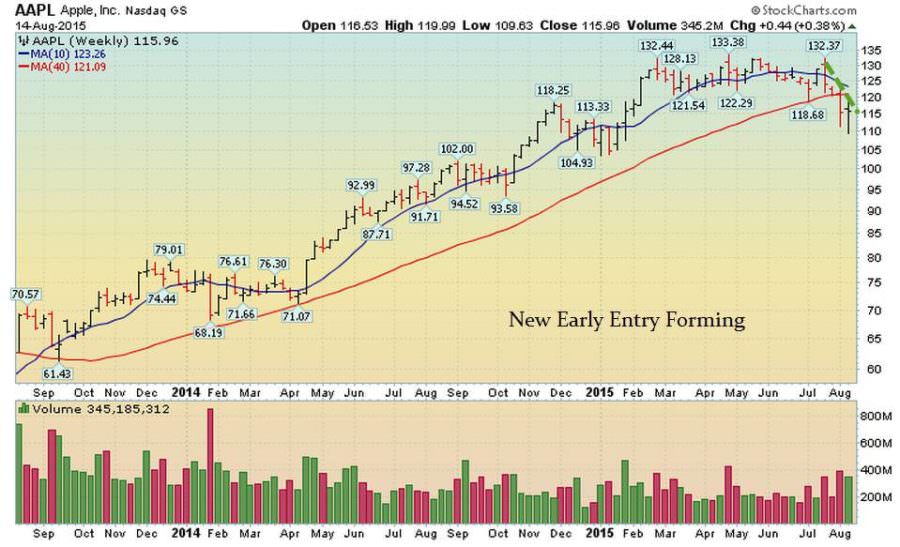
- AAPL – Rallied last week and snapped a steep 3 week losing streak. Still below 200 DMA
- AMZN – Rallied last week as it forms a bullish “handle” after explosive earnings gap
- EA – Fell last week. 3rd down week in past 4. Still “Basing” above 50 DMA line
- FB – Bullish action continues as it pulls into its 10 week moving average line (~50DMA on wkly chart)
- FLT – Very strong action and setting up to breakout
- GOOG – Big gap up last week after alphabet restructuring news
- NFLX – Very bullish action continues. Forming bullish 2 weeks tight pattern on weekly chart
- SBUX – Bulls showed up and defended 50 DMA line last week. Healthy action
- TSLA – Bounced last week after bulls defended longer term 200 DMA line
- UA – Another up week. 5th out of past 6 weeks are up. Very healthy action
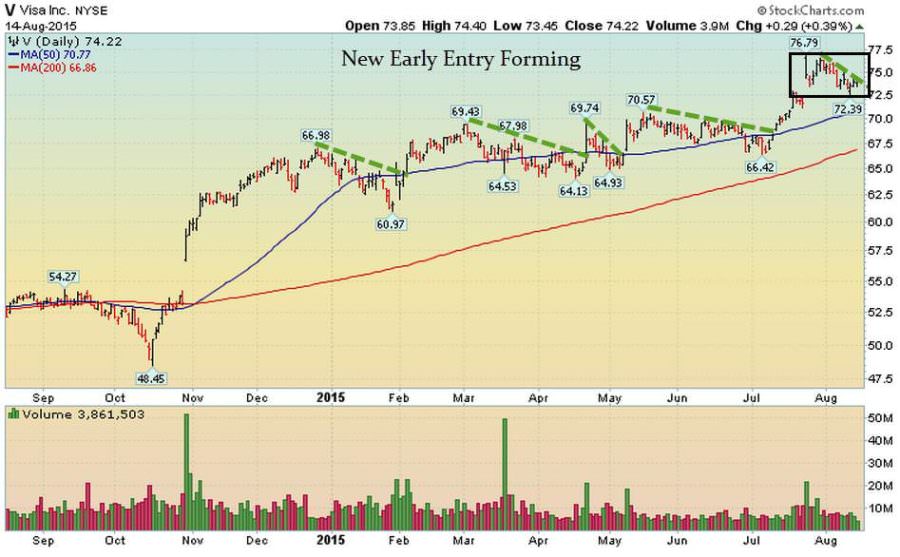
- V – Forming bullish handle as it consolidates recent gain
[/su_spoiler]
[su_spoiler title=”16 Setups” style=”fancy”]
These hand-picked stocks are carefully selected to help with your idea generation and offer you additional setups each week. The setups are based on our proprietary criteria and offer advanced (dotted line) & classic long and short entry points (solid line). Short patterns are typically mirror images of long patterns.
Note: Please Verify All Earnings Dates/Data from Multiple Sources for Every Stock in all our report(s).
Charts Courtesy of FreeStockCharts.com and/or Stockcharts.com
V Working Order & Setup – Nice Early Entry Forming
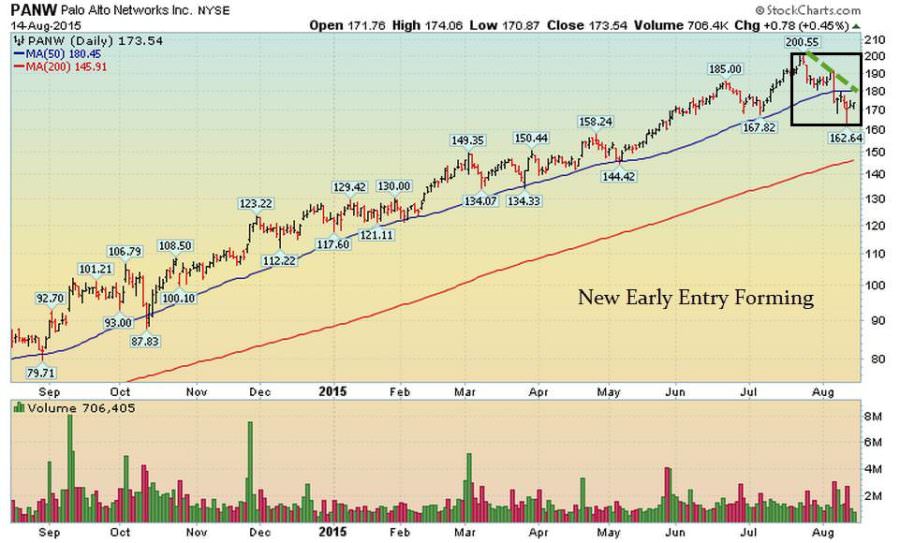
PANW Working Order & Setup: New Early Entry Forming
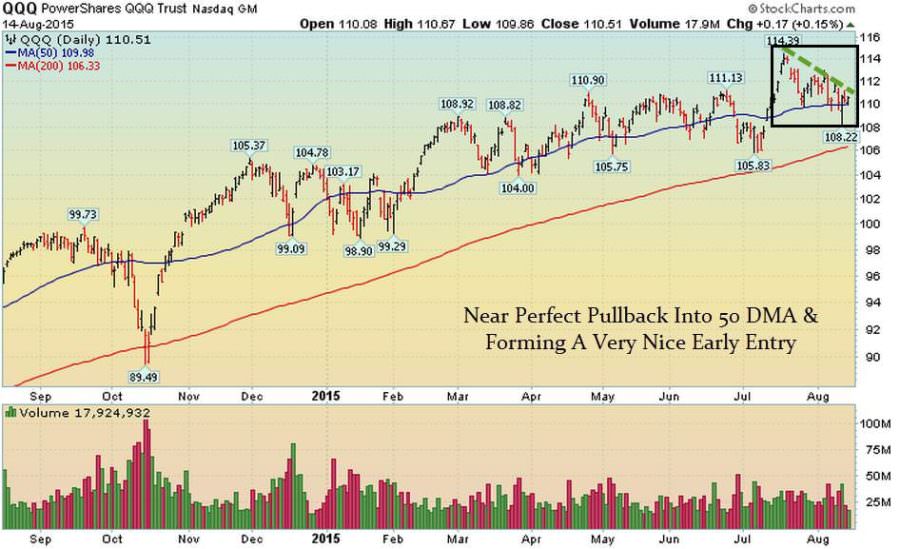
QQQ Working Order & Setup: New Early Entry Forming
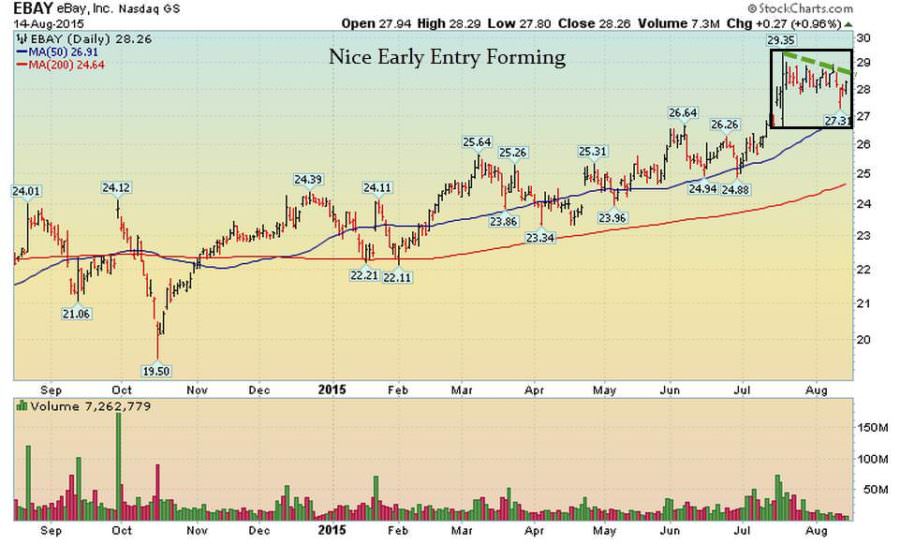
EBAY: New Early Entry Forming
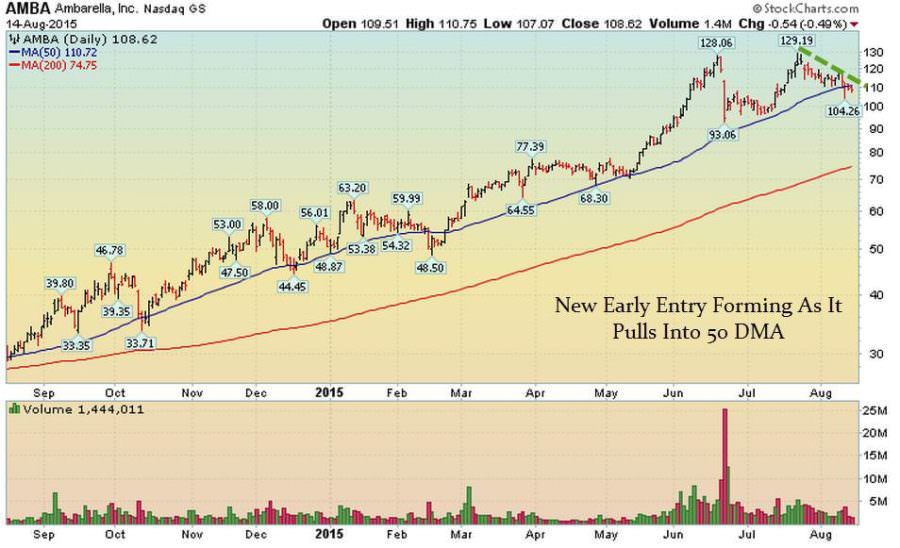
AMBA Setup: Early Entry Forming
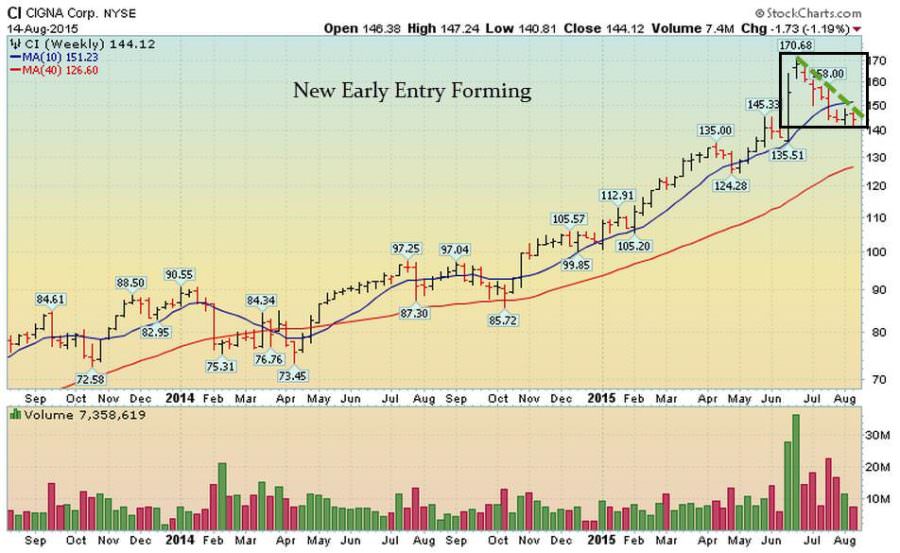
CI Setup: New Early Entry Forming
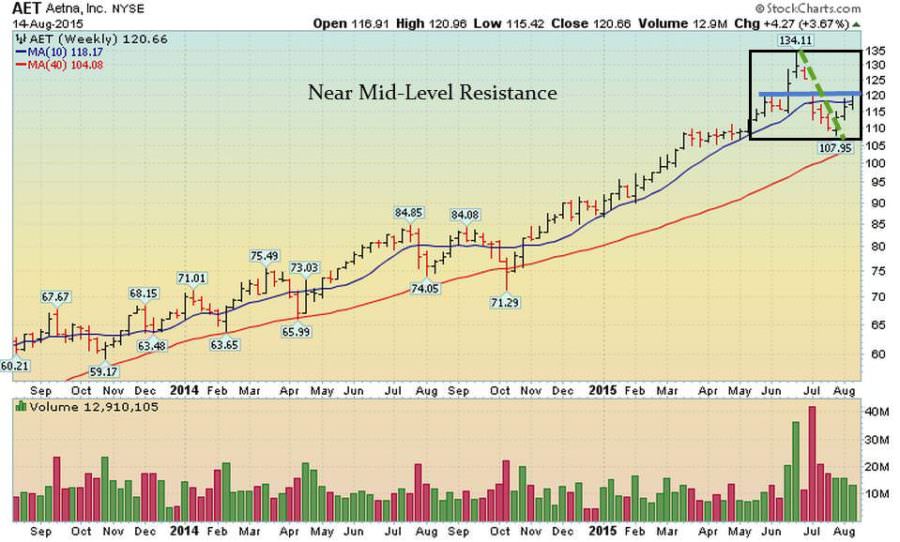
AET Setup: Near Mid-Level Resistance
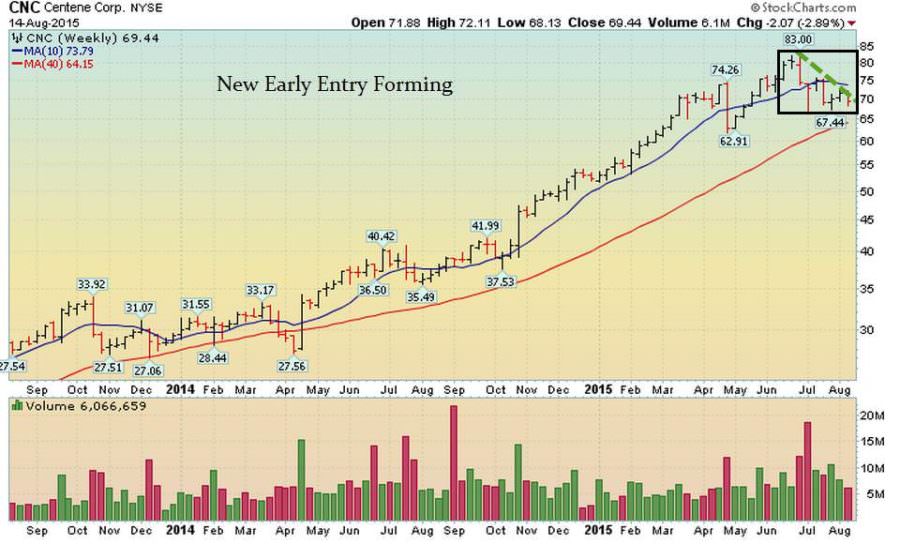
CNC Setup: Early Entry Forming
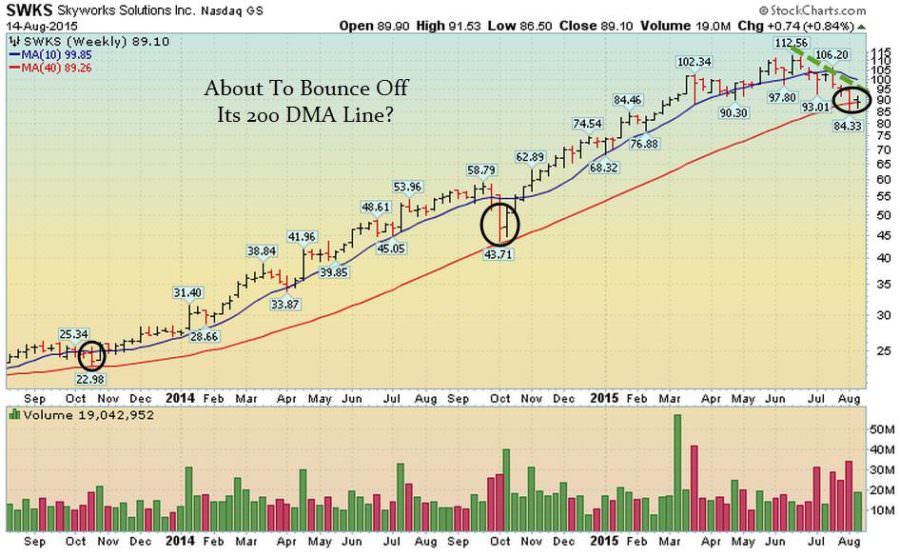
SWKS Setup: New Early Entry Forming As It “TESTS” Its Longer Term 200 DMA Line
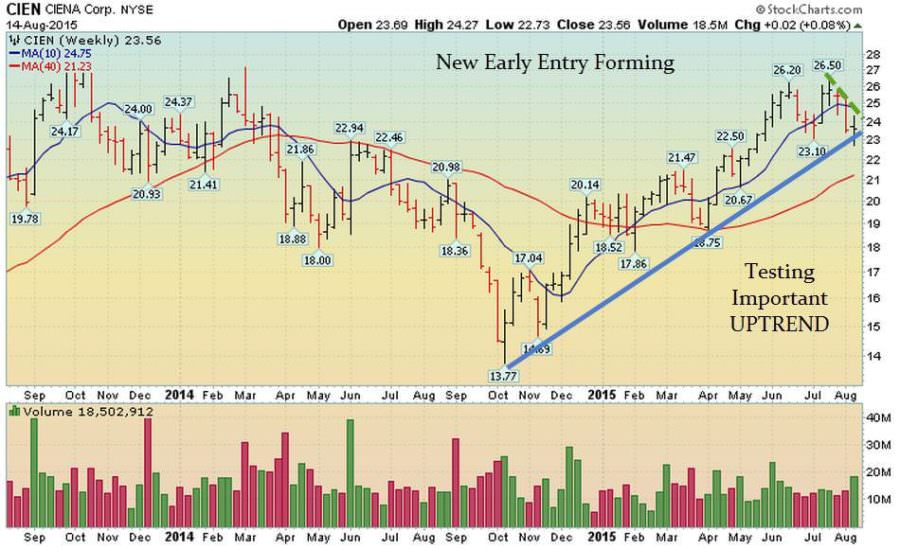
CIEN Setup: New Early Entry Forming As It “Tests” Longer Term Uptrend
AAPL Setup: New Early Entry Forming
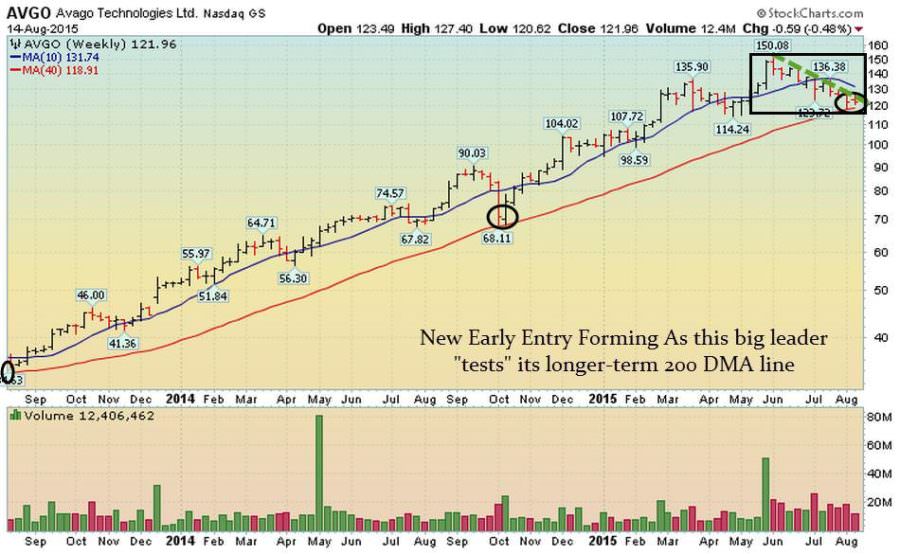
AVGO Setup: New Early Entry Forming As It Tests Its 200 DMA Line
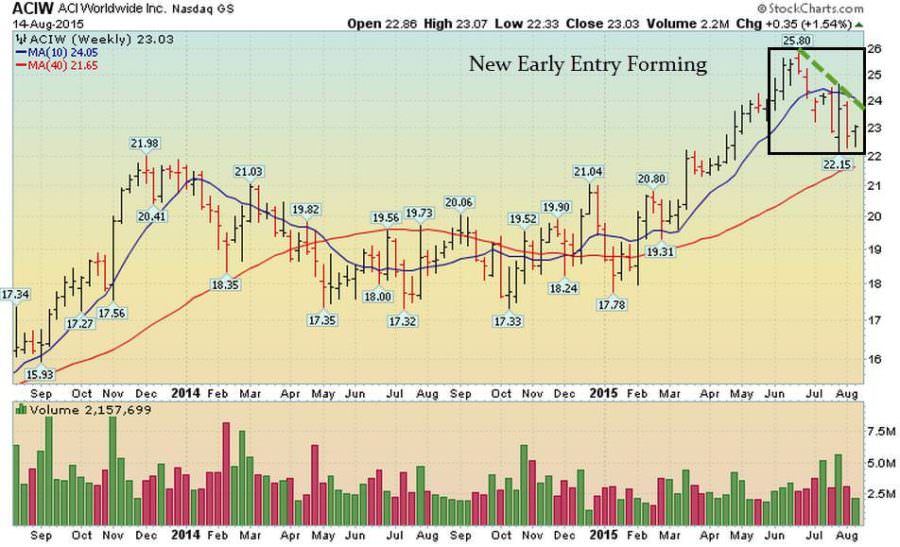
ACIW Setup: New Early Entry Forming
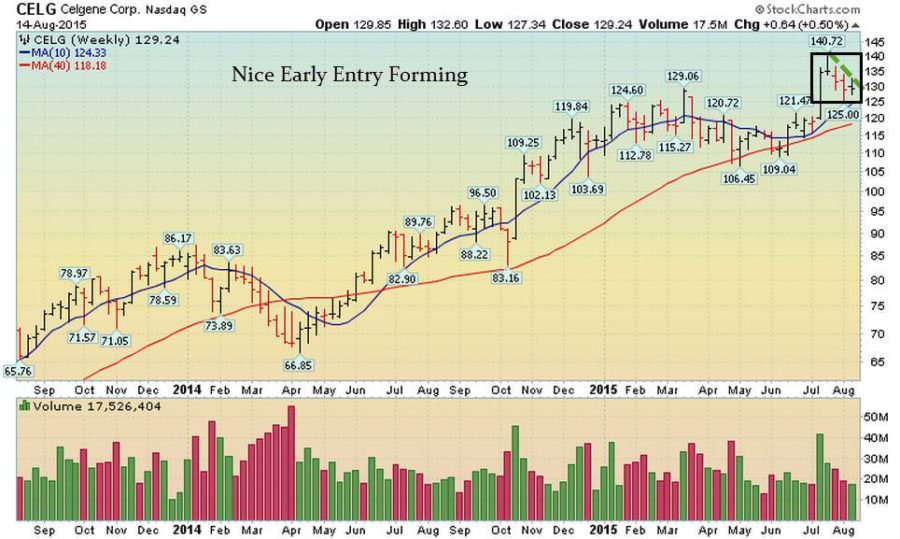
CELG Setup – New Early Entry Forming
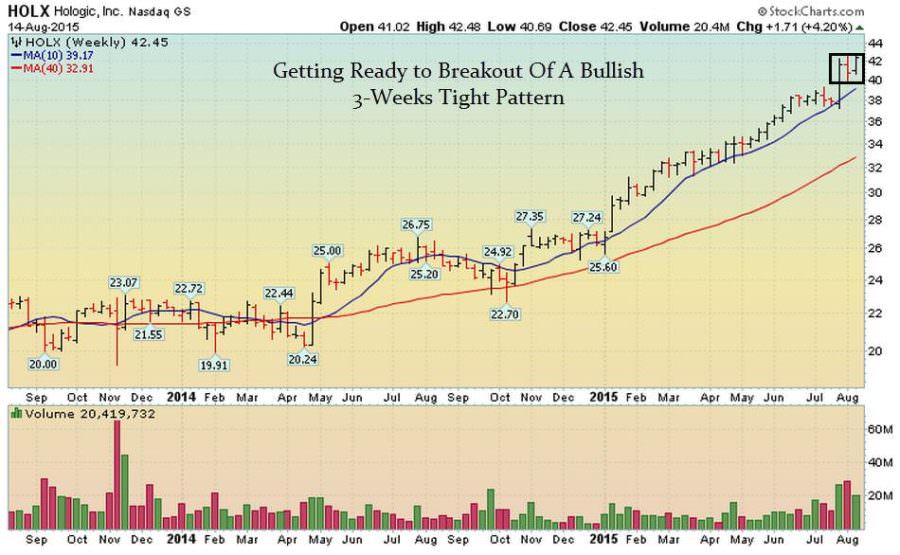
HOLX Setup – Getting Ready To Breakout Of A 3-Weeks Tight Pattern
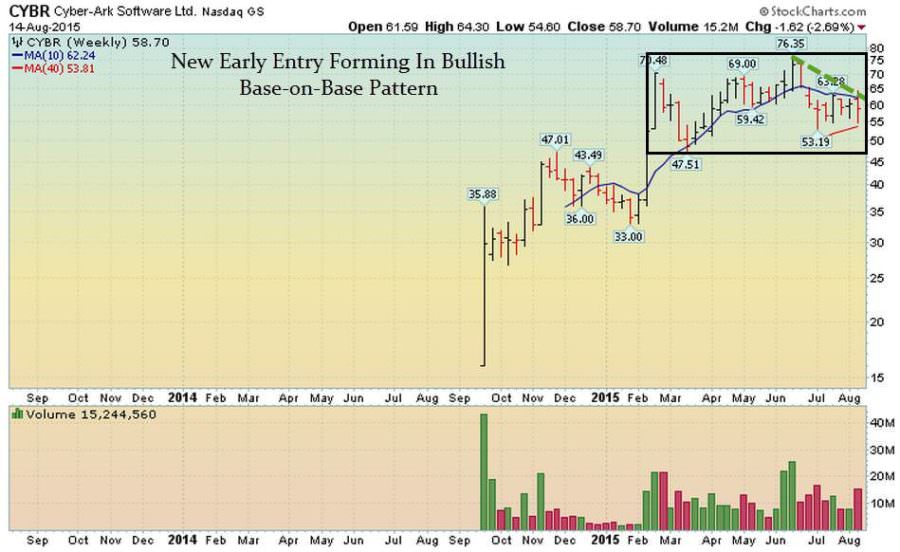
CYBR Setup – New Early Entry Forming In Bullish Base-on-Base Pattern
[/su_spoiler]
[su_spoiler title=”Strongest Sectors, Groups, & Symbols” style=”fancy”]
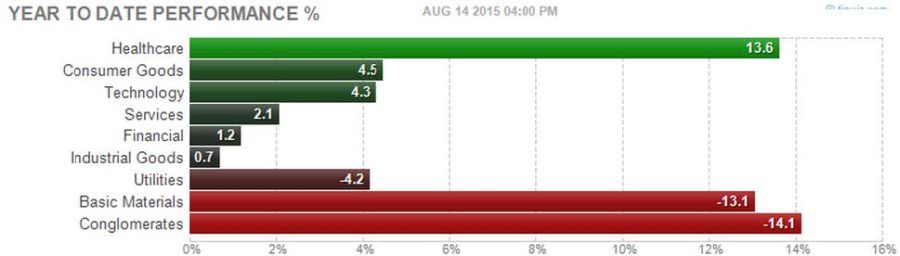
[su_heading style=”modern-1-dark” size=”18″]Strongest Sectors [/su_heading]
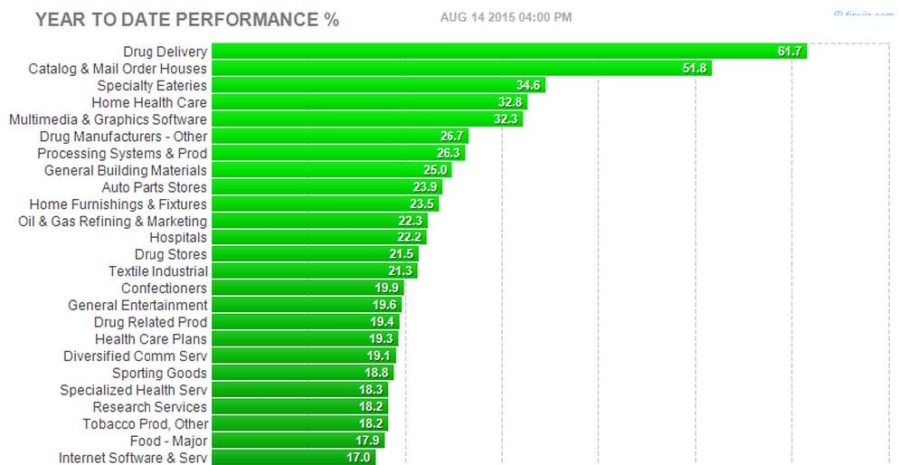
[su_heading style=”modern-1-dark” size=”18″]Strongest Groups [/su_heading]
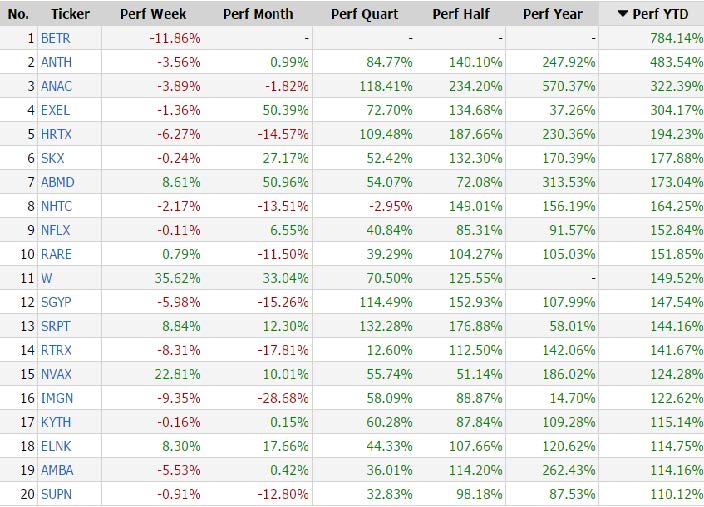
[su_heading style=”modern-1-dark” size=”18″]Strongest Stocks Of The Year [/su_heading]
These are the top 20 strongest performing tickers on a year-to-date basis that are trading over $5, average daily volume over 500k and have a market cap >300M (Small cap-Mega Cap)
[/su_spoiler]


