

[su_spoiler title=”Monday-Wednesday’s Action: Buyers Bought The Dip” style=”fancy”]
Stocks fell on Monday after Greece failed to reach a deal over the weekend. We would be remiss not to note that European stock markets fell but the euro rallied on Monday. The European Central Bank President Mario Draghi allayed concerns when he said the ECB would continue approving emergency funding for Greek banks – providing they have enough cash and collateral to operate. He added “the ball lies squarely in the camp of the Greek government to take the necessary steps.” The Empire manufacturing index fell 3.09 in May to a negative -1.98 in June, hitting the lowest level since January 2013. Industrial production unexpectedly fell -0.2% in May and missed estimates for a gain of 0.2%. The National Association of Home Builders (NAHB) housing market index rose to 59, beating estimates for 56. It was the highest reading since last September as buyers rush to lock in low mortgage rates.
Stocks rallied nicely on Tuesday as Greece remained in the headline and the Fed began its two day meeting. May housing starts fell by -11.1% to 1.036M, missing expectations for 1.090M. Meanwhile, building permits rose +11.8% month-over-month. Stocks rallied on Wednesday after the Fed held rates steady and downgraded GDP growth to under 2% for 2015. Janet Yellen held a press conference and outlined the FOMC’s thoughts. On average she remains cautiously optimistic and remains “data-dependent.” So in essence, Yellen came out with the perfect hedge. She said, the FOCM stands ready to raise rates if the data improves and will continue to “monitor the developments carefully” – which means they are ready to keep rates at zero or print more money if the data doesn’t improve. Yellen also said to focus on path of rate hikes, not the first one. Separately, the ongoing back-and-fourth continued with Greece. The weekly MBA Mortgage Index, fell to negative -5.5% to follow last week’s +8.4% increase.
[/su_spoiler]
[su_spoiler title=”Thursday-Friday’s Action: Fed Keeps Rates At Zero” style=”fancy”]
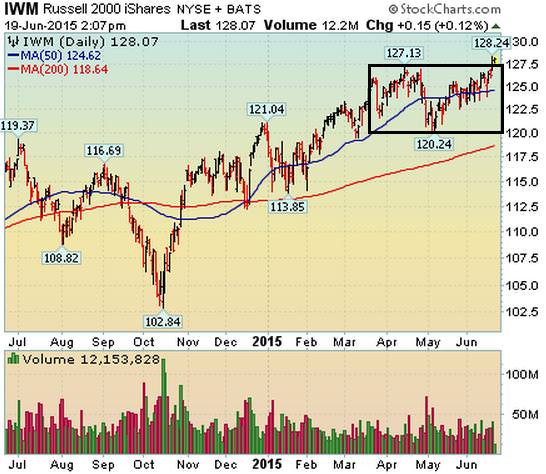
Stocks soared on Thursday as investors breathed a sigh of relief that the Fed remained dovish. The Biotech ETF ($IBB) broke out to a fresh high and the Nasdaq composite and small-cap Russell 2000 index also broke out and hit new highs. The consumer price index rose 0.4%, missing estimates for a 0.5% gain. Even though it missed estimates it was the largest jump since Feb 2013. Core prices which exclude food and energy rose 0.1%, missing estimates for 0.2%. The current account deficit for Q1 2015 totaled $113.30 billion which was just below the Street’s estimate for $116.70 billion. Leading Indicators ticked up 0.7%, beating estimates for a +0.4% gain. The Philadelphia Fed rose to 15.2 from 6.7 which beat the Street’s estimate for 8.0. Stocks were quiet on Friday after the ECB extended a lifeline to Greece and investors digested the week’s strong rally.
[/su_spoiler]
[su_spoiler title=”Market Outlook: The Central Bank Put Is Alive And Well” style=”fancy”]
Remember, in bull markets surprises happen to the upside. This has been our primary thesis since the end of 2012. We would be remiss not to note that this very strong bull market is aging (celebrated its 6th anniversary in March 2015) and the last two major bull markets ended shortly after their 5th anniversary; 1994-2000 & 2002-Oct 2007). To be clear, the central bank put is very strong and until material damage occurs, the stock market deserves the longer-term bullish benefit of the doubt. As always, keep your losses small and never argue with the tape.
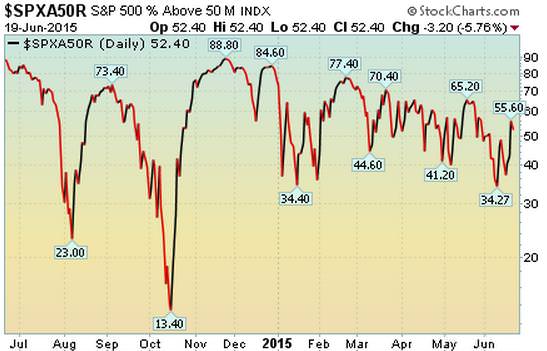
52.4% Of Stocks in the S&P 500 Are Above Their Respective 50 DMA
(Market Tends To Turn When This Reading Gets Above 70% or Below 40%)
Observation: Readings above 70% usually (not always) correspond with a short-term pullback Conversely, reads below 40% usually (not always) correspond with a short-term bounce
[/su_spoiler]
[su_spoiler title=”Big Stock List” style=”fancy”]
- AAPL – Fell for a 4th straight wk and is setting up nice to breakout. Forming nice downward trendline
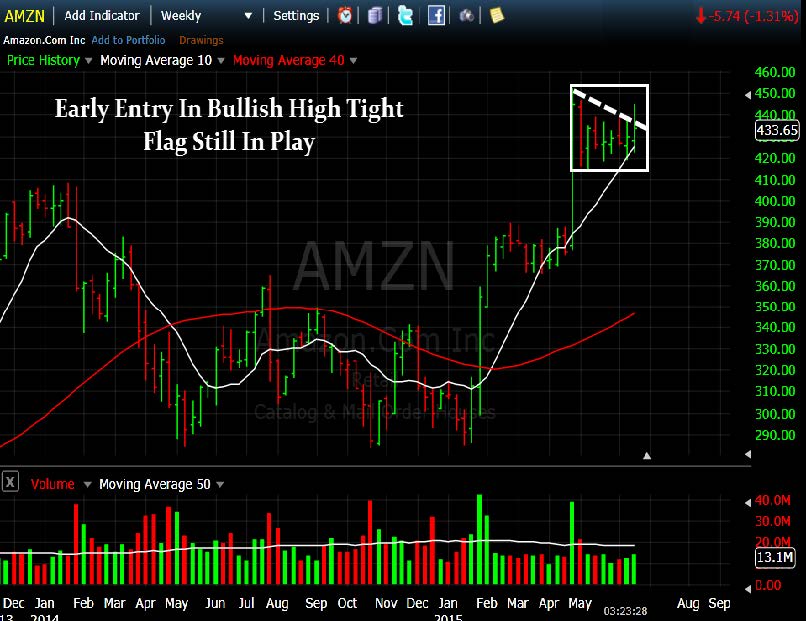
- AMZN – Tried to breakout of mid-level resistance but tucked its head back in . Should rally from here
- EA – HUGE breakout last wk after perfect pullback into its 10 week moving avg (~50 DMA)
- FB – Good action last week as it tries to break above resistance over past few weeks
- FLT – Quiet action last week as it pauses to digest prior week’s strong rally
- GOOGL – Big positive reversal last week and it closed above its 50 and 200 dma lines
- ILMN – Nice rally for 8th straight week as it jumps to a fresh record high
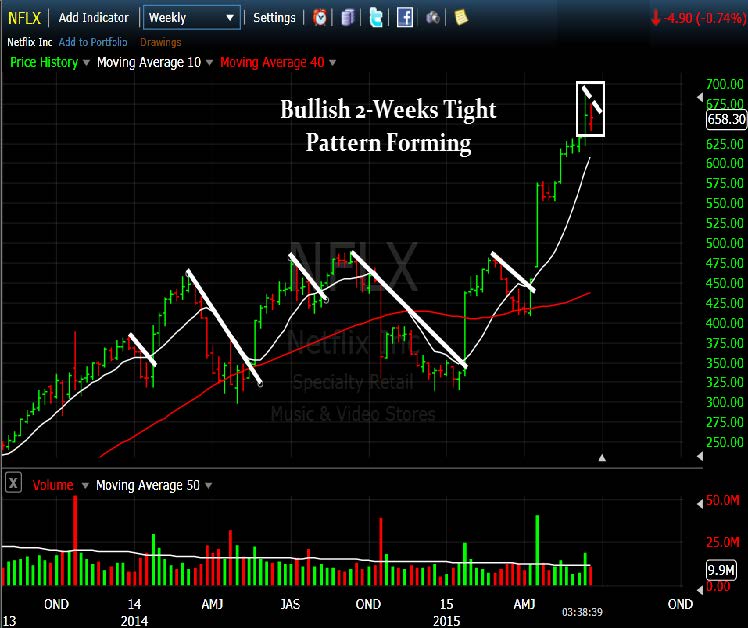
- NFLX – Forming bullish 2 weeks tight pattern as it pauses to digest VERY STRONG 3 month rally
- SBUX – HUGE rally to new highs last week after big positive reversal in prior week. Now extended
- TSLA – Big positive and outside reversal to the upside last week as the bulls continue to buy
- UA – Nice rally last week after short 2-week consolidation above 50 dma line
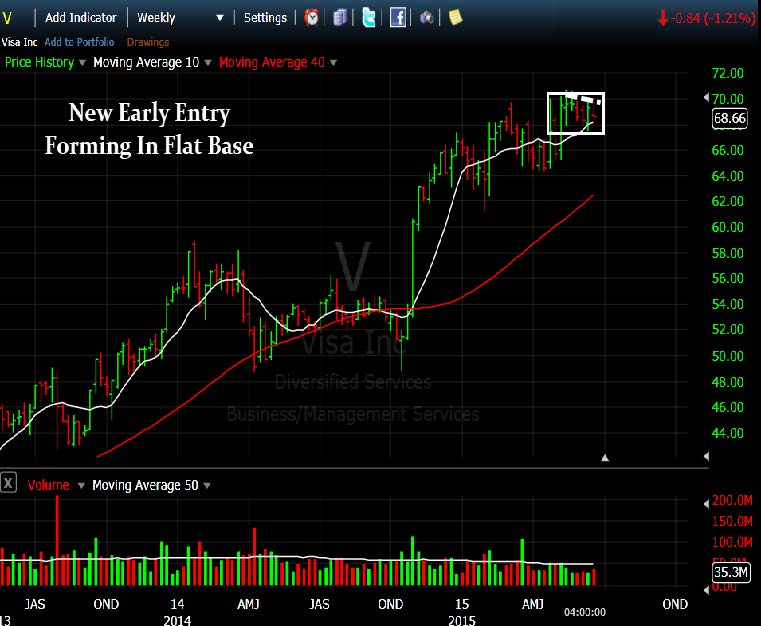
- V – Nice quiet action as it sits above its 50 DMA line. MA and COF brokeout.. Bodes well for V
[/su_spoiler]
[su_spoiler title=”19 New Setups” style=”fancy”]
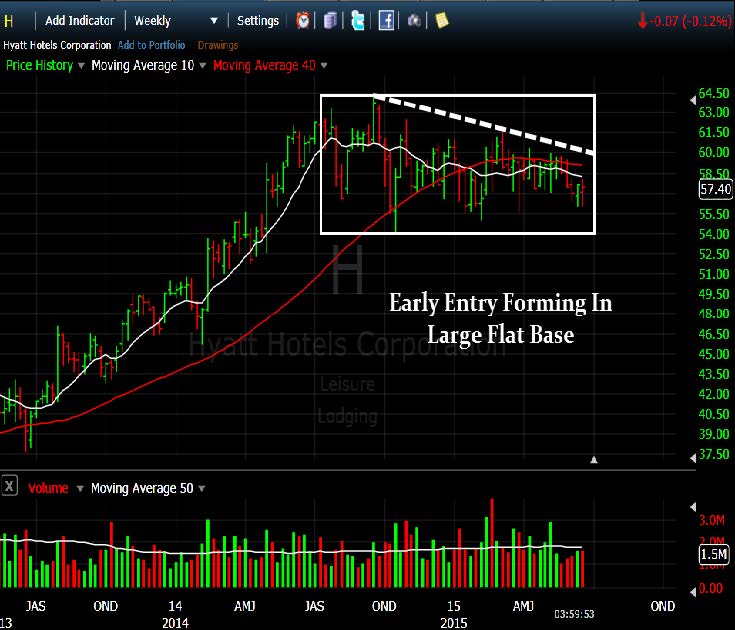
These hand-picked stocks are carefully selected to help with your idea generation and offer you additional setups each week. The setups are based on our proprietary criteria and offer advanced (dotted line) & classic long and short entry points (solid line). Short patterns are typically mirror images of long patterns.
Note: Please Verify All Earnings Dates/Data from Multiple Sources for Every Stock in all our report(s).
Charts Courtesy of FreeStockCharts.com and/or Stockcharts.com
AMZN Setup: Early Entry Still In Play
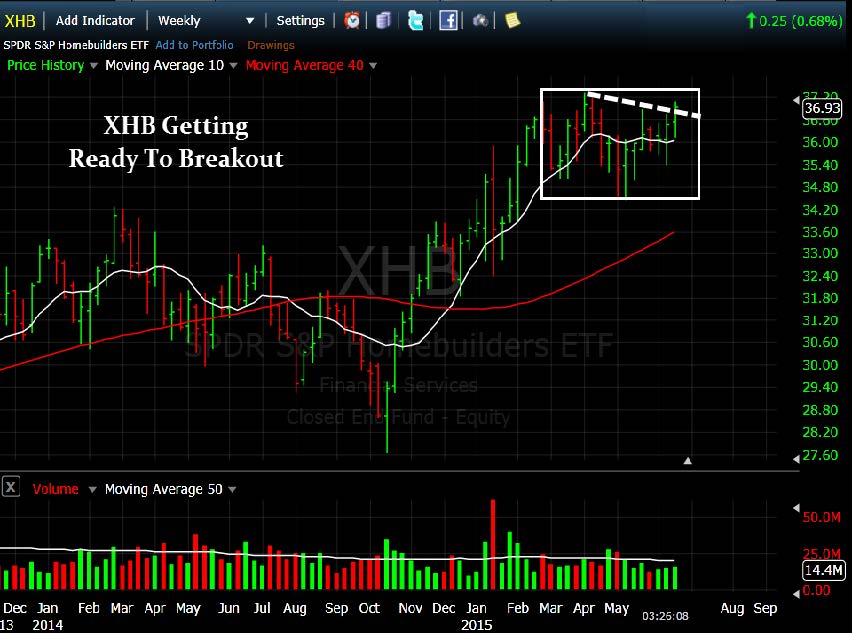
XHB Setup: New Early Entry Forming
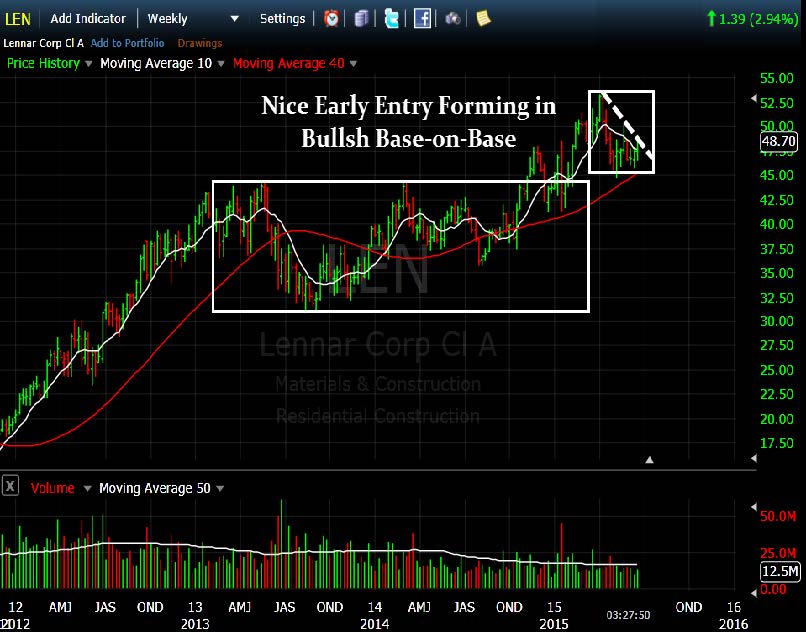
LEN Setup: New Early Entry Forming In Bullish Base-on-Base
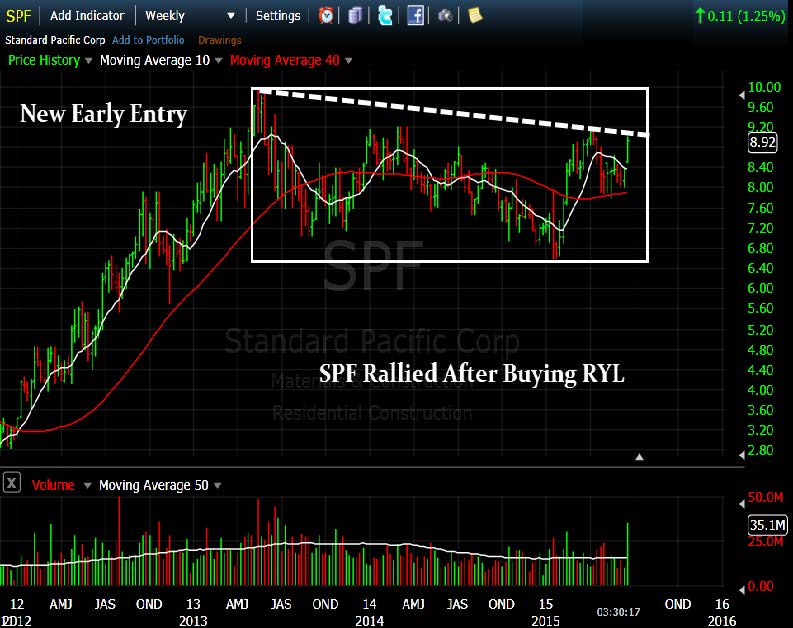
SPF Setup: Early Entry In Large Flat Base
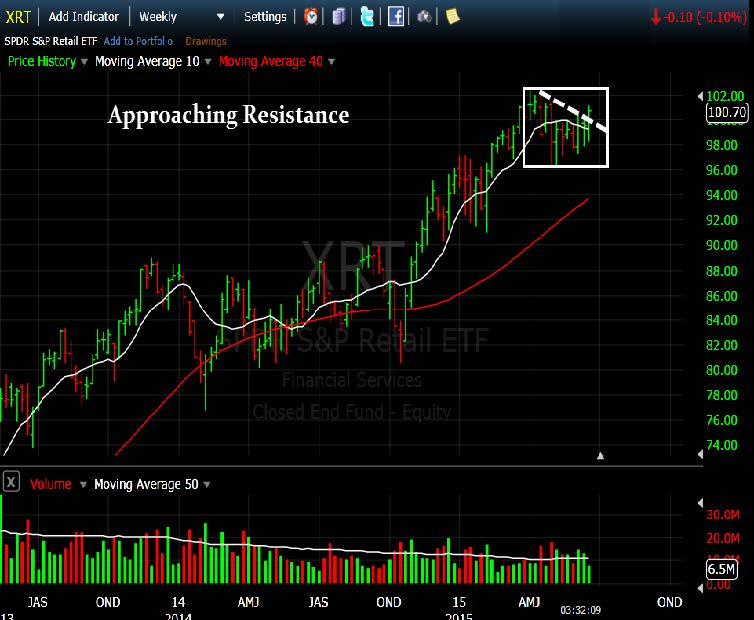
XRT Setup: Healthy Action
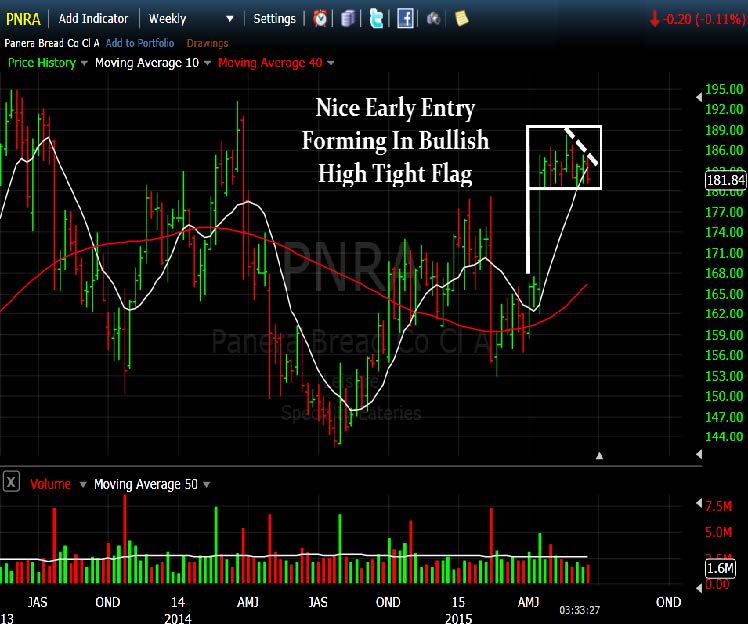
PNRA Setup: Nice Early Entry Forming
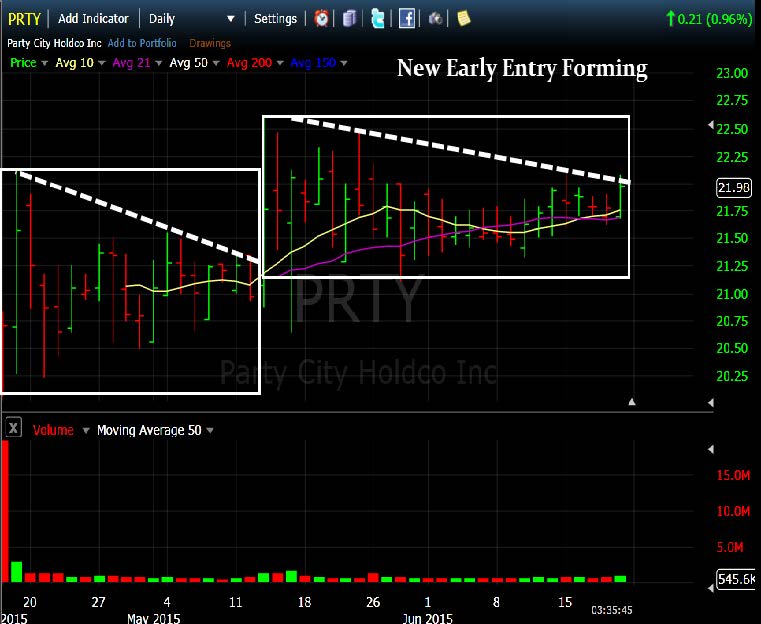
PRTY Setup: New Early Entry Forming
NFLX Setup: Early Entry Forming In Bullish 2-Weeks Tight Pattern
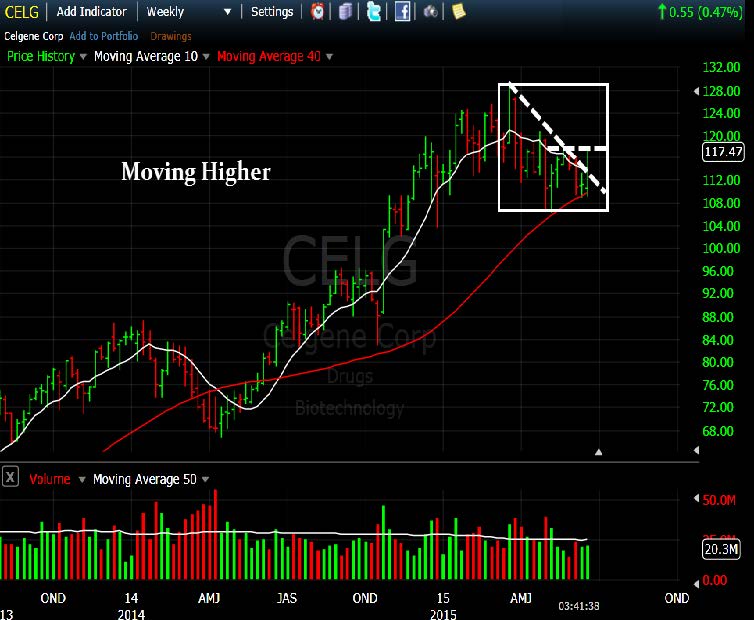
CELG Setup – Approaching Mid-Level Resistance
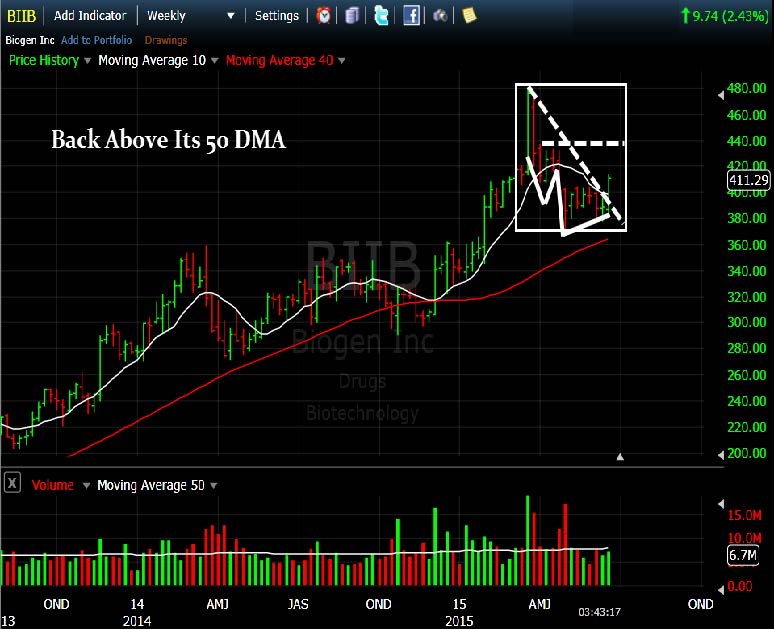
BIIB: Very Nice Action Last Week
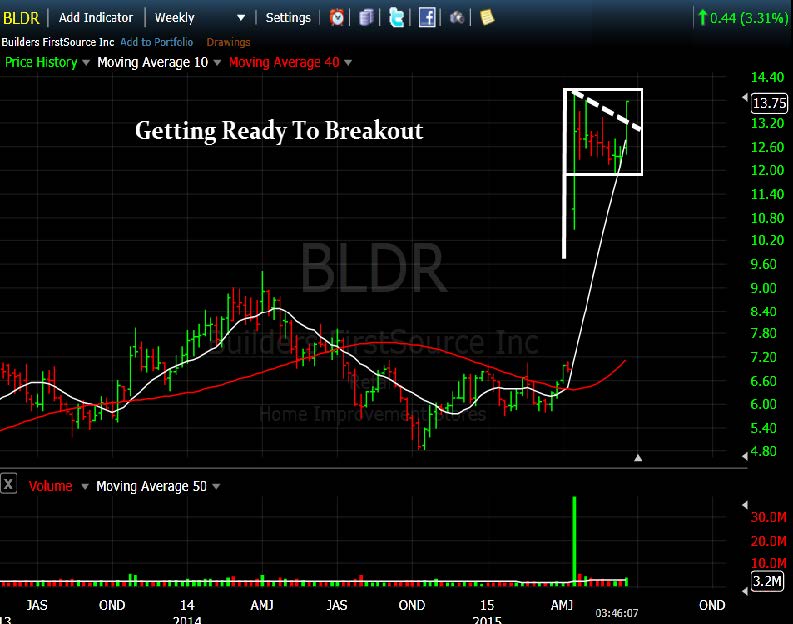
BLDR Setup – Continues To Rally As It Approaches Resistance In A Bullish High Tight Flag Pattern
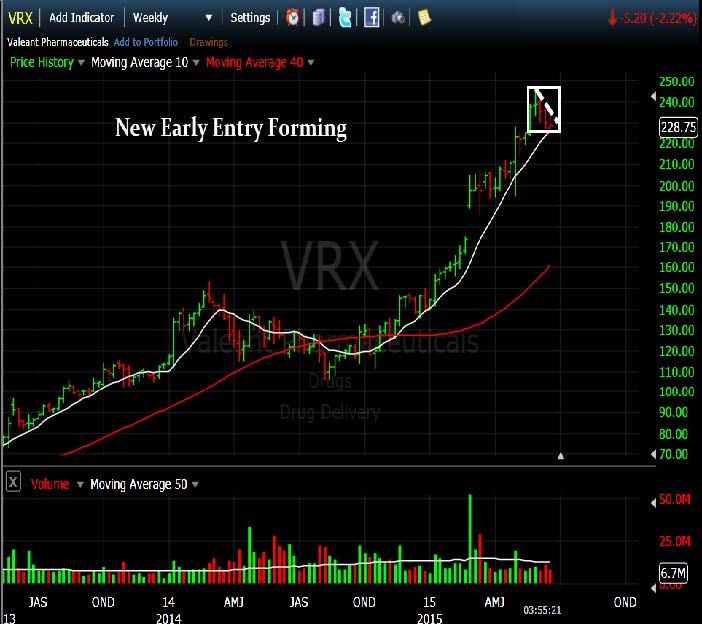
VRX Setup: New Early Entry Forming
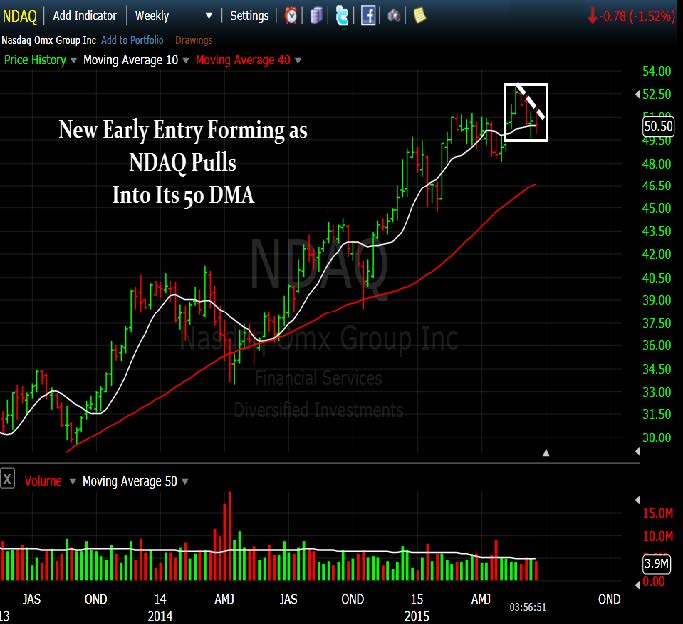
NDAQ Setup – Nice Early Entry Forming
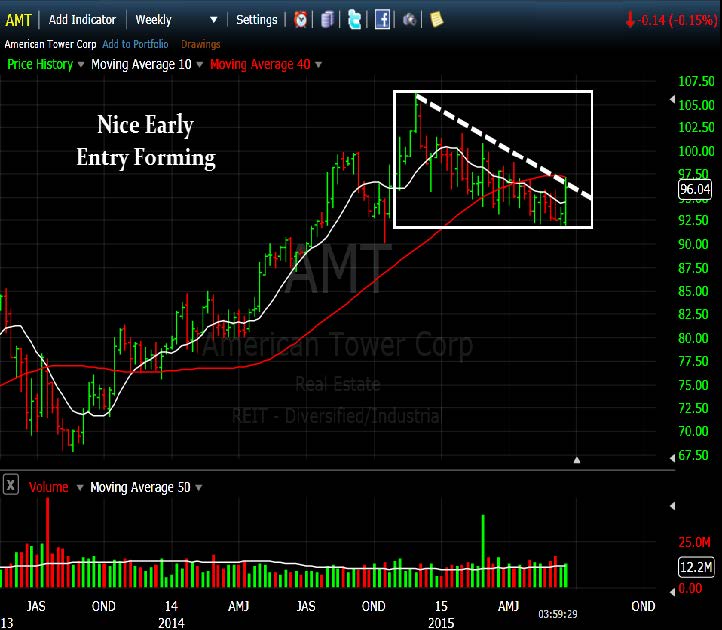
AMT: Nice Early Entry Forming In Large Flat Base
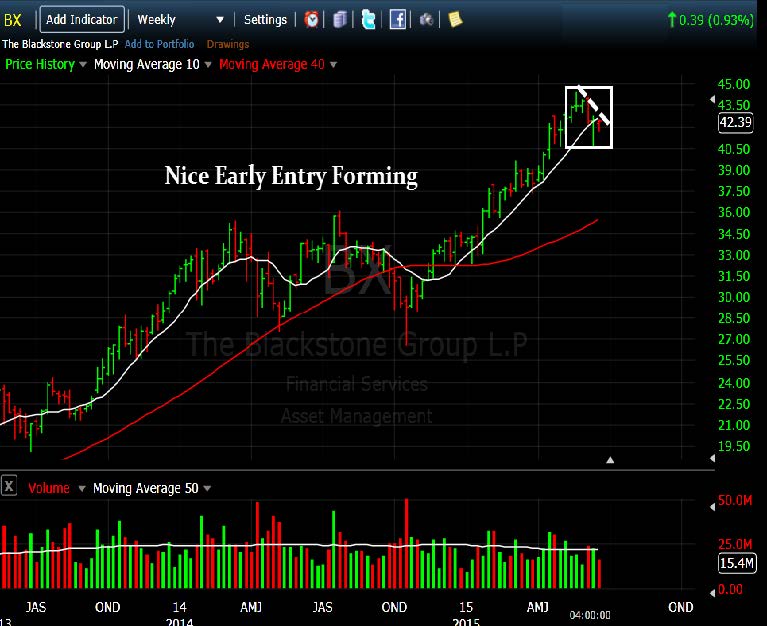
BX: New Early Entry Forming
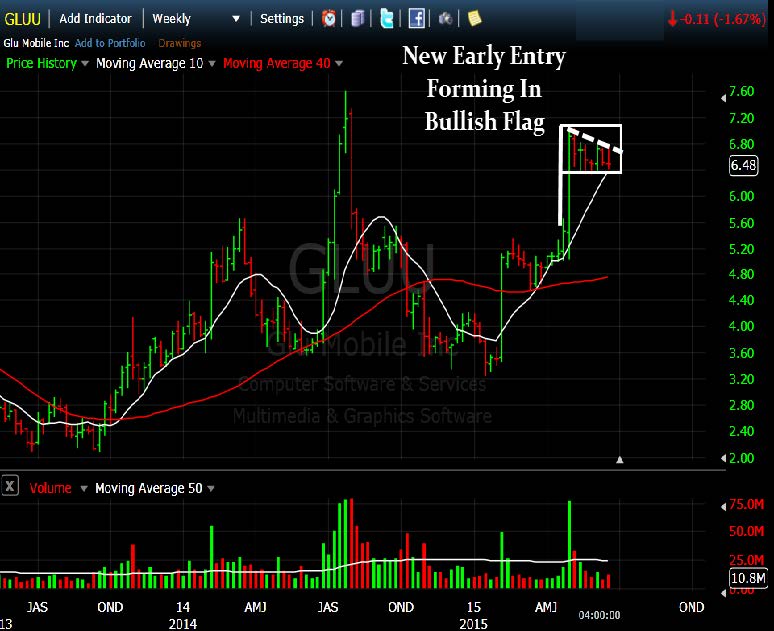
GLUU: New Early Entry Forming In Bullish High Tight Flag
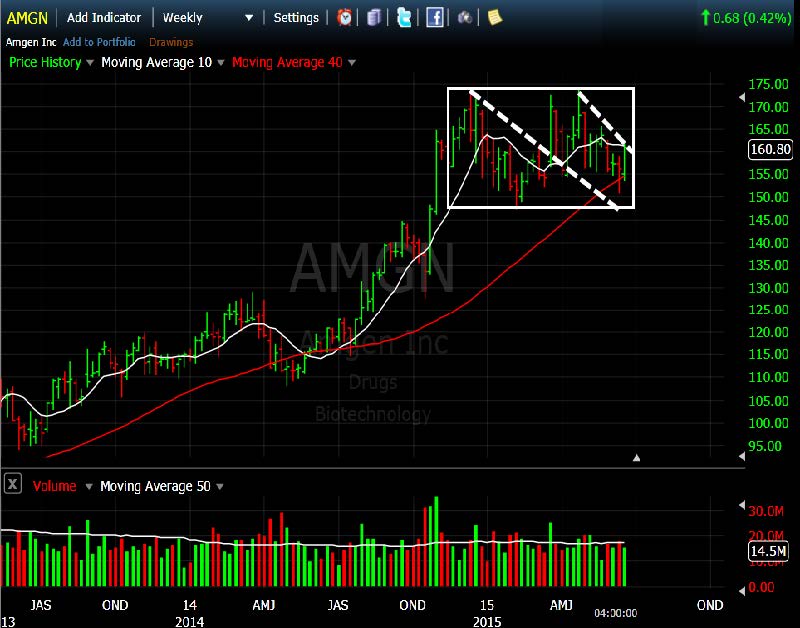
AMGN: New Early Entry Forming In New Base
V: New Early Entry Forming In Flat Base
H: New Early Entry Forming In Large Flat Base
[/su_spoiler]
[su_spoiler title=”Strongest Sectors, Groups, & Symbols” style=”fancy”]
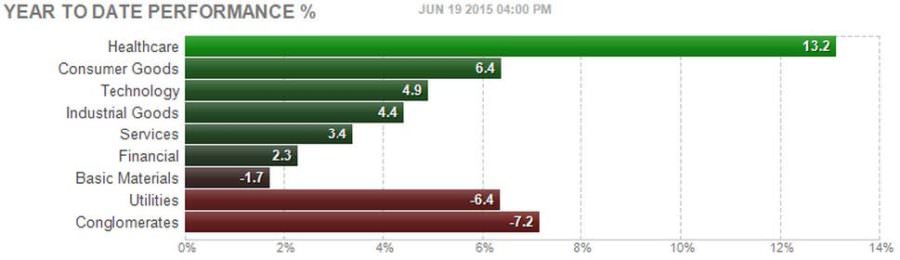
[su_heading style=”modern-1-dark” size=”18″]Strongest Sectors [/su_heading]
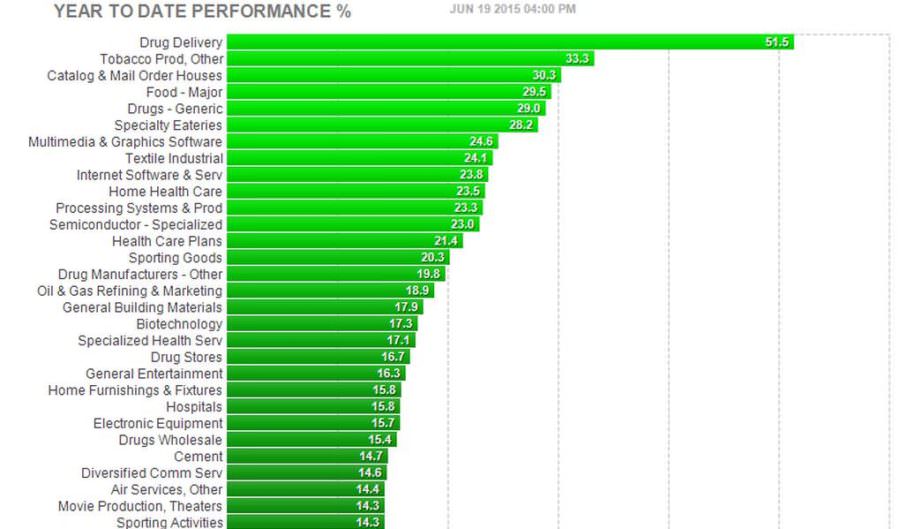
[su_heading style=”modern-1-dark” size=”18″]Strongest Groups [/su_heading]
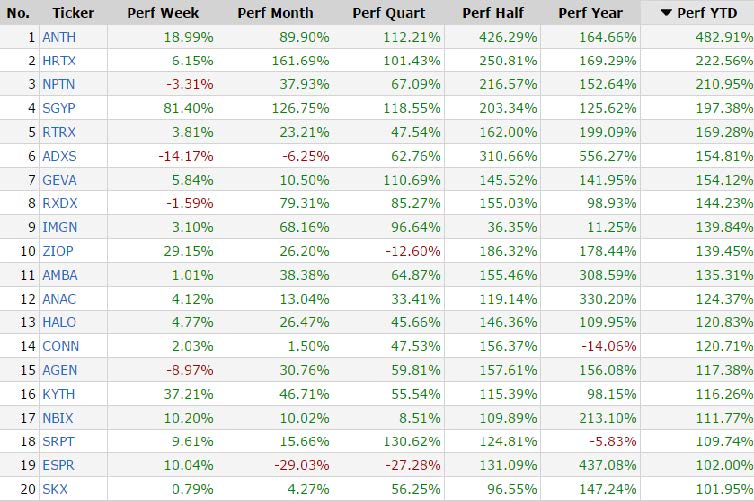
[su_heading style=”modern-1-dark” size=”18″]Strongest Stocks Of The Year [/su_heading]
These are the top 20 strongest performing tickers on a year-to-date basis that are trading over $5, average daily volume over 500k and have a market cap >300M (Small cap-Mega Cap)
“Never argue with the tape and always keep your losses small.”
Trade wisely,
[/su_spoiler]


