

[su_spoiler title=”Monday-Wednesday’s Action: Economic & Earnings Data Is Not Impressive” style=”fancy”]
Stocks were closed on Monday in observance of the Memorial Day Holiday. Stocks opened lower on Tuesday as investors digested the latest round of tepid economic data, and the USD resumed its very strong uptrend. Remember the Fed remains “data-dependent” and so far the data remains lackluster at best which removes pressure for the Fed to raise rates anytime soon. On Tuesday, durable goods fell -0.5% in April which barely beat estimates for a decline of -0.6% but was still in negative territory that is not ideal. The Dallas Fed Manufacturing survey plunged to -20.8, missing estimates for -10.0. Markit’s Flash PMI (Purchasing Managers Index) for the services sector slid for a third straight month in May to 56.4, missing estimates for 56.5. The Richmond Fed Manufacturing Index remained soft, at 1, matching estimates for 1. The Conference Board Consumer Confidence report rose to 95.4 in May, beating estimates for 95.1. We saw some somewhat encouraging news from the housing market. New home sales rose +6.8% in April to a seasonally adjusted annual rate of 517k, beating estimates for 510k. The S&P/Case-Shiller composite index of 20 metropolitan areas rose 5% in March on a year-over-year basis, beating estimates for a +4.7% gain. Stepping back, the bigger problem for the “data-dependent” Fed continues to be the economic “data” continues to be lackluster at best with the Fed keeping rates at 0%. It raises the question, how much worse will it be if the Fed begins to tighten? Stocks rallied sharply on Wednesday after rumors spread that Greek officials and Eurogroup members have started crafting a staff-level agreement to secure funds to avoid a Grexit (Greece leaving the Eurozone). The rumor was refuted after Bloomberg cited a Eurogroup official as saying the two sides have yet to begin working on a joint statement. Economic data was limited to the weekly MBA Mortgage Index, which fell 1.6% to follow last week’s 1.5% decline.
[/su_spoiler]
[su_spoiler title=”Thursday-Friday’s Action: Stocks Pullback From 2015 Highs” style=”fancy”]
Stocks slid on Thursday after the Transports slid to a fresh low for the year and the Greek drama continued. The head of the IMF, Christine Lagarde, told a German newspaper that a Greek exit from the euro zone was possible but, if that occurred, it would probably not destroy the euro currency. She said such a step would “not be a walk in the park” but would “probably not” mean the end of the euro. In other overseas news, Chinese stocks plunged 6.5% on Thursday after tighter margin requirements were cited for the large decline. Even with the decline, the Shanghai Composite is still up a very impressive 40% in 2015. In the U.S., weekly jobless claims came in at 282k, missing estimates for 270k. Pending home sales rose 3.4% in April, the highest in 9 years, and beat estimates for 0.8%. Before Friday’s open the government said U.S. GDP fell -0.7%, beating the government’s estimate for a -0.8% decline but missing economists’ estimates for a decline of 0.1%. The Chicago PMI unexpectedly fell to 46.2 in May, missing estimates for 53.1. Separately, consumer sentiment came in at 90.7 for May, the lowest since November but beat estimates for 90.3.
[/su_spoiler]
[su_spoiler title=”Market Outlook: The Central Bank Put Is Alive And Well” style=”fancy”]
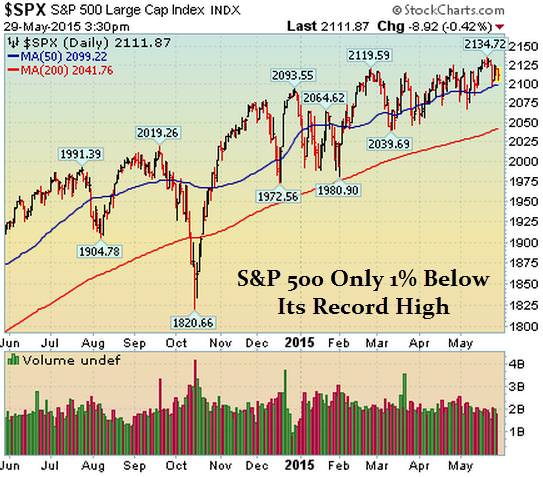
Remember, in bull markets surprises happen to the upside. This has been our primary thesis since the end of 2012. We would be remiss not to note that this very strong bull market is aging (celebrated its 6th anniversary in March 2015) and the last two major bull markets ended shortly after their 5th anniversary; 1994-2000 & 2002-Oct 2007). To be clear, the central bank put is very strong, and until material damage occurs, the stock market deserves the longer-term bullish benefit of the doubt. As always, keep your losses small and never argue with the tape.
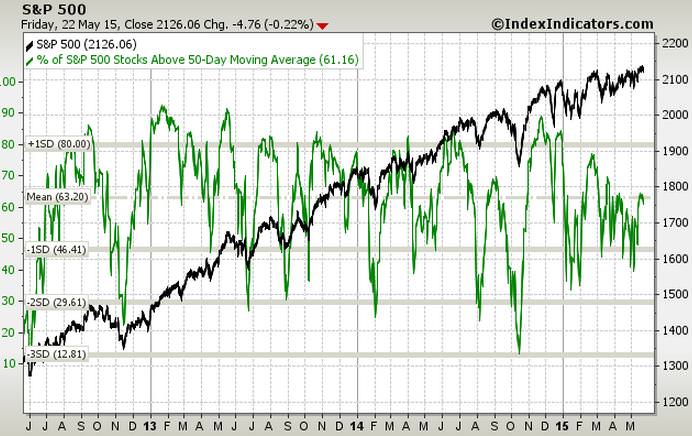
61.16% Of Stocks in the S&P 500 Are Above Their Respective 50 DMA
(Market Tends To Turn When This Reading Gets Above 70% or Below 40%)
Observation: Readings above 70% usually (not always) correspond with a short term pullback Conversely, reads below 40% usually (not always) correspond with a short term bounce
[/su_spoiler]
[su_spoiler title=”Big Stock List” style=”fancy”]
- AAPL – Snapped a two-week win streak but closed above its 50 DMA line
- AMZN – Continues to form a very BULLISH looking 6-week handle
- EA – Hit a new all-time high then pulled back and ended flat for the week
- FB – Fell last week after failing at resistance (50 DMA) for 3rd straight week
- FLT – Fell for 5th straight week and closed below its 50 DMA line
- GOOGL – Fell last week after encountering resistance near its 50 and 200 DMA lines
- ILMN – Nice rally for 5th straight week as it trades near resistance (record highs)
- NFLX – 4th straight weekly gain. Remains extended in near term
- SBUX – 3rd straight weekly gain after finding support above its 50 DMA line
- TSLA – Healthy action continues…Feels extended in the short term. 50 DMA line 222…
- UA – Continues “living” below its 50 DMA line. A new technical buy signal will be triggered when it gets back above its 50 DMA
- V – Only two down weeks in the past 6. Tight weekly closes on a weekly chart. Remains perched below all-time highs
[/su_spoiler]
[su_spoiler title=”17 New Setups” style=”fancy”]
These hand-picked stocks are carefully selected to help with your idea generation and offer you additional setups each week. The setups are based on our proprietary criteria and offer advanced (dotted line) & classic long and short entry points (solid line). Short patterns are typically mirror images of long patterns.
Note: Please Verify All Earnings Dates/Data from Multiple Sources for Every Stock in all our report(s).
Charts Courtesy of FreeStockCharts.com and/or Stockcharts.com
AMZN Working Order & Setup:

DPZ Working Order & Setup: New Early Entry Forming

MTH Working Order & Setup: New Early Entry Forming

IBB Setup: New Early Entry Forming

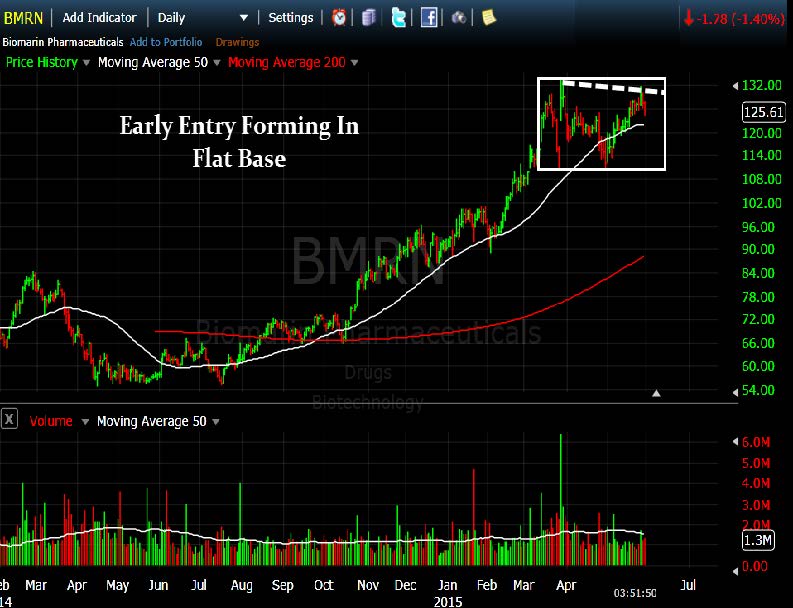
BMRN Setup: Early Entry In Flat Base
XLV Setup: New Early Entry Forming

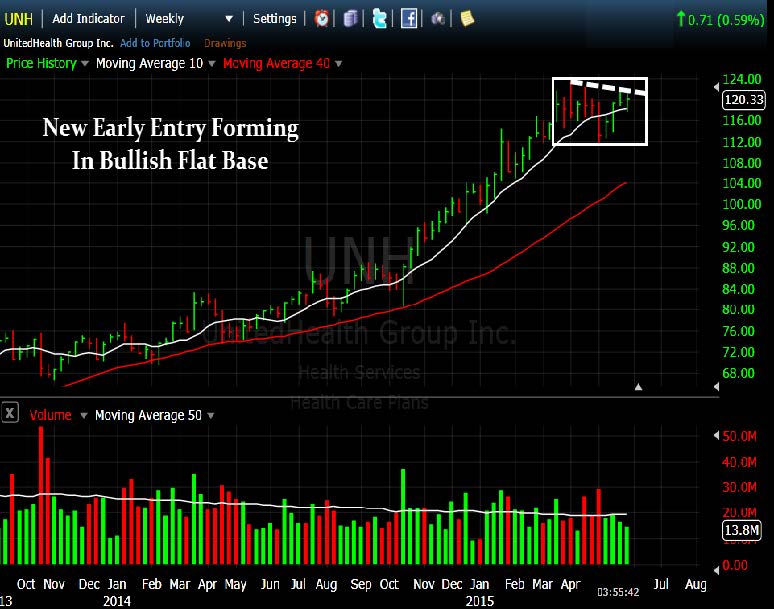
UNH Setup: Early Entry Forming In Bullish Flat Base
HCA Setup: Early Entry Forming

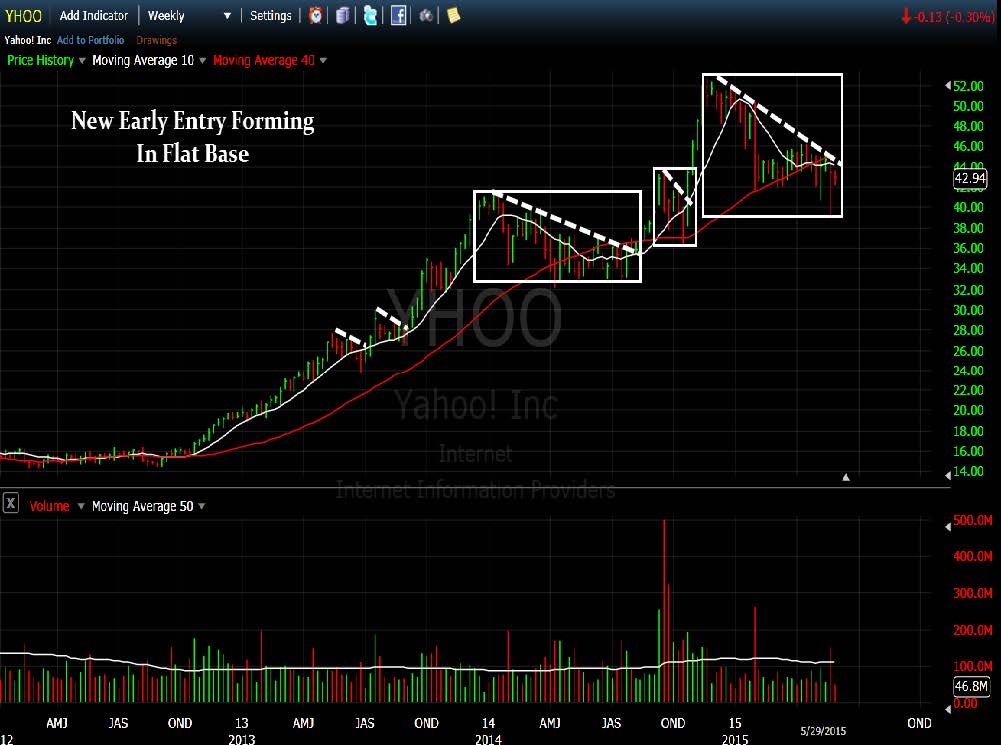
YHOO Setup: Early Entry Forming In New Flat Base
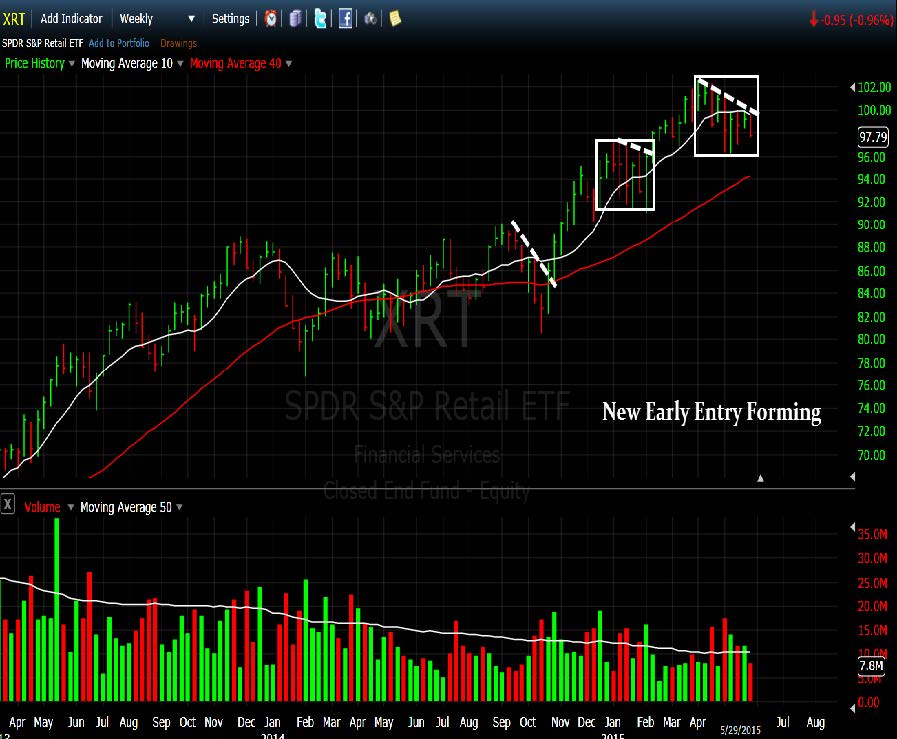
XRT Setup – New Early Entry Forming
BLDR Setup – Early Entry Forming In Bullish High Tight Flag Pattern

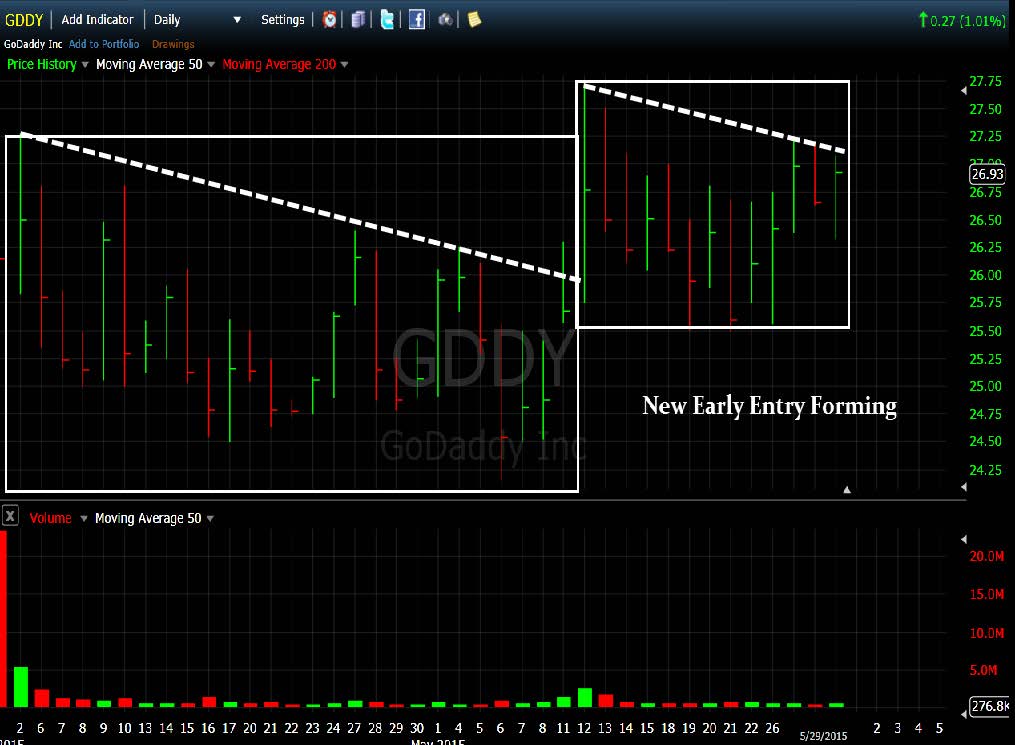
GDDY Setup: Nice Early Entry Forming In Flat Base
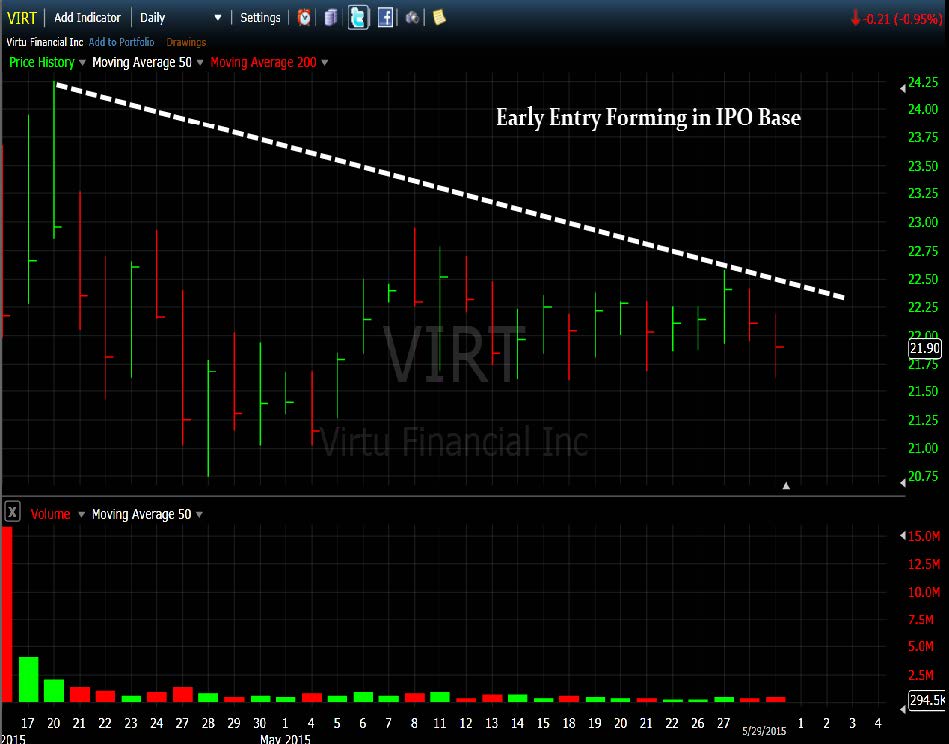
VIRT Setup – Nice Early Entry Forming
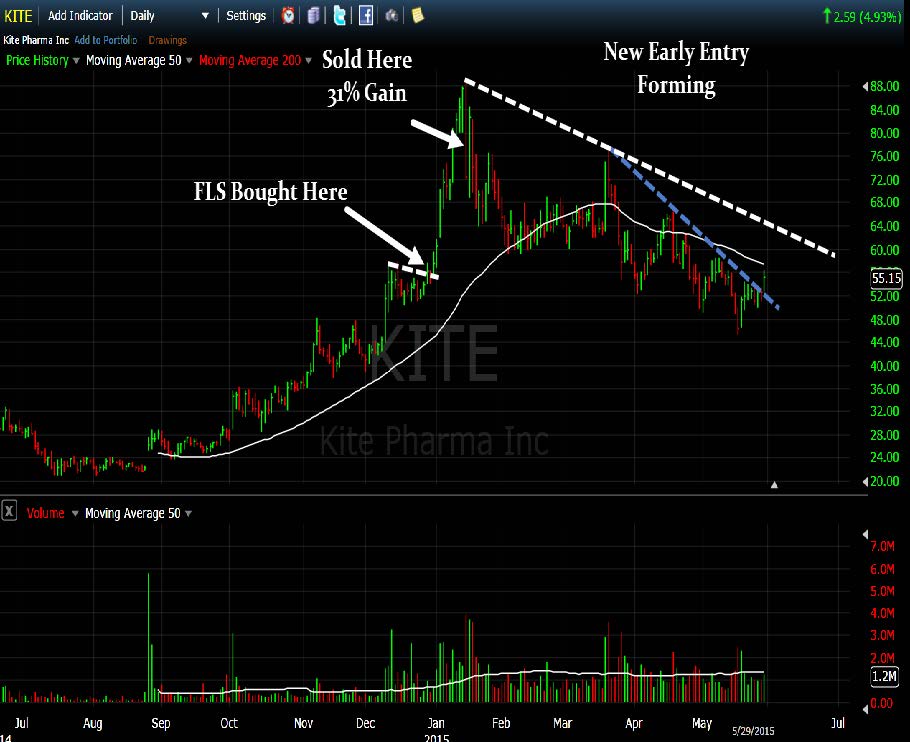
KITE: New Early Entry Forming
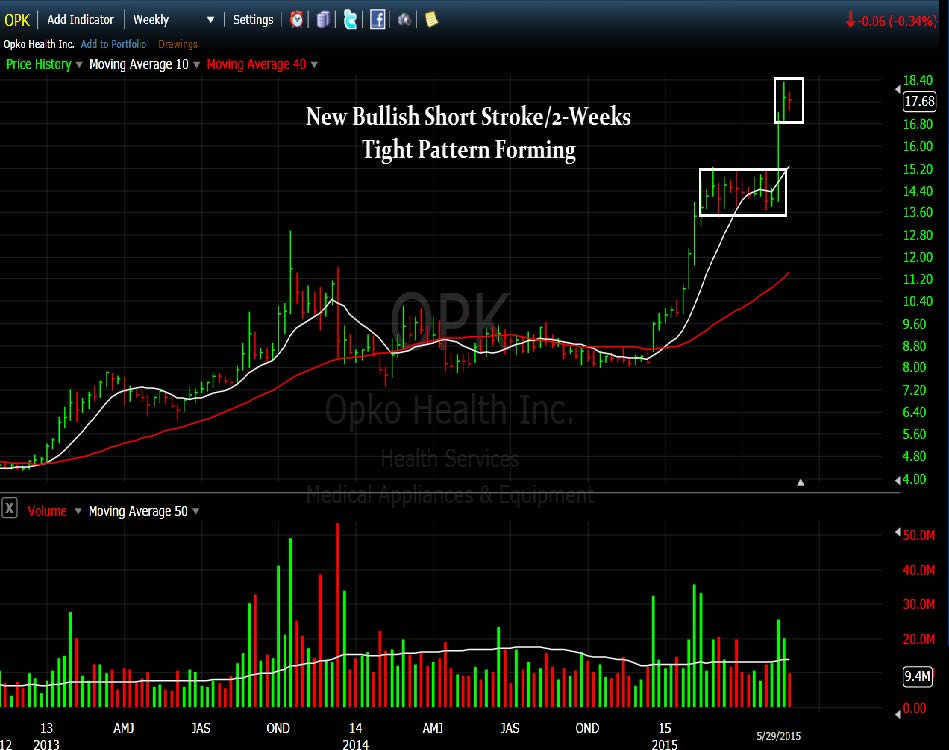
OPK: New Short Stroke Pattern Forming
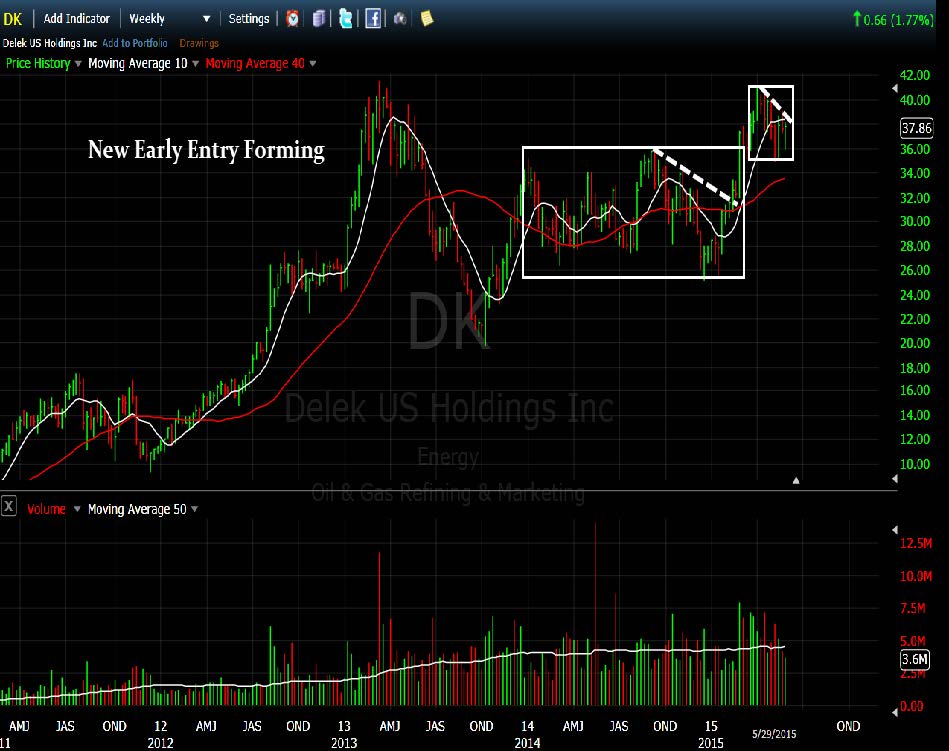
DK: New Early Entry Forming
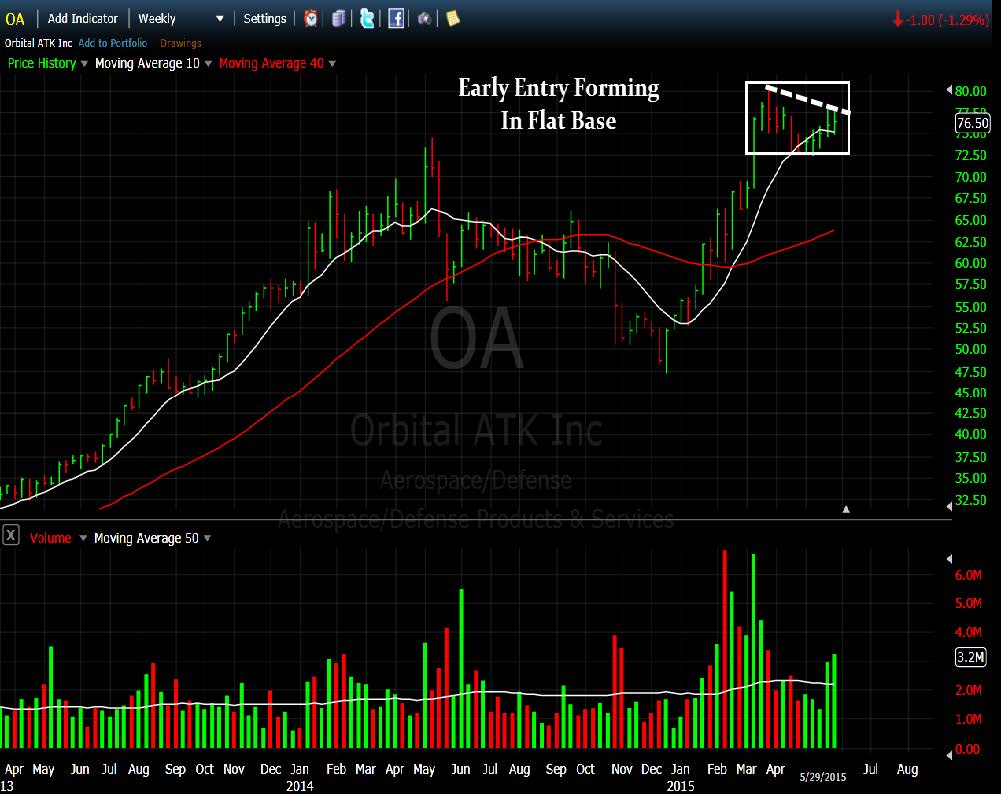
OA: New Early Entry Forming
[/su_spoiler]
[su_spoiler title=”Strongest Sectors, Groups, & Symbols” style=”fancy”]
[su_heading style=”modern-1-dark” size=”18″]Strongest Sectors [/su_heading]

[su_heading style=”modern-1-dark” size=”18″]Strongest Groups [/su_heading]

[su_heading style=”modern-1-dark” size=”18″]Strongest Performing Symbols This Year [/su_heading]
These are the top 20 strongest performing tickers on a year-to-date basis that are trading over $5, average daily volume over 500k and have a market cap >300M (Small cap-Mega Cap)

[/su_spoiler]


