

[su_spoiler title=”Monday-Wednesday’s Action: Earnings Continue To Be Released” style=”fancy”]
On Monday, stocks fell after a slew of biotechs got hammered. The benchmark S&P 500 hit a fresh record high on Monday but then turned lower which is not an ideal sign. The biotechs have been one of the strongest areas in the market over the past few years and continues to be a good proxy for the broader risk appetite from institutional investors. Therefore, that area must be watched closely. Once again, China’s Shanghai Composite led other global stock markets and soared +3.0% after reports spread that the People’s Bank of China (China’s Central Bank) was looking into buying local government bonds (Their latest attempt to boost markets). In Europe, optimism spread regarding the ongoing Greek drama. On the upside, steel and gold stocks rallied nicely as they bounce off a near term low. The Market Vectors Gold Miners ETF ($GDX) and Market Vectors Steel ETF ($SLX) rallied +2.1% and +0.8%, respectively. After Monday’s close, Apple Inc ($AAPL) reported another very strong quarter with iPhone sales as the standout winner. Stocks ended mixed on Tuesday after another see-saw session on Wall Street. Investors digested the latest round of economic and earnings data and waited for the Fed. The $IBB (popular biotech ETF) broke below its 50 DMA line for the first time since February. Almost instantly, the bulls showed up and did their best to defend support. The buying helped intra-day but by the close the $IBB closed below its 50 DMA line on monstrous volume. Twitter Inc. ($TWTR) plunged 18% on Tuesday after their earnings were leaked intra-day. The stock was briefly halted an hour before the close and then reopened down 20%. Twitter was scheduled to release their earnings after the bell but they posted their results on their website during the day and a data mining company tweeted (which is ironic) the results which sent the stock plunging. The company said they do not manage their investor relations page and the company is looking into who leaked the results. Economic data was mixed: the Cash Shiller 20-City Home Price Index rose by +5% in February, beating estimates of +4.7%. The Conference Board’s Consumer Confidence Index slid to 95.2 in April, missing estimates for 102.2. Before Wednesday’s open, the government reported Q1 GDP rose by 0.2%, missing estimates for a 1% gain. It was also much lower than Q4 2014’s reading of 2.2%. The weaker-than-expected reading sent the USD and U.S. Bonds plunging as pressure eased regarding an imminent rate hike from the Fed. The euro surged on the news and broke out of resistance of a two month base which sent the German Dax (Germany’s stock market) and several other European equity markets lower. At 2pm EST, the Fed concluded its latest 2-day meeting and left rates steady near zero percent, expressed concern over the economy, and said they remain “data-dependent.” In other news, p ending home sales rose 1.1% in March which was the fastest increase since last summer and beat estimates for a gain of 1.0%.
[/su_spoiler]
[su_spoiler title=”Thursday-Friday’s Action: Biotechs Break 50 DMA” style=”fancy”]
Stocks fell hard on Thursday on the last trading day of April. Biotech stocks dragged the market lower but the selling was broad in nature. Economic data remained mixed. First, weekly jobless claims slid to the lowest level since April 2000. Claims fell to 262k, beating estimates for 290k. The Chicago PMI rose to 52.3 in April, beating estimates for a gain of 50. Personal income growth was flat in March, missing estimates for +0.2% gain and missed February’s 0.4% reading. Personal income fell to the lowest level since December 2013 which bodes poorly for consumer spending and the broader economy. The employment cost index rose 0.7% in Q1 2015, beating estimates for 0.6% gain. Stocks bounced on Friday on the first trading day of May. Earnings data was mixed: The ISM Manufacturing index came in at 51.5, missing estimates for 52. Construction fell -0.6%, missing estimates for 0.4%. Consumer sentiment came in at 95.9, almost matching estimates for 96. Finally, the PMI manufacturing index fell to 54.1, missing estimates for 54.5.
[/su_spoiler]
[su_spoiler title=”Market Outlook: The Central Bank Put Is Alive And Well” style=”fancy”]
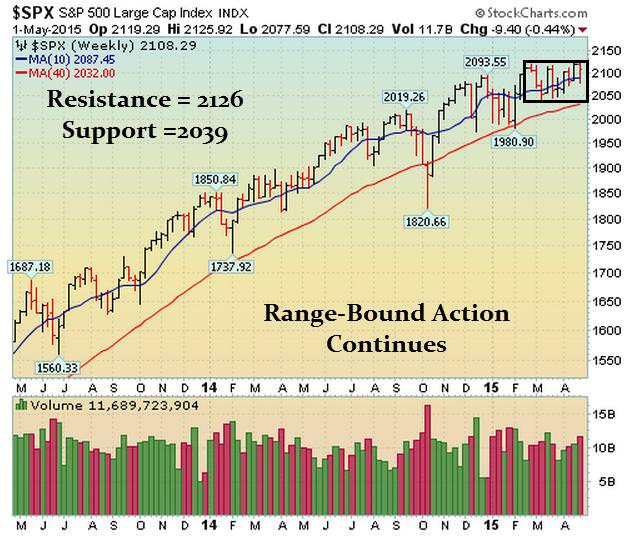
Remember, in bull markets surprises happen to the upside. This has been our primary thesis since the end of 2012. We would be remiss not to note that this very strong bull market is aging (celebrated its 6th anniversary in March 2015) and the last two major bull markets ended shortly after their 5th anniversary; 1994-2000 & 2002-Oct 2007). To be clear, the central bank put is very strong and until material damage occurs, the stock market deserves the longer-term bullish benefit of the doubt. As always, keep your losses small and never argue with the tape.
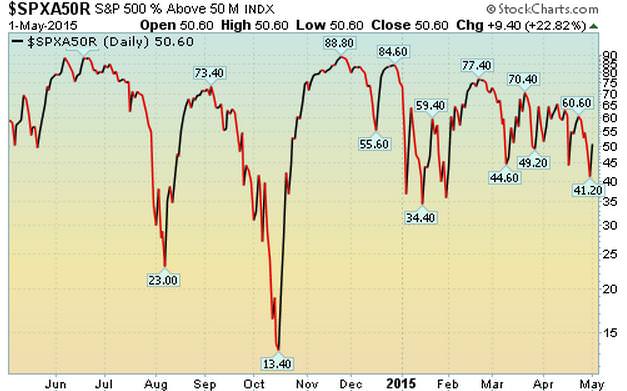
50.6% Of Stocks in the S&P 500 Are Above Their Respective 50 DMA (Market Tends To Turn When This Reading Gets Above 70% or Below 40%) Observation: Readings above 70% usually (not always) correspond with a short term pullback Conversely, reads below 40% usually (not always) correspond with a short term bounce
[/su_spoiler]
[su_spoiler title=”Big Stock List” style=”fancy”]
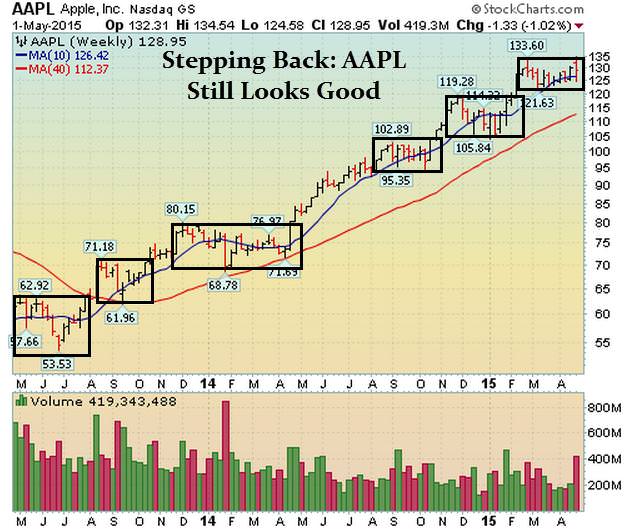
- AAPL – Big negative reversal last week after earnings
- AMZN – Fell last week as the market and high beta stocks got in trouble
- EA – Fell last week as the bulls showed up and defended the 50 DMA line. Earnings 5/5/15 after close
- FB – Fell last week and sliced below its 50 DMA line after TWTR, YELP, & LNKD got decimated
- FLT – Hit a new high then turned lower & closed in the middle of its weekly range. 50 DMA defended
- GOOGL – Fell hard last week and closed below its 50 DMA line
- ILMN – Big positive reversal last week (opened lower and closed higher) after support was defended
- LNKD – Huge gap down post earnings. Will be removed from this list
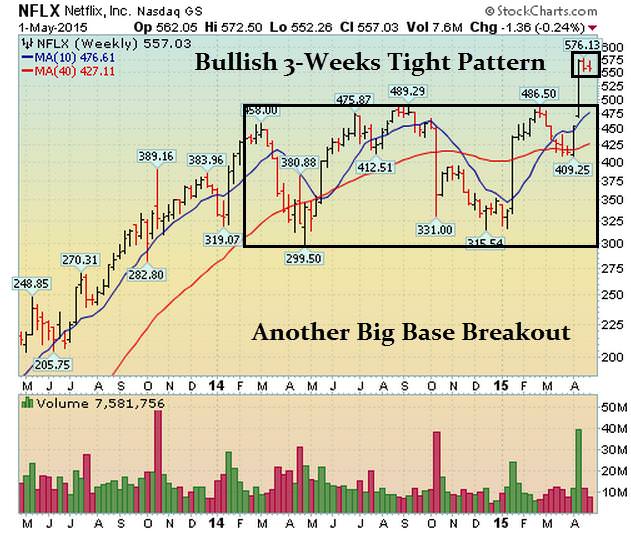
- NFLX – Forming a nice high handle after big rally
- SBUX – Pulled back after HUGE bullish Earnings related gap
- TSLA – Healthy action continues as it tries to form a bottom ahead of Earnings on 5.13.15 after close
- UA – Fell last wk & broke below its 50 DMA after big negative and downside reversal after earnings
- V – Fell last week and broke below its 50 DMA line after earnings
[/su_spoiler]
[su_spoiler title=”19 New Setups” style=”fancy”]
These hand-picked stocks are carefully selected to help with your idea generation and offer you additional setups each week. The setups are based on our proprietary criteria and offer advanced (dotted line) & classic long and short entry points (solid line). Short patterns are typically mirror images of long patterns.
Note: Please Verify All Earnings Dates/Data from Multiple Sources for Every Stock in all our report(s).
Charts Courtesy of Stockcharts.com
NFLX Working Order & Setup: Watch For A Breakout
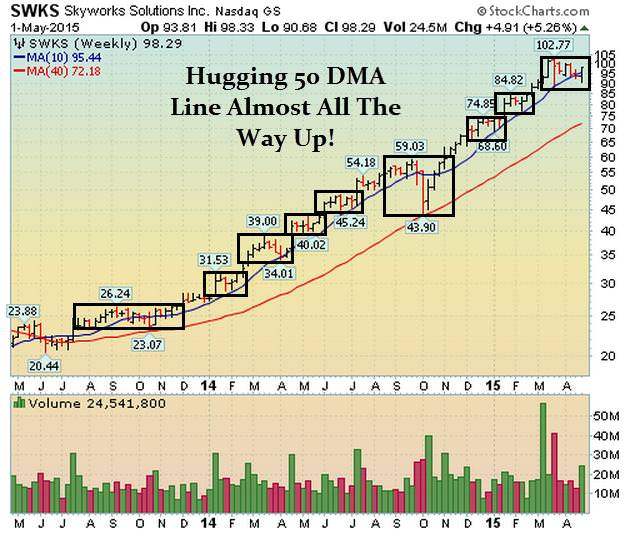
SWKS Working Orders & Setup: Nice Action
AAPL Working Order & Setup: If It Rallies- We Want To Be Involved
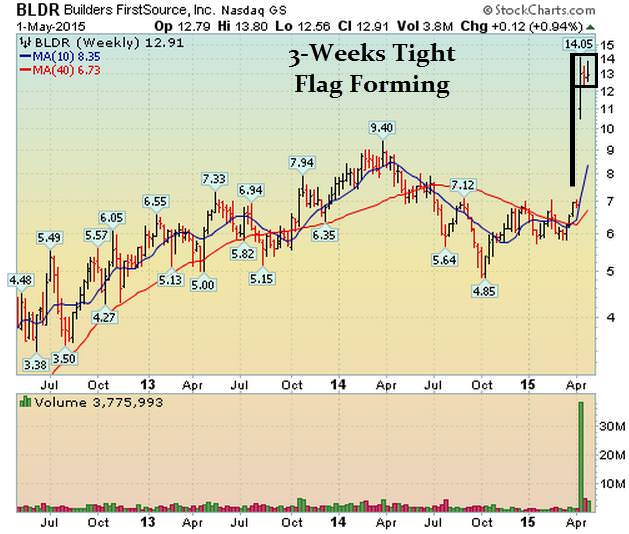
BLDR Setup: Bullish 3-Weeks Tight Forming
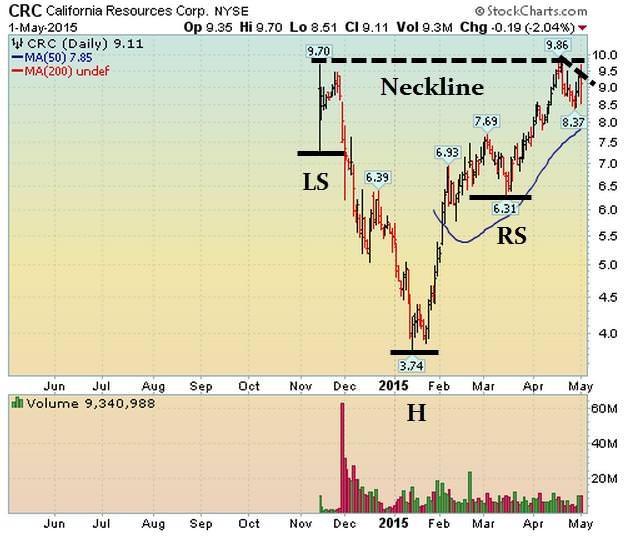
CRC Setup: Nice Head & Shoulders Bottom Forming
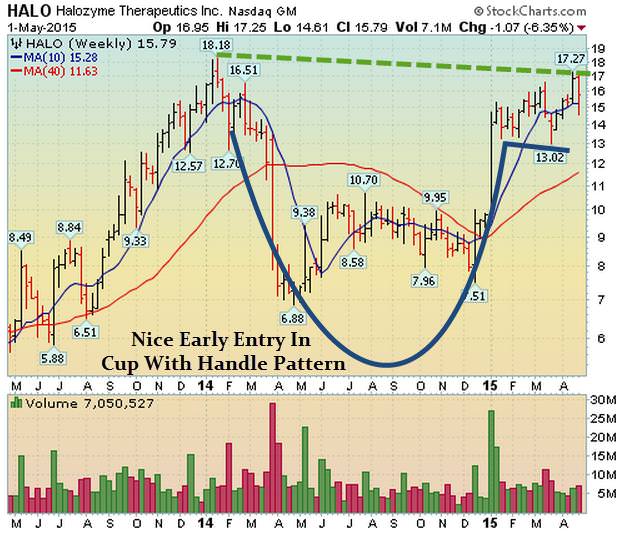
HALO Setup – Nice Early Entry Forming In Bullish-Cup-Shaped Base
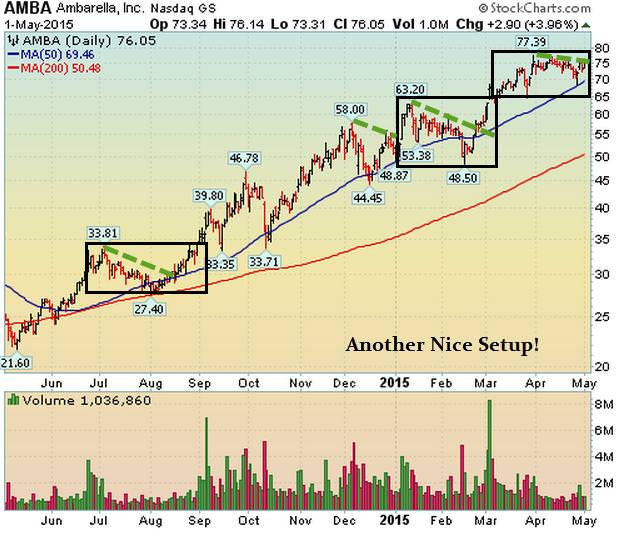
AMBA Setup – Another Nice Early Entry Is Forming
OPK Setup – New Early Entry Forming In Bullish Base-on-Base Pattern

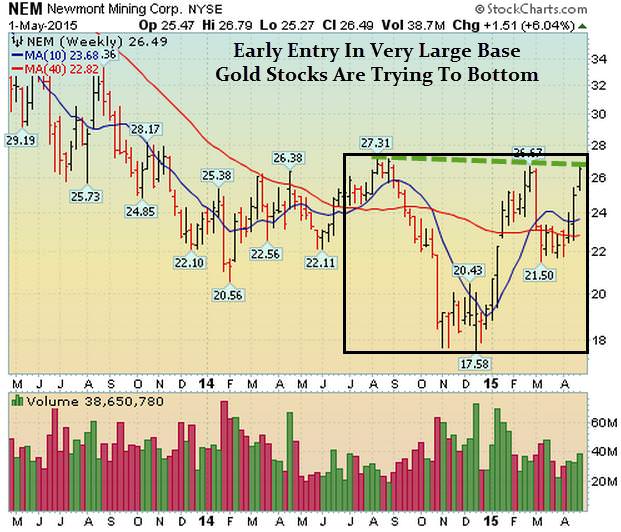
NEM Setup: Early Entry Forming As Gold Stocks Are Trying To Bottom
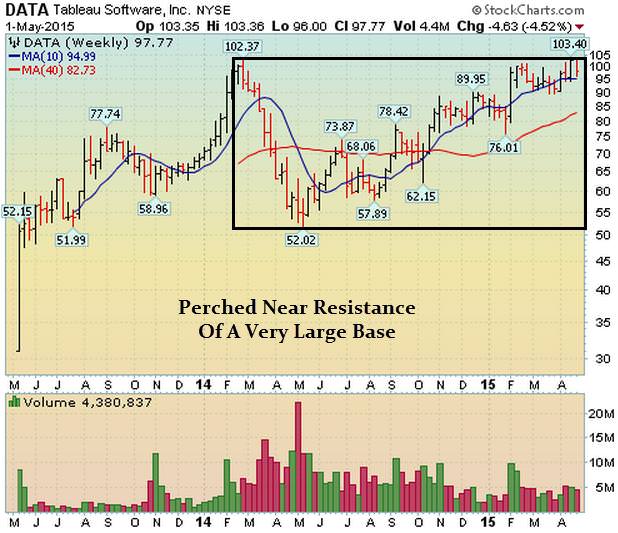
DATA: Perched Near Resistance Of Very Large Base
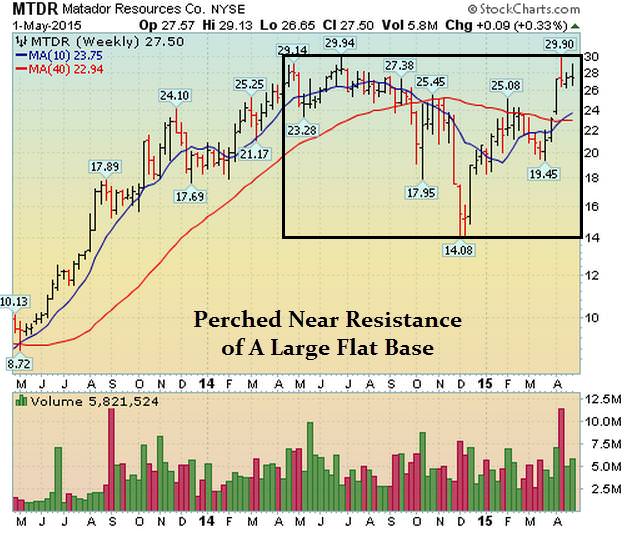
MTDR Setup: Very Nice Setup
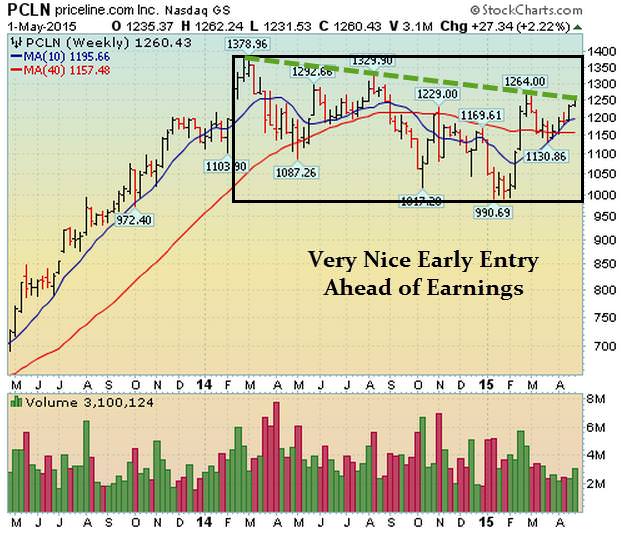
PCLN Setup – Nice Early Entry Ahead of Earnings
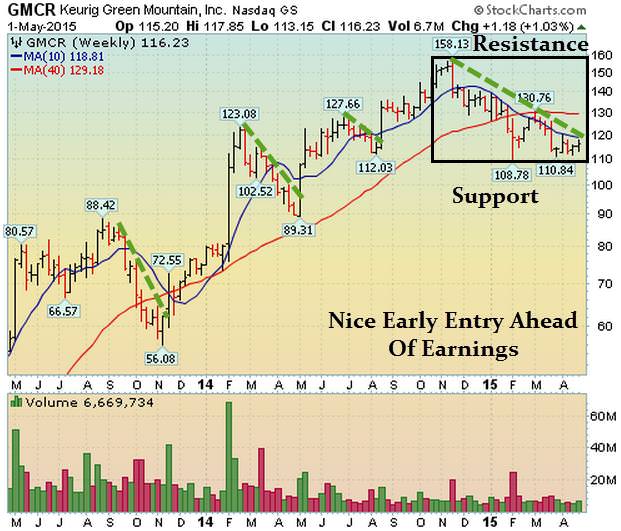
GMCR Setup: New Early Entry Forming Ahead of Earnings
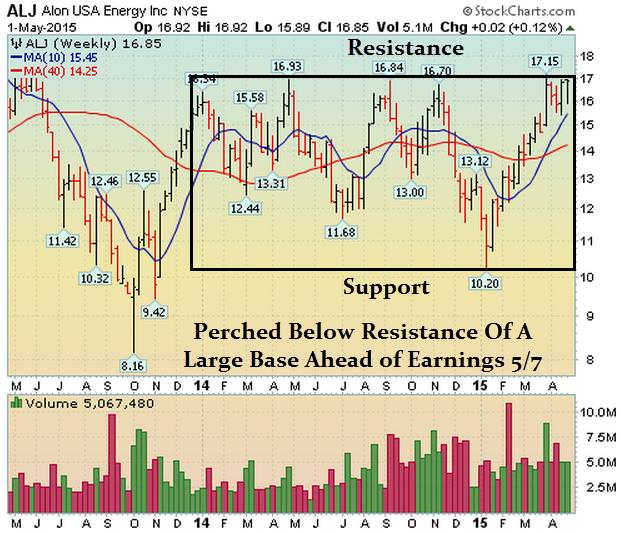
ALJ Setup: Nice Setup Ahead of Earnings
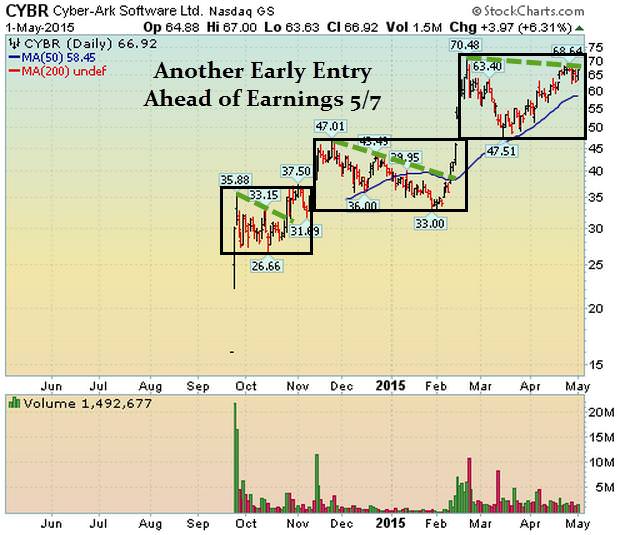
CYBR Setup: Nice Setup Ahead of Earnings
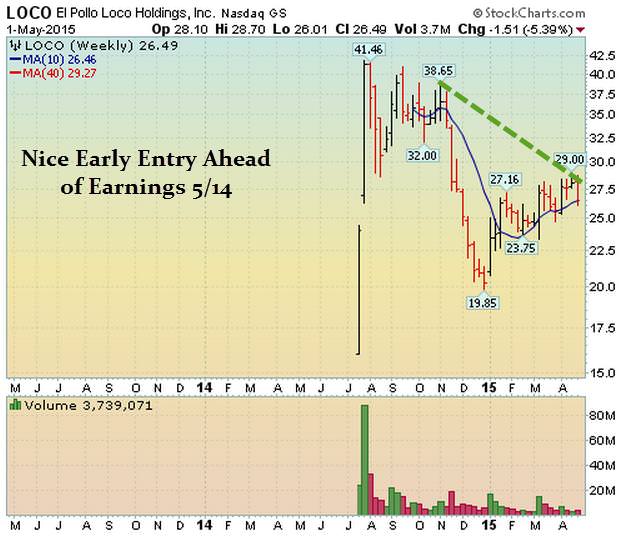
LOCO Setup: Early Entry Ahead of Earnings
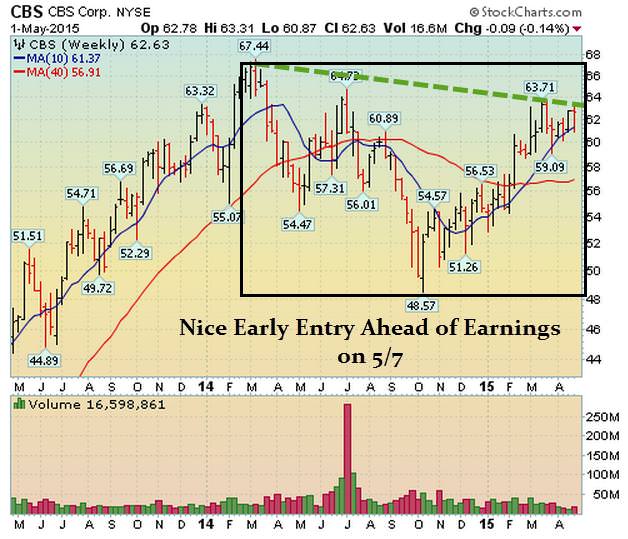
CBS: Early Entry Forming Ahead of Earnings
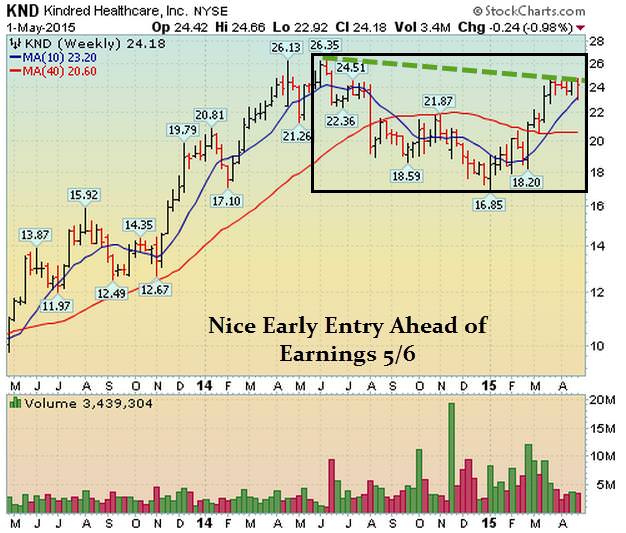
KND: Advanced Entry Forming Ahead of Earnings
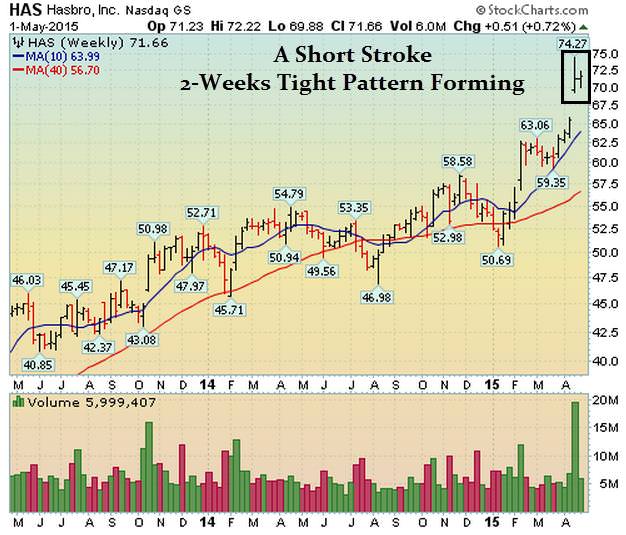
HAS: Bullish 2-Weeks Tight Pattern Forming
[/su_spoiler]
[su_spoiler title=”Strongest Sectors, Groups, & Symbols” style=”fancy”]
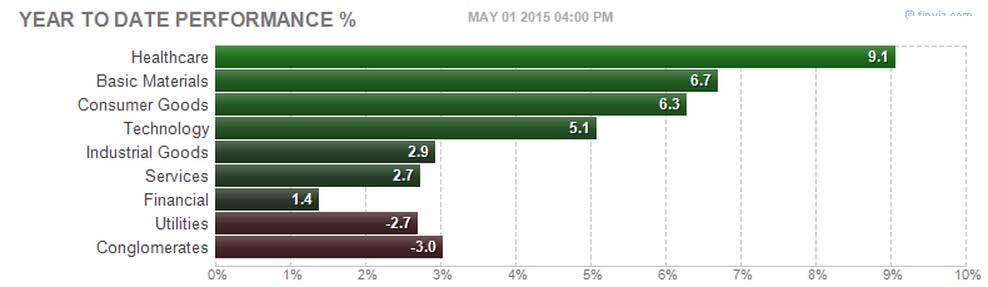
[su_heading style=”modern-1-dark” size=”18″]Strongest Sectors [/su_heading]
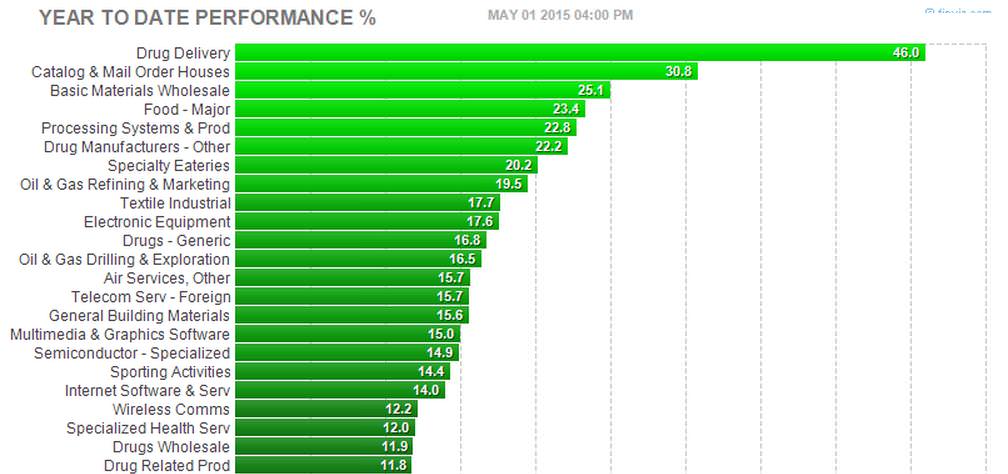
[su_heading style=”modern-1-dark” size=”18″]Strongest Groups [/su_heading]
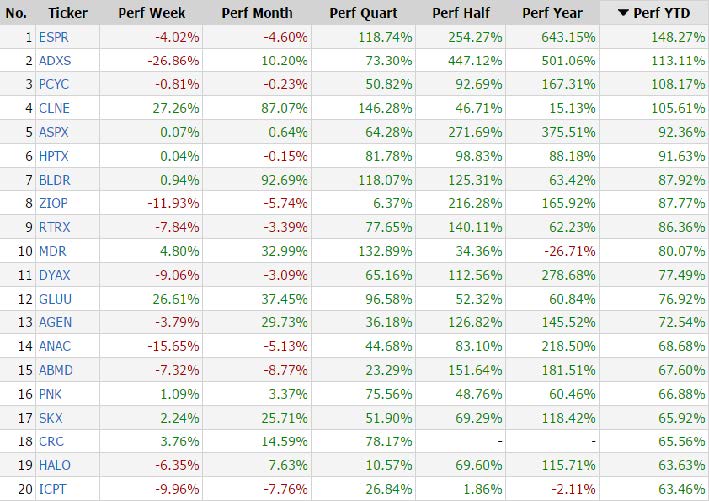
[su_heading style=”modern-1-dark” size=”18″]Strongest Performing Symbols This Year [/su_heading]
These are the top 20 strongest performing tickers on a year-to-date basis that are trading over $5, average daily volume over 500k and have a market cap >300M (Small cap-Mega Cap)
[/su_spoiler]


