

[su_spoiler title=”Monday-Wednesday’s Action: Economic & Earnings Data Remains Mixed” style=”fancy”]
Stocks rallied on Monday and overcame earlier weakness after the Dow Jones Industrial Average crossed the unchanged line over 30 times before noon EST. Investors continue to look at incoming “data” for clues on what the Fed’s next move will be. Personal income rose by 0.4%, beating estimates for 0.3%. Consumer spending month over month was flat, missing estimates for a gain of 0.5%. The PMI manufacturing index came in at 54, beating estimates for 53.8. The ISM manufacturing index came in at 52.8, beating estimates for 51.8. The big ‘beat’ of the day came from construction spending; it rose 2.2% easily beat the Street’s forecast for a gain of 0.7%. The better than expected reading on construction spending bodes well for the ongoing housing recovery and followers stronger than expected housing starts and permits data released for the same period. Stocks fell on Tuesday but traded between positive and negative territory after optimism spread regarding a potential deal on Greece and investors digested the latest round of economic data. In April, f actory orders fell -0.4%, missing estimates for a decline of -0.1%. Auto sales for May jumped nicely and showed the strongest pace in nearly a decade. Auto sales rose to 14.2M, beating estimates for 13.6M. The big uptick was largely due to trucks and SUVs. According to CNBC, General Motors sales rose 3 percent for the month while Fiat Chrysler Automobiles saw a 4 percent increase. Ford sales declined 1 percent. The Dow Transports, which has been lagging badly of late, reversed losses and closed higher. Airline stocks continued to get hit after the Federal Aviation Administration’s temporary halt of United Airlines ($UAL) flights. Stocks rallied on Wednesday after the European Central Bank (ECB) held rates steady and continued their bond buying program (QE). In the U.S., the ADP, the country’s largest private payrolls company, said employers added 201k, new jobs in May, beating estimates for a gain of 200k. Markit’s ($MRKT) PMI service index came in at 56.2, missing estimates for 56.5. The ISM non-Mfg index came in at 55.7, missing estimates for 57.2. The Fed’s beige book downgraded the strength of the economy which virtually removes the chance of a June rate hike. The U.S. trade gap fell by 19% that was the largest in 6 years and eased concerns of a Q2 slowdown. In other news, the Organization of Economic Cooperation and Development (OECD), downgraded their outlook for the global economy. The Paris-based group cut its growth forecast for the U.S. to 2% in 2015, down from 3.1% forecast in March and 2.8% from 3% in 2016. The OECD also cut its forecast for the global economy to +3.1% in 2015 and +3.8% in 2016. In November, it had forecast +3.6% and +3.9%.
[/su_spoiler]
[su_spoiler title=”Thursday-Friday’s Action: OECD & The IMF Downgrade Global Economy; Jobs Beat Estimates” style=”fancy”]
Stocks fell hard on Thursday after the IMF publicly urged the U.S. Fed to wait until 2016 to begin raising rates. The IMF also cut its U.S. 2015 economic growth forecast to 2.5%, down from April’s estimate of 3.1%. Separately, optimism regarding a Greek deal faded after the small nation-state said it will bundle its four debt payments to the International Monetary Fund due this month into a single payment. Greece’s EU/IMF lenders continue to urge Athens to commit to sell off state assets, enforce pension cuts and press on with labor reforms. These austerity measures would cross the Greek government’s so-called “red lines” which is the sticky point in the ongoing negotiation right now. Before the bell, weekly jobless claims came in at 276k, below expectations and last week’s 282k. U.S. non-farm productivity slid at a -3.1% annual rate in the first quarter, down sharply from the previously reported 1.9% rate. In M&A news, Dish Network ($DISH) is in talks to merge with T-Mobile ($TMUS). Before Friday’s open, the Labor Department said U.S. employers added 280k new jobs in May, beating estimates for 220k.
[/su_spoiler]
[su_spoiler title=”Market Outlook: The Central Bank Put Is Alive And Well” style=”fancy”]
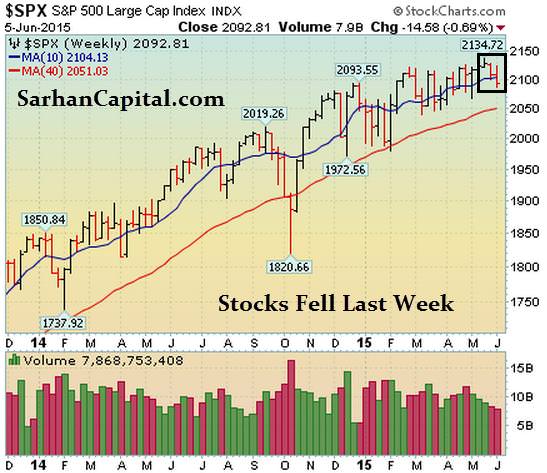
Remember, in bull markets surprises happen to the upside. This has been our primary thesis since the end of 2012. We would be remiss not to note that this very strong bull market is aging (celebrated its 6th anniversary in March 2015) and the last two major bull markets ended shortly after their 5th anniversary; 1994-2000 & 2002-Oct 2007). To be clear, the central bank put is very strong, and until material damage occurs, the stock market deserves the longer-term bullish benefit of the doubt. As always, keep your losses small and never argue with the tape.
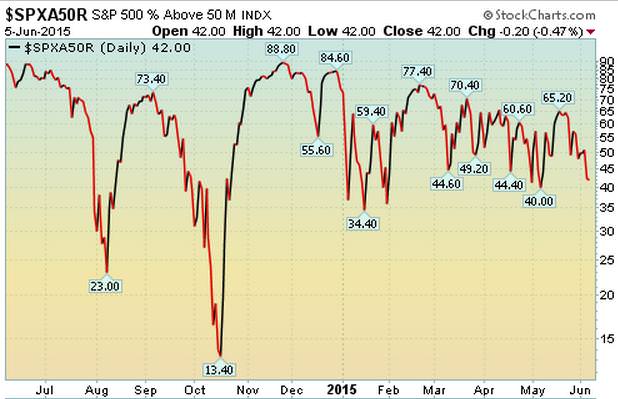
42% Of Stocks in the S&P 500 Are Above Their Respective 50 DMA
(Market Tends To Turn When This Reading Gets Above 70% or Below 40%)
Observation: Readings above 70% usually (not always) correspond with a short-term pullback Conversely, reads below 40% usually (not always) correspond with a short-term bounce
[/su_spoiler]
[su_spoiler title=”Big Stock List” style=”fancy”]
- AAPL – Fell last week as it pulls into its 50 DMA line
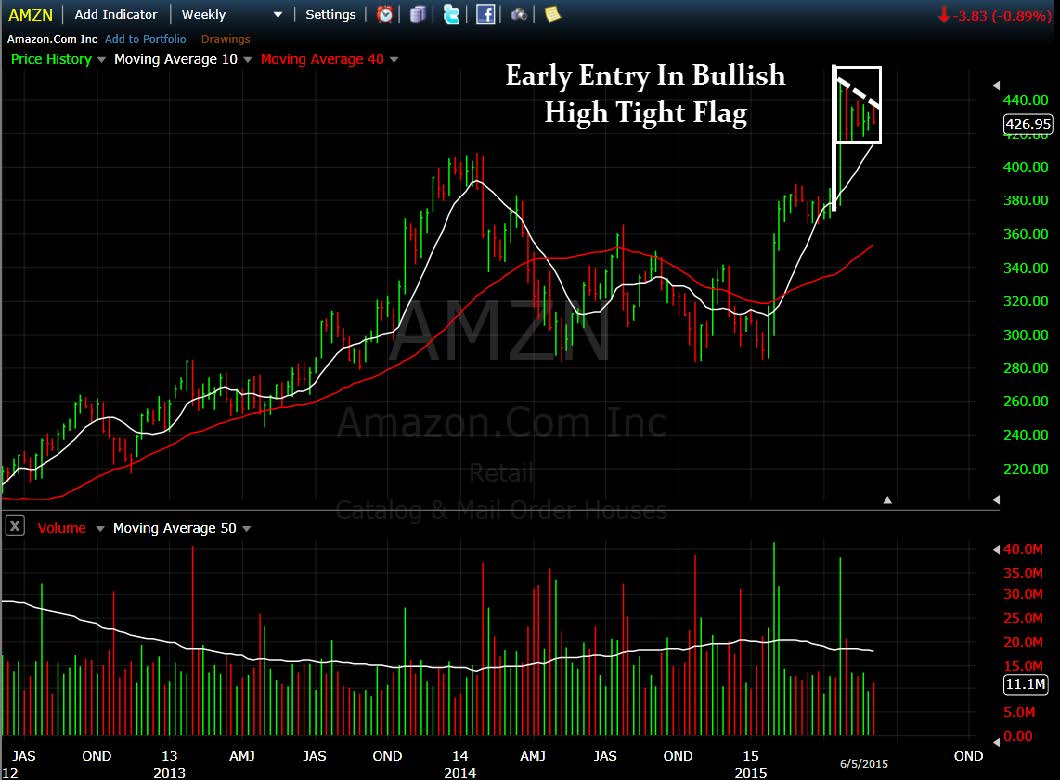
- AMZN – Continues to form a very BULLISH looking 7-week handle
- EA – Edged higher last week as it trades near $63/share for the past five weeks
- FB – Rallied last week and jumped above its downward trendline (early entry) and its 50 DMA line
- FLT – Snapped a 5-week losing streak and rallied into its 50 DMA line
- GOOGL – Rallied last week but continues basing as it trades near its 50 and 200 DMA lines
- ILMN – Nice rally for 6th straight week as it gets reading to hit another fresh record high
- NFLX – 6th straight weekly gain. Tried to break out of a short 2-week tight pattern
- SBUX – Edged into new high ground after finding support above its 50 DMA line in May
- TSLA – Healthy action continues…Feels extended in the short term. Golden cross as 50 DMA line just crossed above 200 DAM line. Volume drying up VERY nicely here as it digests its recent rally
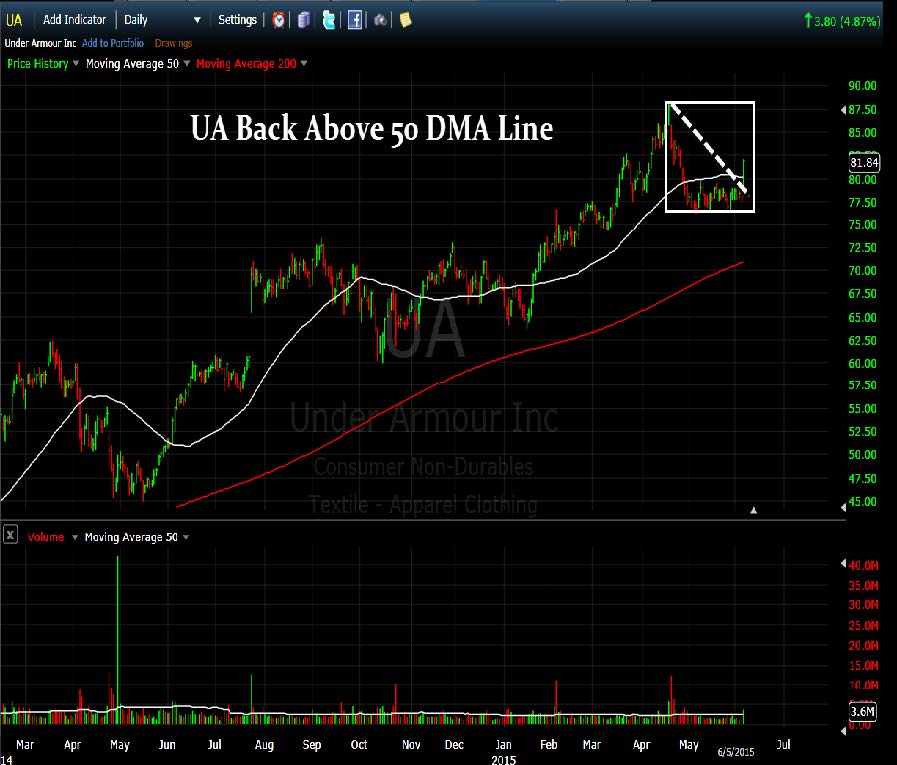
- UA – Gapped above its 50 DMA line on Fri. We wrote last week “A new technical buy signal will be triggered when it gets back above its 50 DMA”—
- V – Fell last week as it continues pulling back into its 50 DMA line. Forming a little handle
[/su_spoiler]
[su_spoiler title=”17 New Setups” style=”fancy”]
These hand-picked stocks are carefully selected to help with your idea generation and offer you additional setups each week. The setups are based on our proprietary criteria and offer advanced (dotted line) & classic long and short entry points (solid line). Short patterns are typically mirror images of long patterns.
Note: Please Verify All Earnings Dates/Data from Multiple Sources for Every Stock in all our report(s).
Charts Courtesy of FreeStockCharts.com and/or Stockcharts.com
AMZN Working Order & Setup:
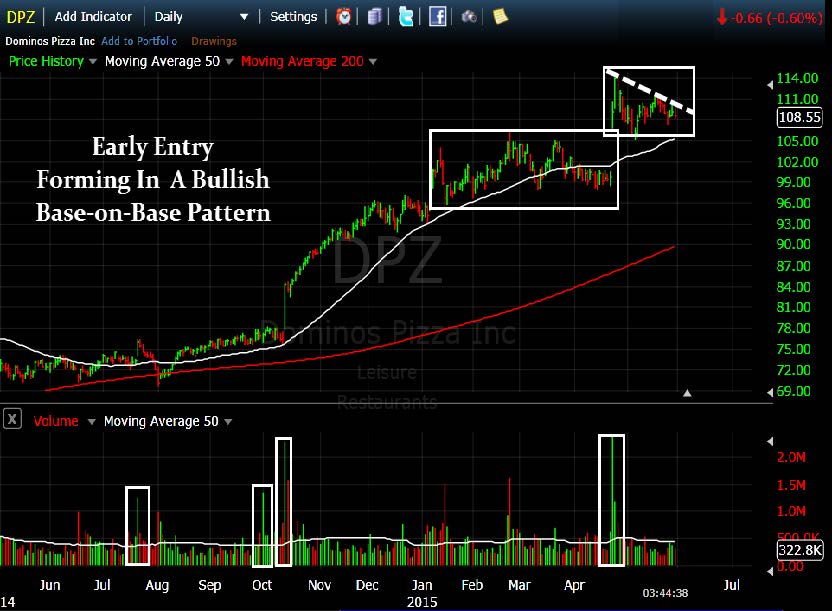
DPZ Working Order & Setup: New Early Entry Forming
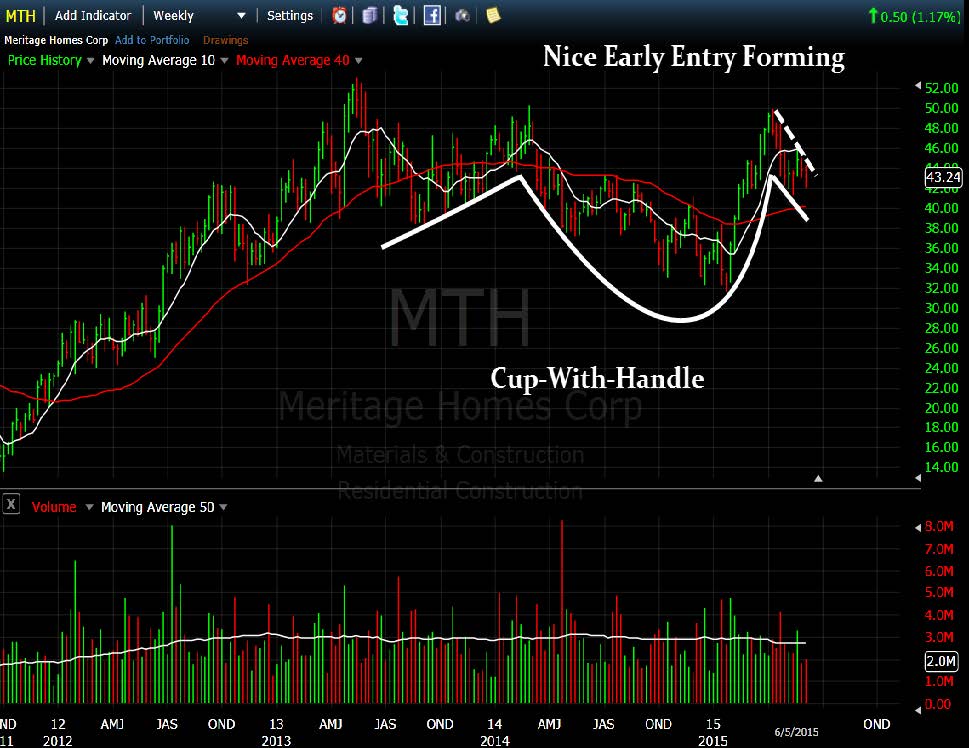
MTH Working Order & Setup: New Early Entry Forming
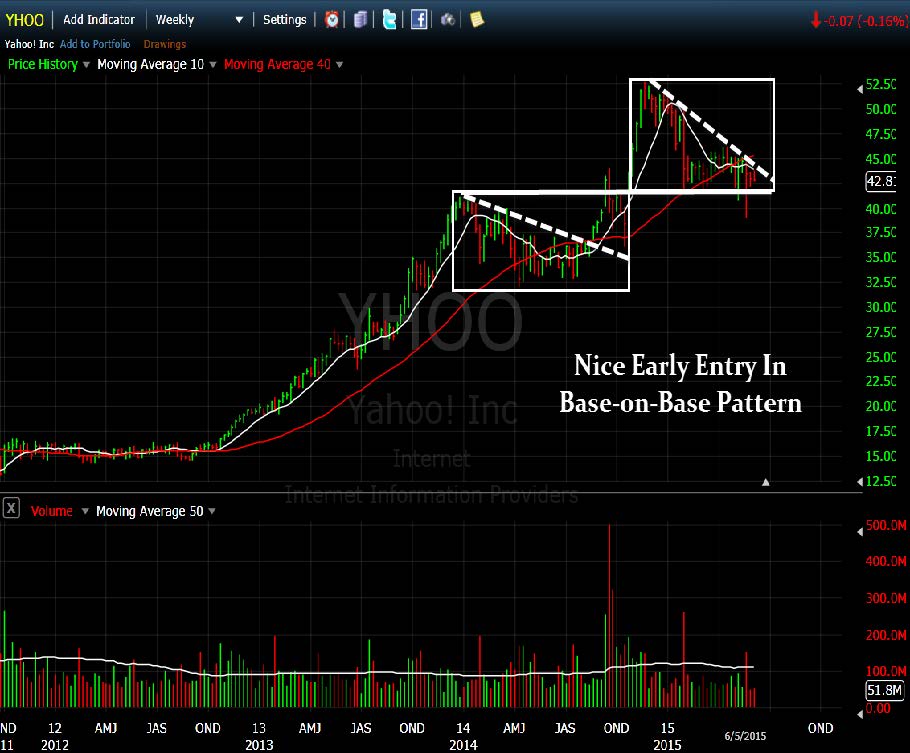
YHOO Setup: New Early Entry Forming In Bullish Base-on-Base
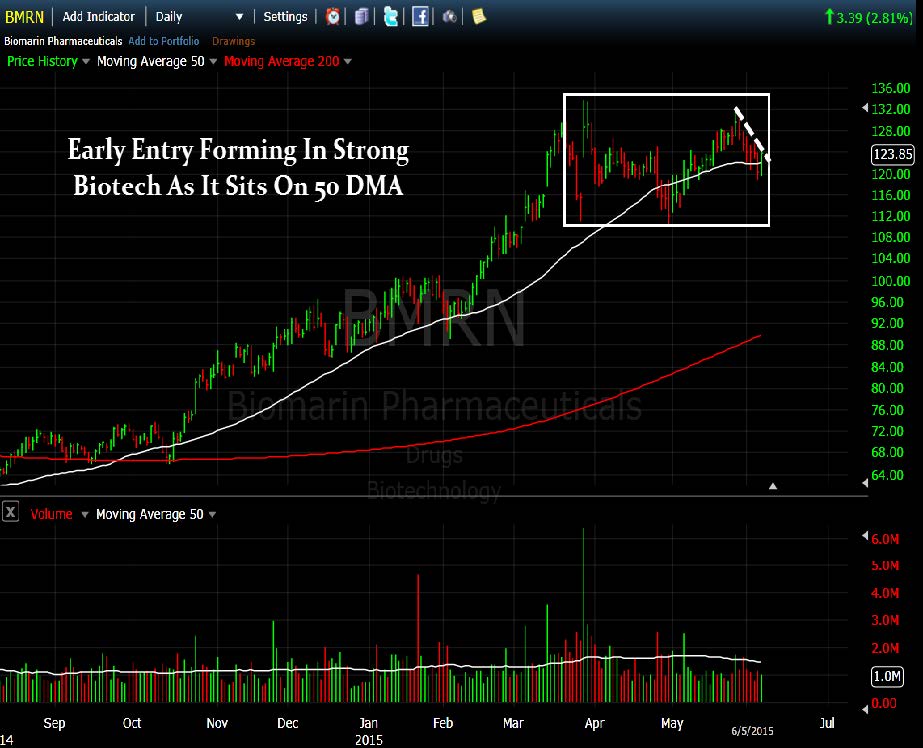
BMRN Setup: Early Entry In Flat Base
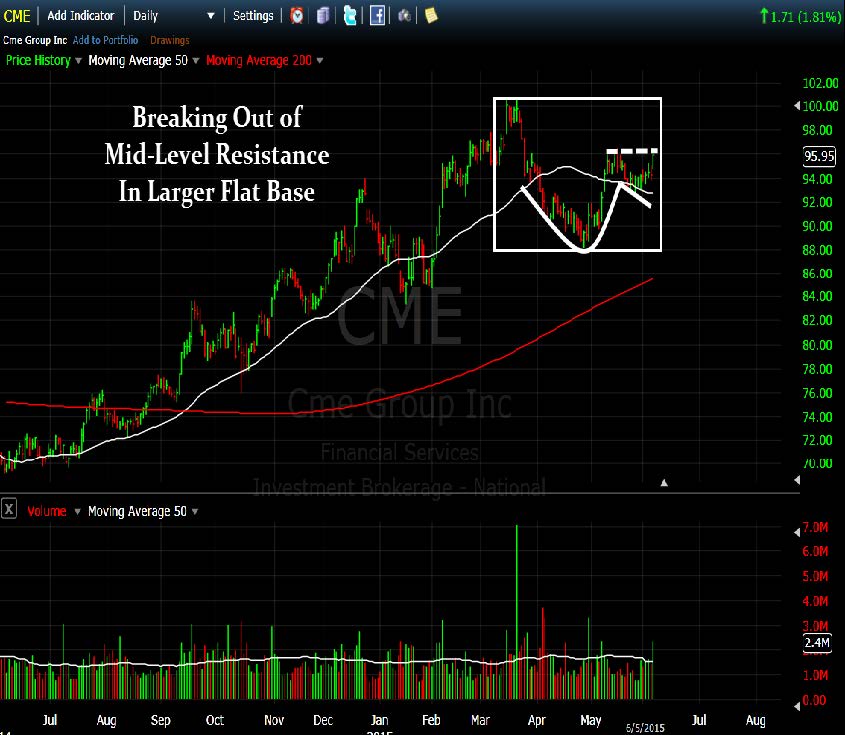
CME Setup: Breaking Out Of Mid-Level Resistance
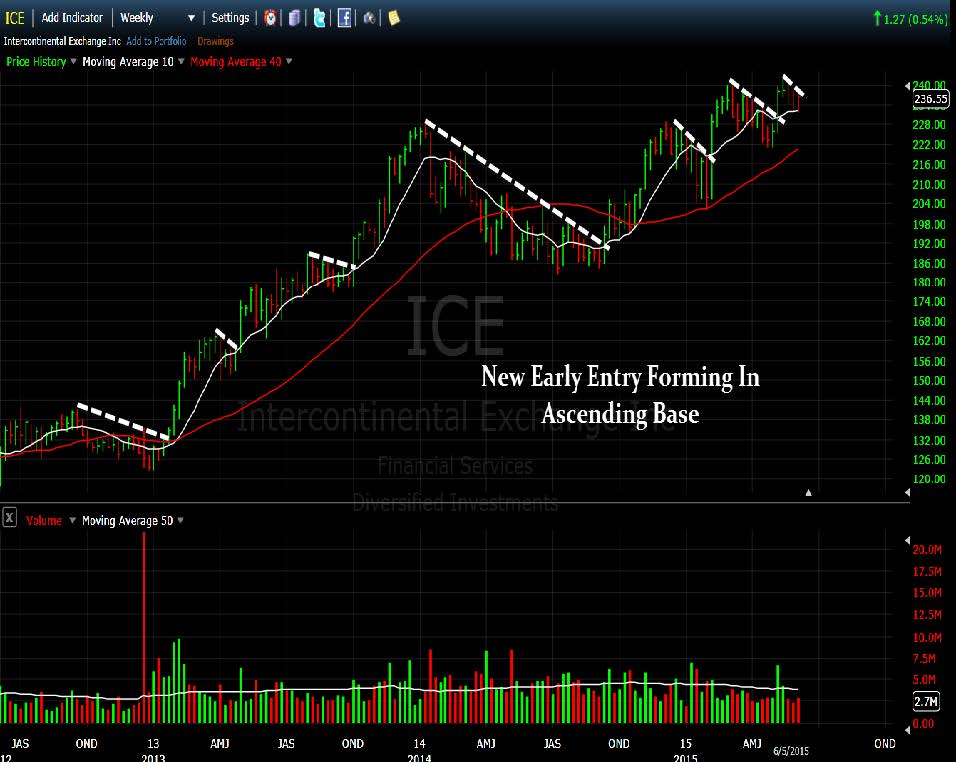
ICE Setup: Early Entry Forming In Bullish Ascending Base
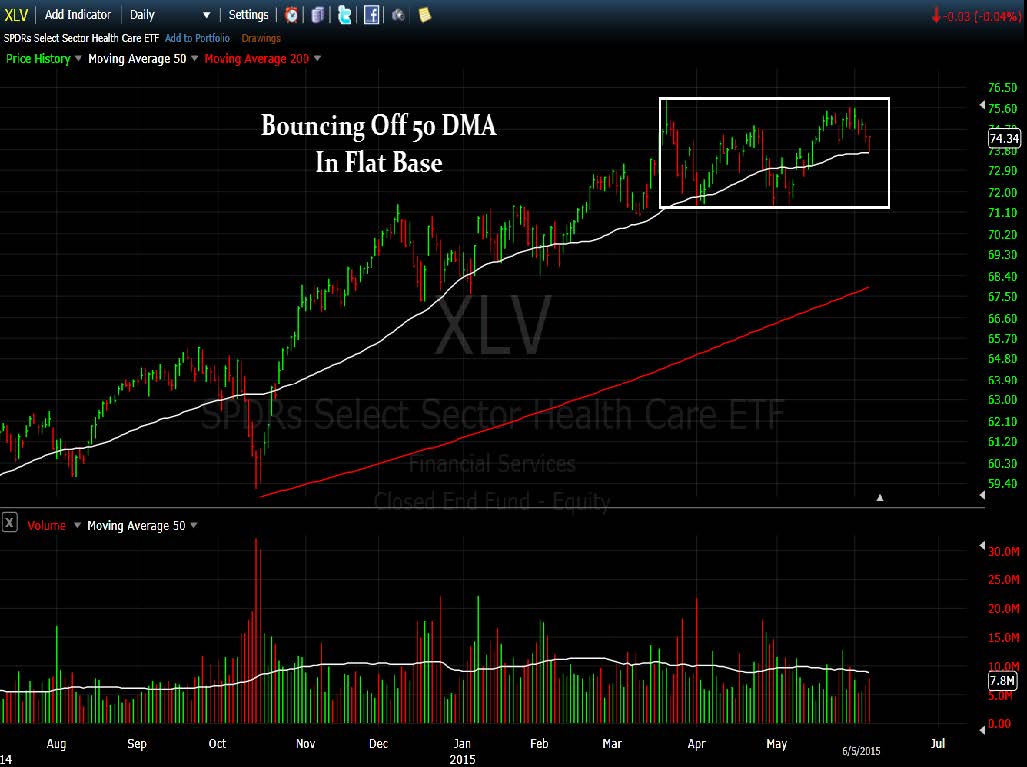
XLV Setup: Sitting on 50 DMA In Middle Of Flat Base
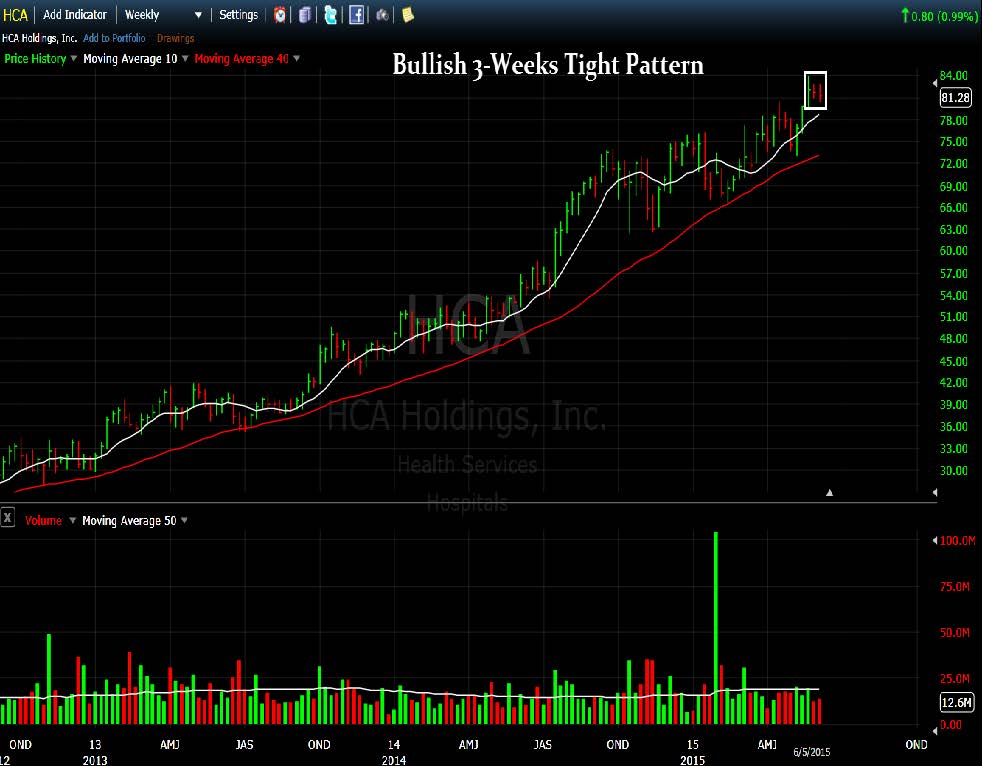
HCA Setup: Bullish 3-Weeks Tight Pattern Forming
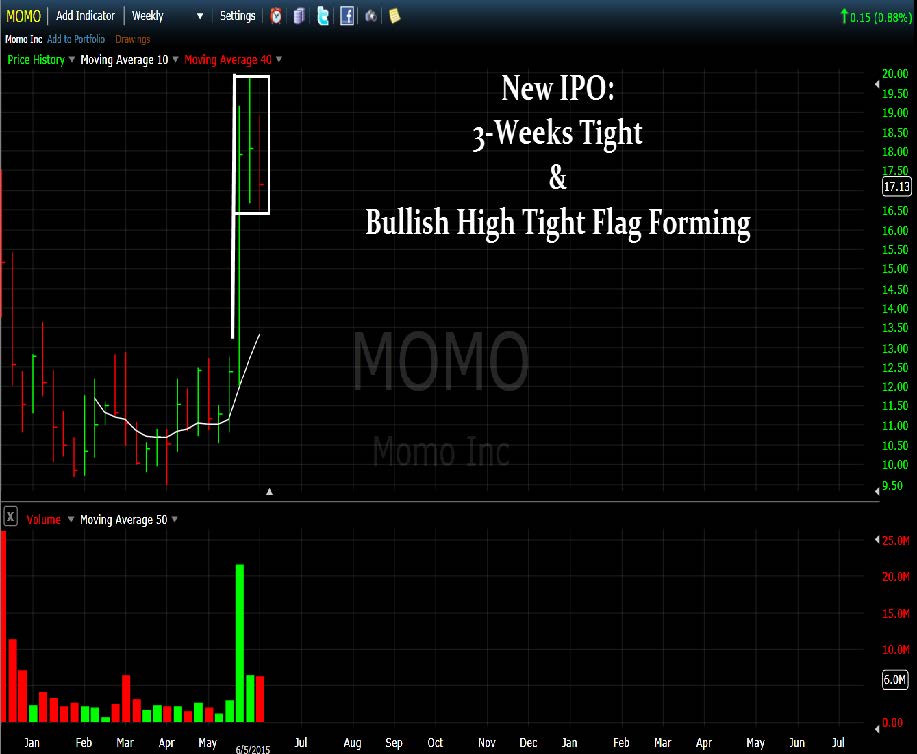
MOMO Setup – Bullish High Tight Flag & 3-Weeks Tight Forming
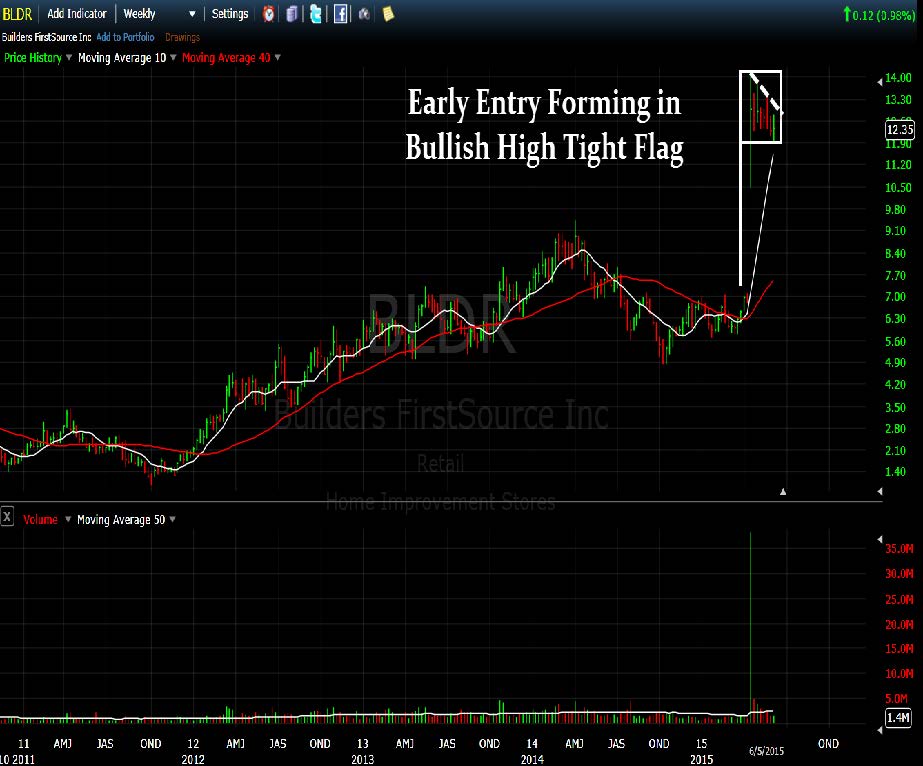
BLDR Setup – Early Entry Forming In Bullish High Tight Flag Pattern
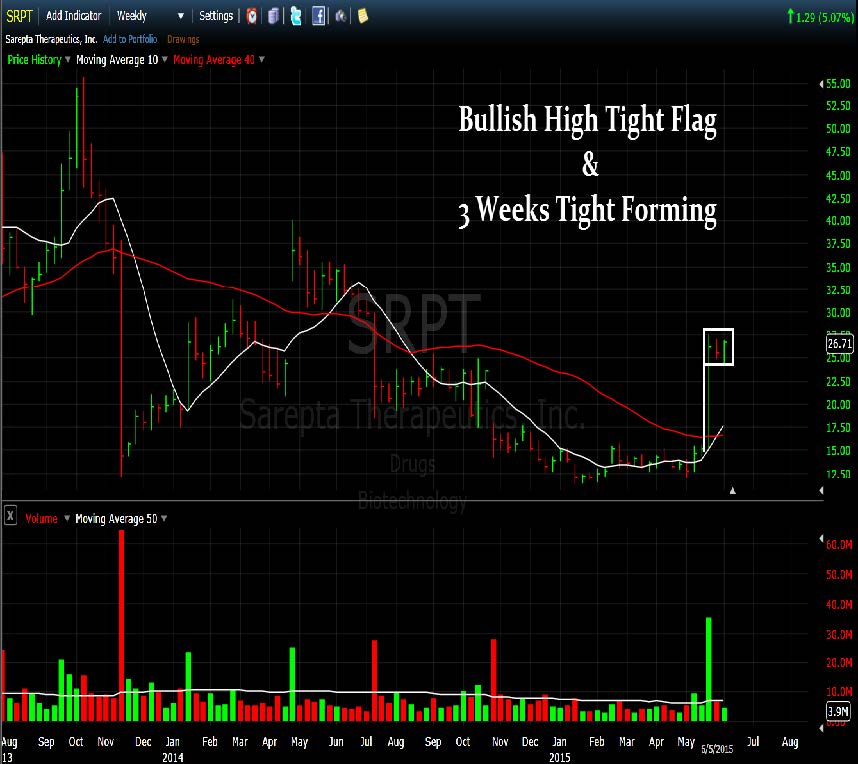
SRPT Setup: High Tight Flat & 3 Weeks Tight Forming
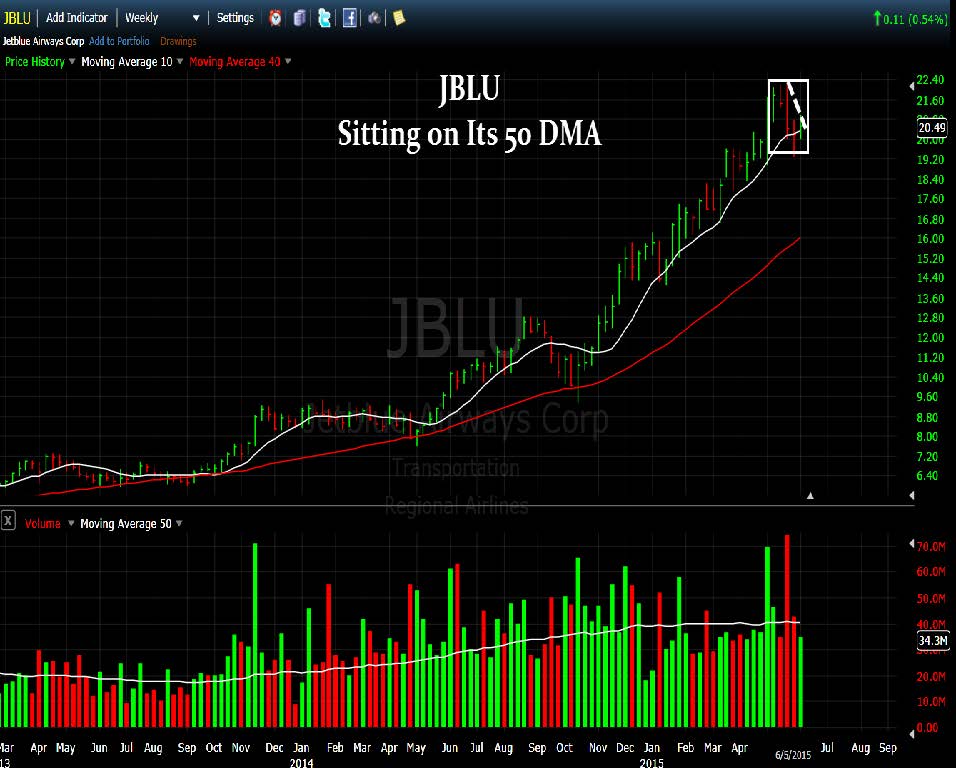
JBLU Setup – Nice Early Entry Forming
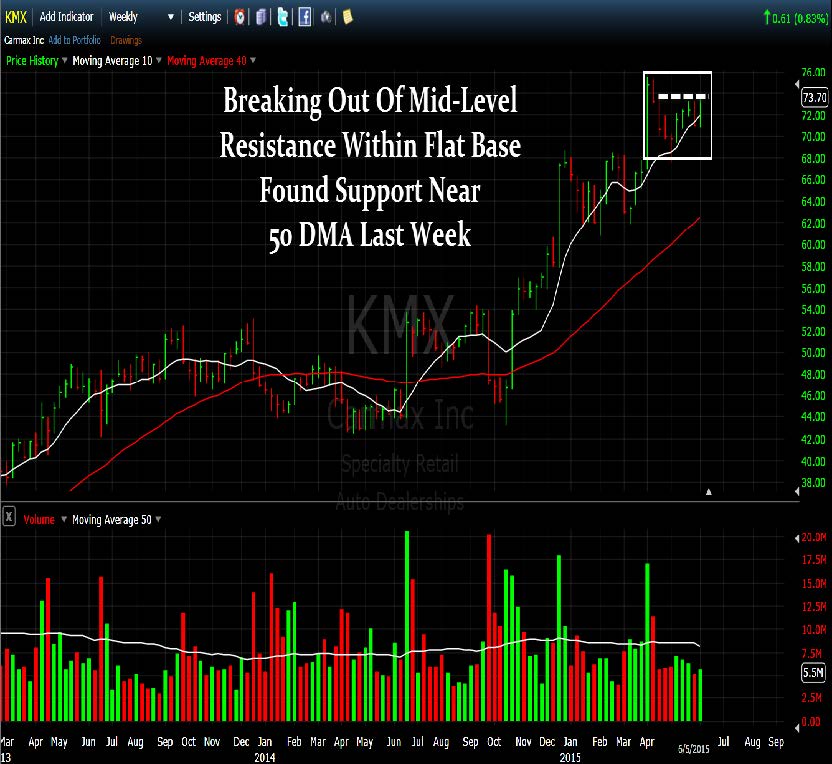
KMX: Breaking Out Of Mid-Level Resistance In Flat Base
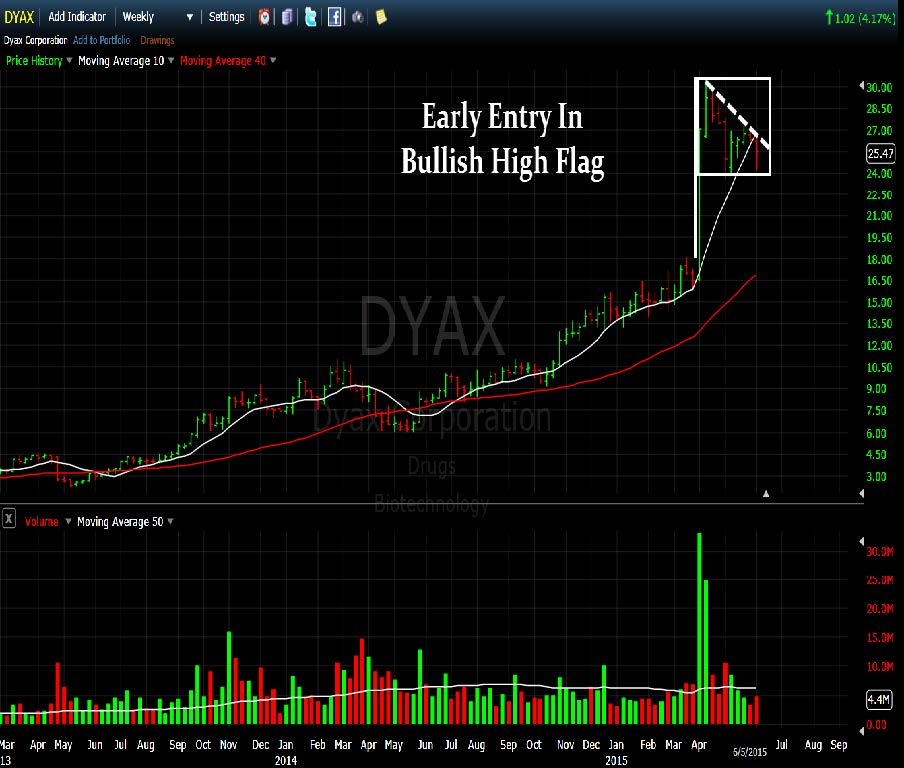
DYAX: Early Entry In Bullish High Flag Pattern
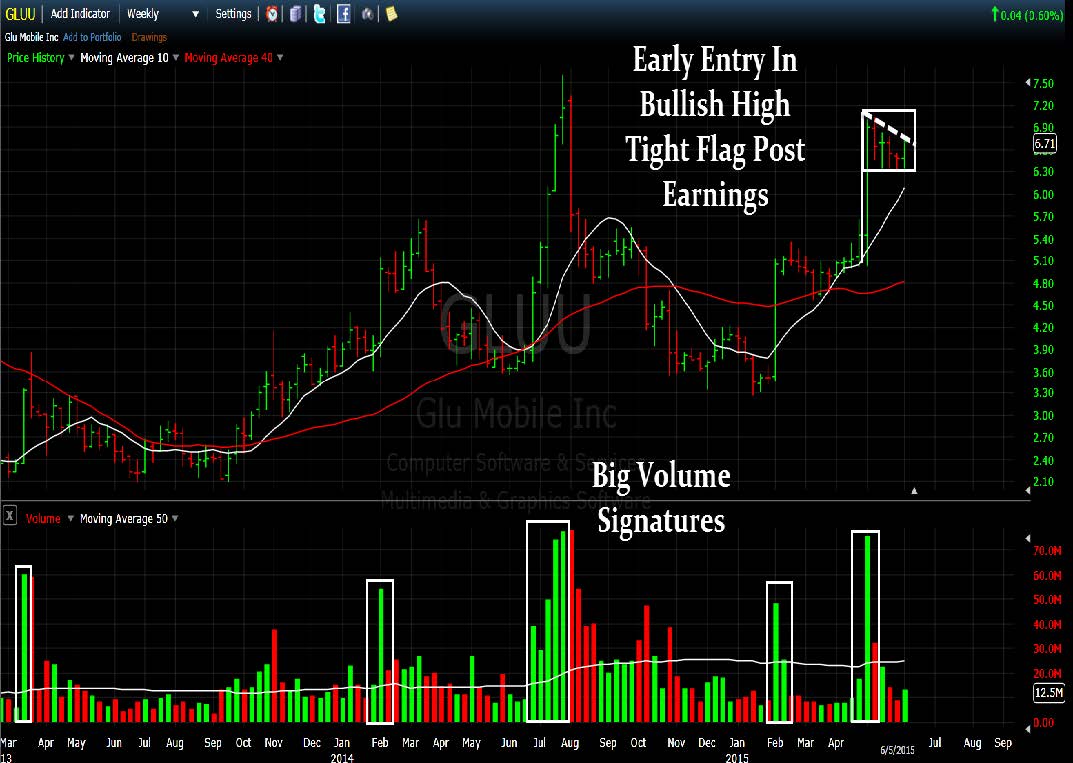
GLUU: New Early Entry Forming In Bullish High Tight Flag Post Earnings
UA: New Jumped Above Early Entry & 50 DMA Line Last Week
[/su_spoiler]
[su_spoiler title=”Strongest Sectors, Groups, & Symbols” style=”fancy”]
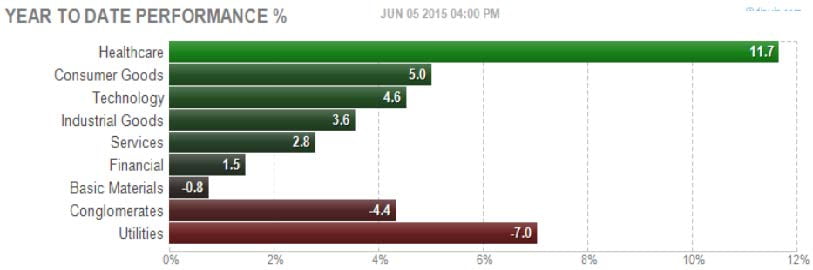
[su_heading style=”modern-1-dark” size=”18″]Strongest Sectors [/su_heading]
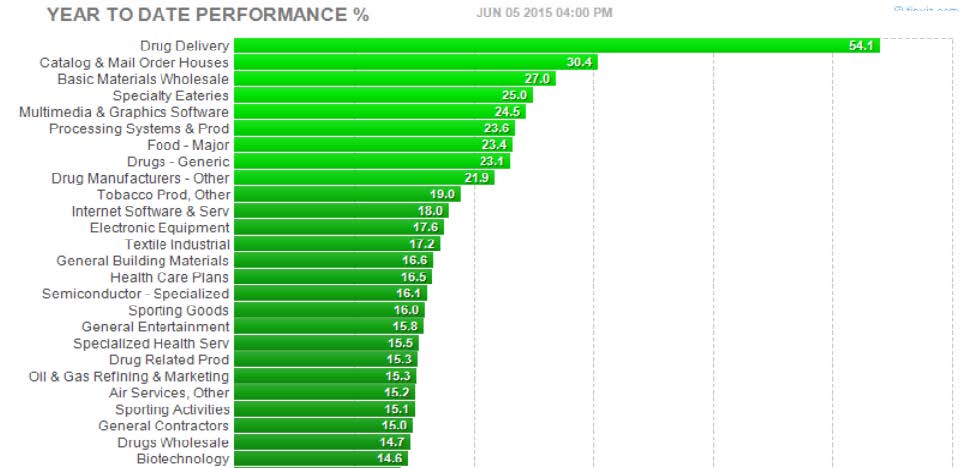
[su_heading style=”modern-1-dark” size=”18″]Strongest Groups [/su_heading]
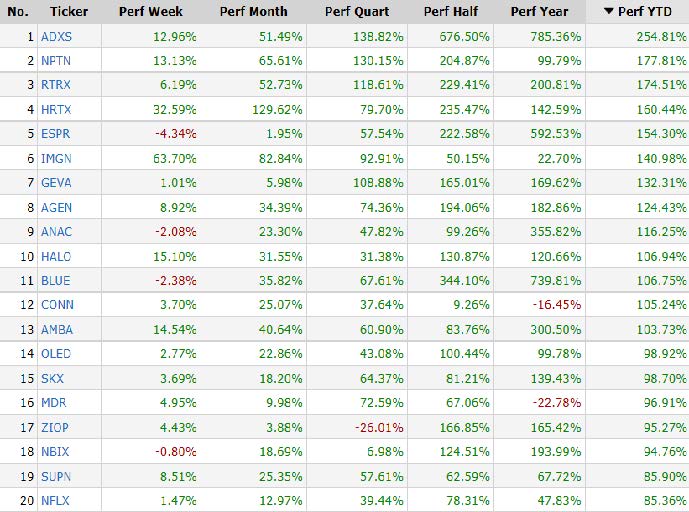
[su_heading style=”modern-1-dark” size=”18″]Strongest Performing Symbols This Year [/su_heading]
These are the top 20 strongest performing tickers on a year-to-date basis that are trading over $5, average daily volume over 500k and have a market cap >300M (Small cap-Mega Cap)
[/su_spoiler]


