Thanks again for signing up for Advanced Stock Reports! Your success and outperformance of the market is our goal. We are here to work together with you and help you succeed! We will do everything we can to ensure sure that happens!
Here, I’m going to walk you through the reports step by step, sharing all of the details, and all of the ways I personally use the reports to succeed.
PART 1: The Weekly Report
The weekly report is broken down into a few key sections. We’ll go through each of them in detail. They include:
- FLS Playbook
- Recent Pullbacks & Rallies / Chart of the Week
- Year to Date Scorecard and Weekly Review
- FLS Leaders List
- Elite Stock Setups
Section 1: FLS Playbook
PRO TIPs from Mike: I find this section useful in a few ways.
- You get to see the model portfolio in action along with the full trading plan. You know ahead of time where and when to enter, how to manage each trade for the life of the trade, when to exit, and how much to risk! I started following the model portfolio trade for trade in one of my personal accounts in 2016 and 2017. In 2016 I doubled the S&P 500 and in 2017 I TRIPLED the S&P 500! I started a series on my YouTube Channel showing the entire path to Tripling the S&P 500 in 2017. Check it out!
- The whole week is summarized in a single page. This has saved me hours of research time!
- Seeing how the model portfolio is allocated (heavy, light, or in cash) is a great gauge of the overall health of the market. In choppy trading environments that are not conducive to making money, the model portfolio moves to cash. Seeing this in real-time has saved me a bundle!
DETAILS:
- Market Summary
- Model Portfolio Strategy/Tactics Update
- Open Positions and Performance
- Working Orders
Market Summary: the Market Summary is a great place to start which is why it is front and center when you open up the report. It summarizes all of the key events of the prior week and provides you with Adam’s overall feel, take, and strategy moving forward.
Portfolio Update: Adam treats the Model Portfolio the same as he would a real portfolio and trades it accordingly. It is traded on an intermediate-term time frame. Most winning trades are held for several months. Some a little less, some can be over a year. Losing trades are typically exited within 1-2 weeks.
In the portfolio update, you receive updated strategy and tactics for the week.
Positions: Here you’ll see the positions that are currently held by the Model Portfolio, if they have a gain or a loss, and where we plan to exit if the market moves against us. This makes it very convenient to follow along and see how we adjust risk in real-time.
Working Orders: as market conditions change, the model portfolio will add exposure. Any stock or ETF we are interested in for the model portfolio is shown here. We provide the ticker symbol, whether we plan to be long or short, the price we plan to enter, the price we plan to exit if we’re wrong, and the percentage risked (distance between entry and exit).

Section 2: Chart of the Week
This section displays some of the most relevant themes presently influencing market for the week.

Section 3: Year to Date Scorecard and Week in Review
PRO TIP from Mike: If you like to dig in and get a thorough understanding of what is happening in the market and why, this is where you’ll find those answers. All of the most consequential happenings are highlighted here day by day.
This section summarizes several key points about the general market including:
- Short and intermediate-term direction
- Important support levels
- Crowd behavior index
- Global Macro Update including directional analysis of stocks, bonds, currencies, softs, energies, metals, and grains
It also kicks off a detailed Weekly Review section where we analyze the market day by day.


Section 4: FLS Leaders List
This is a list of the big cap stocks that are currently leading the market.
PRO TIP from Mike: I like to go through this list and see what kinds of overarching trends are developing. Is there an abundance of stocks in one particular sector? If so, that’s a clear sign that the market is favoring that sector and these are the leaders among it. One of our goals is to trade leading stocks, this helps us do that.

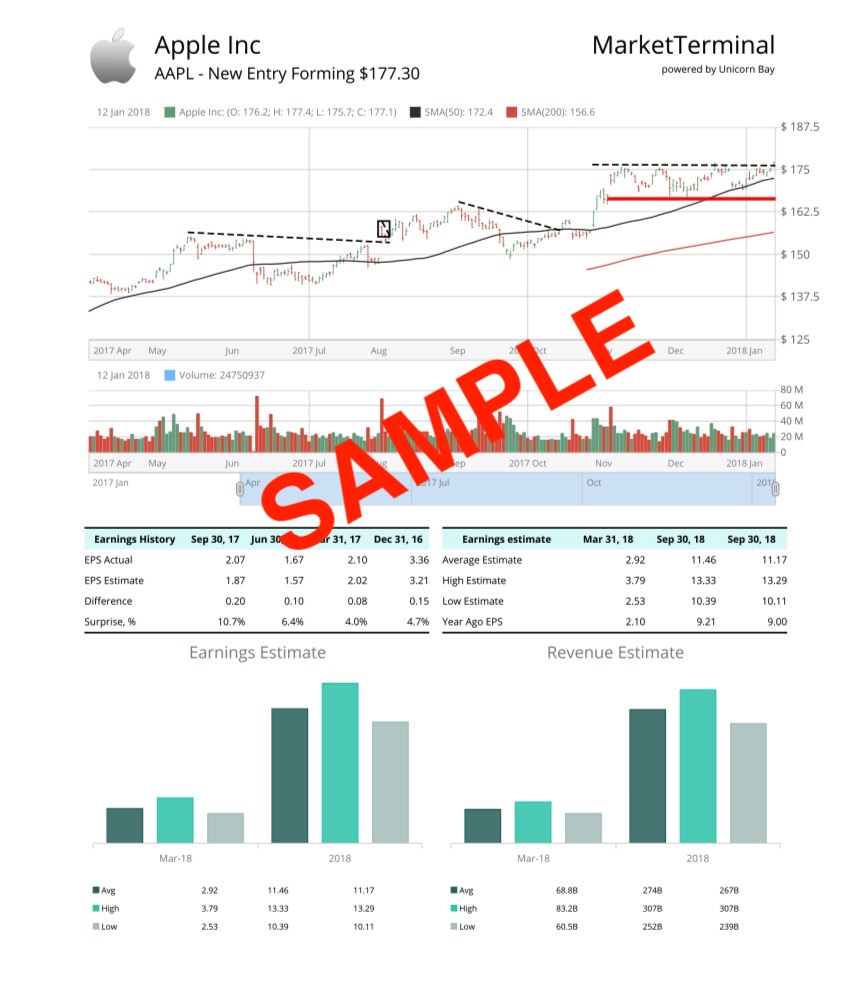
Section 5: Elite Stock Setups
This section includes 10 or more hand-picked stocks/ETFs that are setting up in potential low risk, high reward patterns. All of the charts are annotated and provide the EXACT Advanced Entry Point as well as the major support level. All of the key fundamental data is provided as well.
PRO TIP from Mike: We’ve had some pretty stellar ideas come out of this section!
Adam highlights what he sees as the best setups the market has to offer each week. It is up to you to decide if/when you will act. That said, you are always free to reach out to us with any questions you may have.

PART 2: Intra-Week Updates
Intra-week updates are typically sent on Tuesdays and Thursdays and include a Market Update and updates on the Model Portfolio’s performance, protective stops, as well as any outstanding working orders.