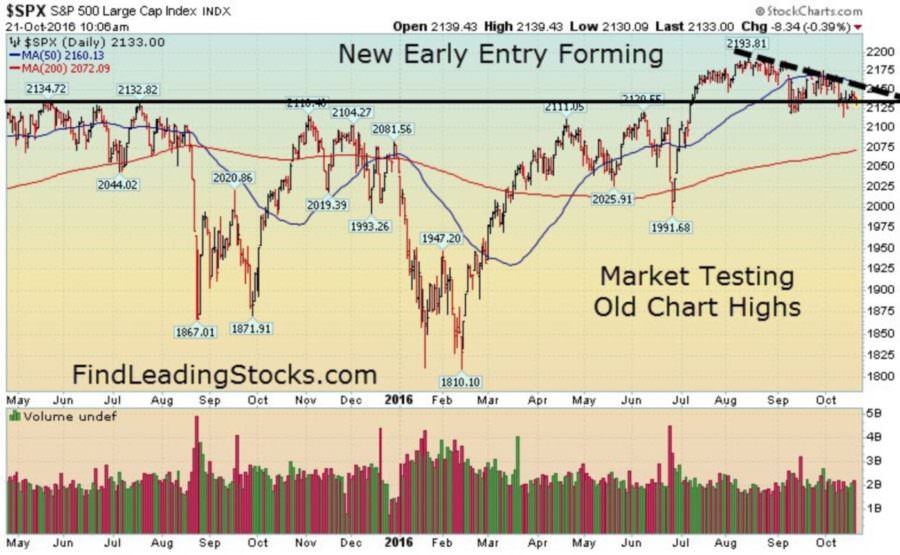
The tape remains very split. This is the 7th consecutive week that the S&P 500 and Dow Jones Industrial average are below their respective 50 DMA lines. Major support is October’s low and if that level breaks the next level to watch is the longer term 200 DMA line. The Nasdaq 100, on a relatively basis, is acting better. More and more sectors are rolling over with clear leadership in the semiconductor group and other tech stocks.
So far, earnings season remains mixed at best with a clear majority of stocks (and the major indices) are down since earnings season began. Our longstanding clients know that every earnings season we keep a list of “strong” and “weak” performing stocks after earnings. Presently the “weak” list greatly outnumbers the “strong” list. We are still in the early part of earnings season so anything could change but until buyers show up- defense is king.
A Closer Look at What Happened Last Week…
Mon-Wed Action:
 On Monday, stocks were mostly lower as investors digested the latest round of economic and earnings data. Before the open, Bank of America (BAC) reported earnings and beat estimates but the stock didn’t rally. Around mid-day, Fed Vice Chair Stanley Fischer warned investors that if rates stay low for a long time it could lead to a deeper recession and make the economy more vulnerable in the future. Economic data was weak. The Empire State Manufacturing survey fell to -6.8, missing estimates for 1.0. Elsewhere, industrial production slid to 0.1%, missing estimates for 0.2%.
Stocks rallied on Tuesday, helped by the latest round of earnings data and tame inflation data. Shares of Netflix (NFLX), Domino’s Pizza (DPZ), Goldman Sachs (GS) and United Health (UNH) all rallied nicely after reporting earnings. Meanwhile, shares of Johnson & Johnson (JNJ) and IBM (IBM) were some of the well-known stocks that fell after reporting earnings. Elsewhere, The Labor Department said its Consumer Price Index rose 0.3%, matching estimates. Meanwhile, the so-called core CPI only rose by 0.1%, missing estimates which helped allay inflation concerns.
Overnight China said its economy grew by 6.7% which was in between the government’s estimate of 6.5-7%. Stocks rallied on Wednesday, helped by a large rally in crude oil. Crude oil broke out to a 15-month high after the Energy Information Administration reported a 5.3 million draw-down in inventory. Tighter supply concerns helped crude oil breakout and hit a fresh high for the year ahead of OPEC’s meeting next month (where they are projected to cap or cut supply). Elsewhere, earnings continued to be a mixed bag while economic data failed to impress. Housing starts came in at 1.047M, missing estimates for 1.180M which put pressure on a slew of housing stocks. Finally, the Fed’s Beige Book showed moderate economy activity.
Thur & Fri Action:
Before Thursday’s open, the European Central Bank (ECB) did nothing at its latest meeting which disappointed some investors (who wanted more easy money). Economic data was mixed. Jobless claims came in at 260k, missing estimates for 250k. The Philly Fed Index came in at 9.7, beating estimates for 7.0. Existing home sales came in at 5.470M, beating estimates for 5.35M. Finally, leading economic indicators came in at 0.2% matching estimates. On Friday, stocks opened lower but erased the losses in the afternoon.
Market Outlook: Tape Is Getting Weaker
The tape remains very split but weakened considerably in recent weeks. The fundamental driver continues to be easy money from global central banks but the law of diminishing returns may be setting in. Economic and earnings data remain mixed at best which means easy money is here to stay. As always, keep your losses small and never argue with the tape.


