
Stocks End Week Mixed As Trade Woes Divide Wall Street
The split tape I mentioned over the last few weeks continues as the Nasdaq and Small-Cap Russell 2000 hit fresh record highs while the S&P 500 and Dow Jones Industrial Average lag. The reason is simple: there remains a lot of uncertainty with respect to how this ongoing “trade war” that is brewing may unfold. The Dow and S&P 500 are more sensitive to these headlines while the Nasdaq and the R2k are less sensitive. Elsewhere, it was a big week for global central banks last week as they are all (slowly) moving away from the ultra-easy money era since the 2008 financial crisis. To be clear, they are still adopting an easy money stance, but the ultra-easy money period is now behind us (at least until the next recession or bear market).
A CLOSER LOOK AT WHAT HAPPENED LAST WEEK…
Mon-Wed Action:
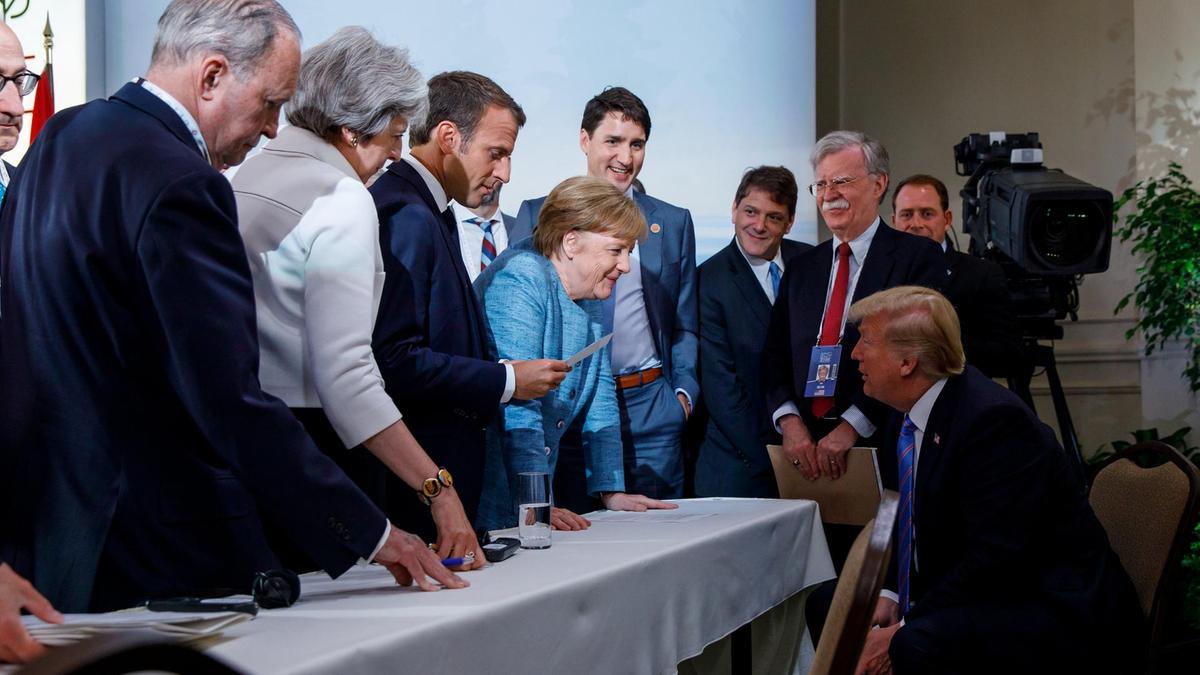 Stocks ended slightly higher on Monday after the G-7 meeting ended and Trump headed to Singapore for the N. Korea Summit. Overnight, Trump and Kim signed a historic deal and the market barely moved. On Tuesday stocks were quiet as the world waited for a busy week from global Central Banks. Separately, Tesla said it will slash 9% of its workforce and Elon Musk acknowledged that the company will have to turn a profit “some day.” Stocks fell on Wednesday after the Federal Reserve raised rates and signaled two more rate hikes may happen later this year.
Thur & Fri Action:
Stocks ended mixed on Thursday after the ECB slowly moved away from its ultra-easy money stance and President Trump signaled he may slap tariffs on China. By Friday’s open, $50 billion of tariffs were announced and now the world is waiting for China to respond. That concern largely dragged the market lower on Friday.
Market Outlook: Bullish Action
The small-cap Russell 2000 and Nasdaq both hit new highs which is bullish for the broader market. The other indices are acting well and still trading between important resistance (2018’s high) and important support (February’s low). Until either level is broken, I have to expect this sloppy, sideways action to continue. On the downside, the big level of support to watch is the 200 DMA line and then February’s low. For now, as long as those levels hold, the longer-term uptrend remains intact. Conversely, if those levels break, look out below. As always, keep your losses small and never argue with the tape.


