

We mentioned last week that the market was extended and due to pullback. Well, we got the pull back but it only lasted a few days. Stocks rallied last week as investors digested a slew of economic, earnings, and central bank data. The big take-away is that the bulls remain in clear control of this market and weakness should be bought (until this very strong bull market ends), not sold.
 Right now, we are in the middle of a major transition on Wall Street, which I call: The Great Hand-Off: from Monetary Policy to Fiscal Policy. The Fed, and a handful of other major central banks, met last week and the world barely noticed. Instead, nearly everyone was focused on D.C. and what President Trump is doing. Remember, Central Banks control monetary policy and the D.C. political machine controls fiscal policy.
So far, the action in the major indices is very healthy as pullback remain very shallow in both size (small % decline) and scope (short in duration). The next level of support to watch is the 50 day moving average for the major indices. Until that the major indices break, and close, below that level, the market remains in very good shape.
A Closer Look at What Happened Last Week…
Mon-Wed Action:
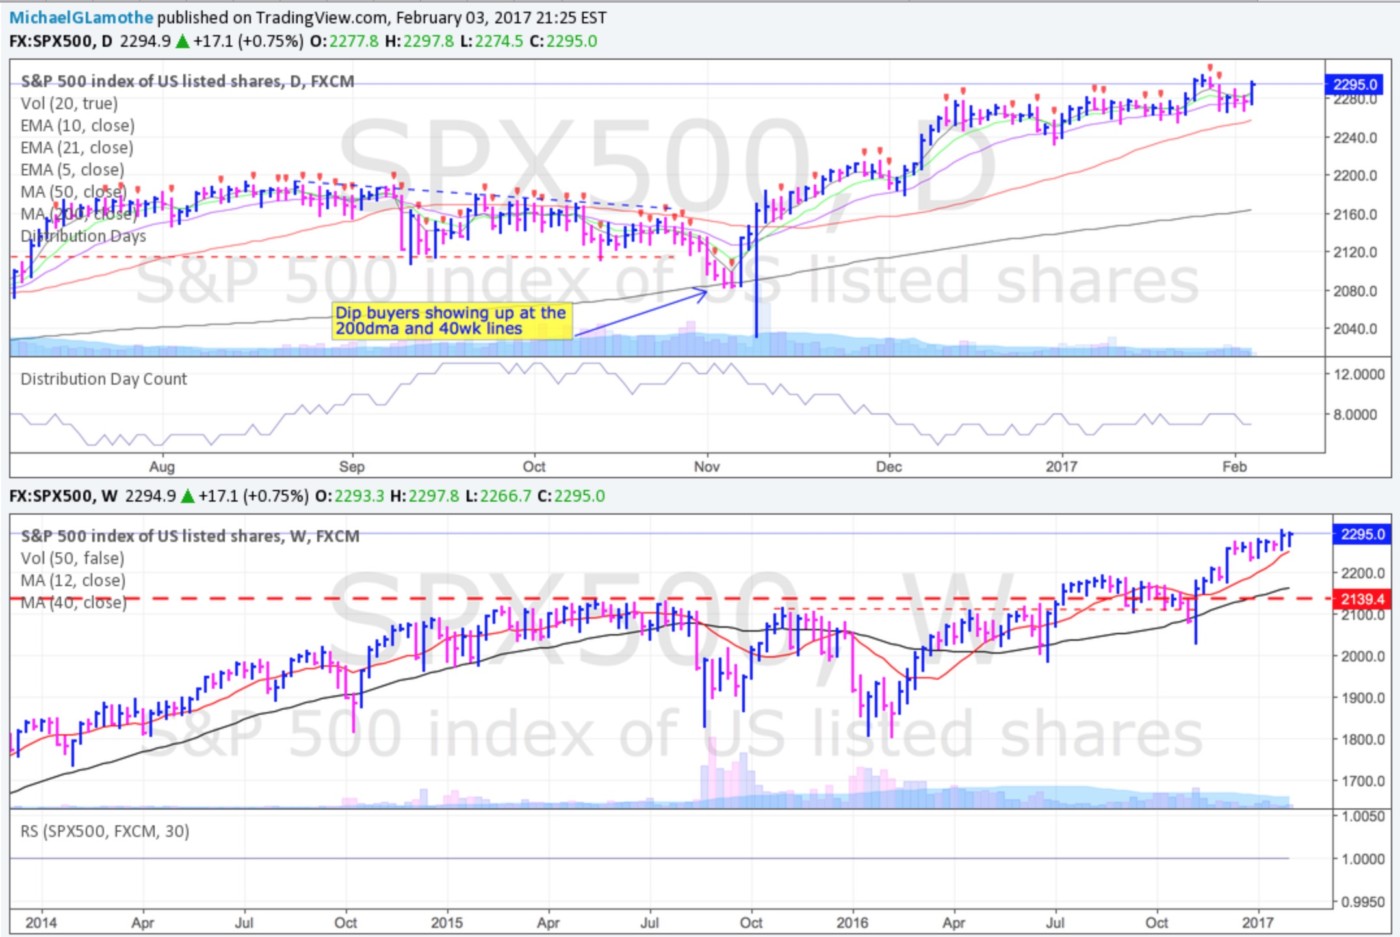 Stocks experienced the worst trading day in 2017 after Trump immigration backlash. The Dow negated its latest breakout and fell below 20,000. The S&P 500 also negated its latest breakout and is in pullback mode. The good news is that the market closed off its lows and the Dow, S&P 500 and Nasdaq, at this point, are still above their 50 day moving average lines. Meanwhile, the small-cap Russell 2000 closed just below its respective 50 DMA line.
Stocks closed mixed to mostly lower on Tuesday as investors continued to digest the latest round of earnings and economic data. Overnight, the Bank of Japan concluded its latest meeting and did not make any changes to monetary policy.
In economic news, U.S. labor costs rose in the fourth quarter but missed estimates. The Labor Department said the Employment Cost Index, the broadest measure of labor costs, rose +0.5% after rising +0.6% in the third quarter. Separately, the Chicago PMI adjusted January index came in at 50.3, lower than December’s 53.9 reading. Finally, consumer confidence hit 111.8, below an estimate of 113.
After the close, Apple (AAPL) gapped up after reporting earnings. Stocks closed mostly higher after Apple (AAPL) surged 6% and the Fed held rates steady. Overall, earnings are on track to grow 7% in Q4 2016 which means the earnings recession is over. The Fed held rates steady and said “Measures of consumer and business sentiment have improved of late.” This was led many people to believe the Fed may begin “normalizing” rates sooner rather than later.
Thur & Fri Action:
 Stocks closed mostly flat on Thursday as investors digested the latest round of earnings. Facebook (FB) ended lower by 1.8% even though it was up nicely in the after hours. That just reiterates the importance of waiting for the stock to start trading during normal hours before making any big decisions. Lots of people get caught up in the extended hours but there is a very little to no correlation between that and where the stock trades in the normal session.
A slew of stocks reported earnings after the close and earnings roulette continues (some gap up and some gap down). Stocks rallied on Friday after the jobs report came in stronger than expected. The Dow enjoyed its largest rally of the year and the Nasdaq closed at a fresh record high. The financials surged after Trump said he’s rolling back a lot of the Dodd-Frank regulation which has been seen as a big hindrance for the banks. The major indices ended higher for the week and remain very strong.
Market Outlook: Strong Action Continues
The market remains strong as the major indices trade just shy of their record highs. The bulls have a very strong fundamental backdrop of monetary and now fiscal policy. The ECB extended QE in December and will print another 2.4T to stimulate markets and the global economy. The U.S. Fed only raised rates once in 2016, by a quarter point to 0.50%, which, historically, is still very low. On the fiscal side, Trump’s pro-growth policies are received well. As always, keep your losses small and never argue with the tape.


