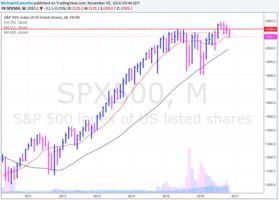
In a normal, non easy money world, we would say the market is tracing out a classic topping pattern and the days are numbered for this bull market. Last week we saw several major global central banks become “less dovish.” That doesn’t mean they won’t announce more easy money if markets fall, just right now, they are trying to move away from their ultra-easy money stance. For us, that is the “big” story that very few people are talking about and the primary reason why markets are falling, not the election.
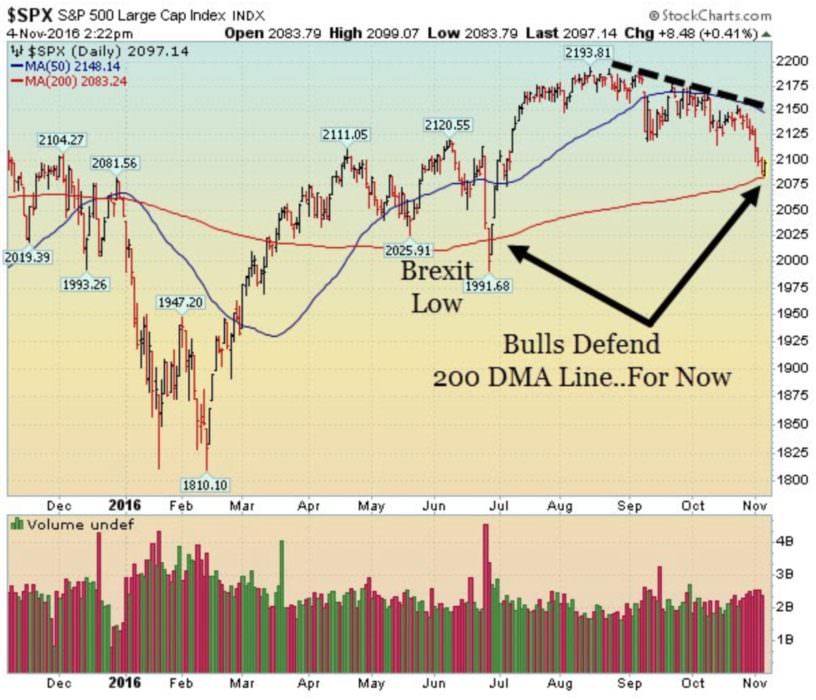
Here are the facts, stocks are getting weaker as we enter the final weekend before the election. This was the 9th consecutive week that the S&P 500 and Dow Jones Industrial average closed below their respective 50 DMA lines. The S&P 500 and the Russell 2000 are trying to bounce off their longer term 200 DMA lines – an area we highlighted for you in recent weeks as the next level of support to watch. In the short term, the market is very oversold and way overdue to bounce as we head into the election.
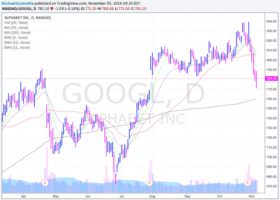
 There has been a lot of “damage” over the past few weeks as several important leaders broke down after reporting earnings. Most notably: Facebook ($FB), Amazon ($AMZN), Google (GOOGL) and Alibaba ($BABA) are now broken leaders as they all fell below important areas of support (50 DMA line) after reporting earnings. Google and Alibaba intially rallied after reporting numbers but sellers quickly showed up which illustrates how weak the market is right now. Additionally, the number of stocks in strong technical shape continues to dwindle which bodes poorly for the market.
We do want to note that, since February, whenever the market looks weak, the bullish pixie dust shows up and the major indices rip higher. Since Sep 9th, the bullish pixie dust has not been as strong. Additionally, more and more sectors are rolling over with leadership continuing to narrow. As we have been saying since early September, a strong defensive stance is paramount at this juncture.
A Closer Look at What Happened Last Week…
Mon-Wed Action:
Stocks were quiet on Monday which was the last trading day of October. All the major averages ended lower in October with the S&P 500 and Dow Jones Industrial Average experiencing their third straight monthly decline. News was relatively quiet as investors continued to digest the latest round of mixed earnings data and continued watching the ongoing drama around the election. Since Friday’s FBI announcement, Clinton’s lead over Trump narrowed significantly as the election season enters its final week. Baker Hughes (BHI) merged with General Electric (GE) and October was the biggest M&A month on record. According to the latest data, around $337 billion in M&A news was announced, easily surpassing the previous high of $282.2 billion from January 2000. Companies are rushing to close deals before the Fed raises rates. Elsewhere, crude oil fell over 3% after rumors spread over the weekend that OPEC will not reach a deal to cut production at its November meeting.
 Stocks fell on Tuesday causing the S&P 500 to slice below major support (Sep’s low of 2119 & Oct’s low of 2114). It also briefly broke below the psychologically important 2,100 level before buyers showed up in the afternoon. There is a lot of technical damage in the major indices. Over night, three major central banks (Japan, Australia and Canada) concluded their latest meetings without announcing more easy money. The “less dovish” stance worried some investors especially as the Fed wants to tighten in the near future. Economic data was mixed. The Markit manufacturing PMI came in at 53.4, above September’s number of 51.5. Meanwhile, the ISM manufacturing index matched expectations at 51.9, while construction spending data for September missed estimates.
Stocks opened lower on Wednesday after the latest round of mostly disappointing earnings and economic data was announced. A handful of well-known stocks gapped down after reporting earnings which is not good for the market. FLT, PXD, ADPT, PAYC, DXCM, CERN, DATA, ZEN, PLT, MTCH, & HLF were some of the stocks to fall on earnings. Alibaba (BABA) opened higher but quickly turned lower which is not a healthy sign for the market or leading stocks. Economic news was less than stellar. ADP, the country’s largest private payrolls company, said the U.S. economy only created 147,000 new jobs last month, missing estimates for 170,000. The Fed held rates steady for the 7th straight time and said the case was getting stronger for rate hike in December. Elsewhere, oil prices plunged after inventory levels jumped to the highest level in its 34 year history.
Thur & Fri Action:
 Stocks opened higher but quickly gave up the gains and spent most of the day near unchanged as sellers remained in control. Overnight, two major central banks moved away from an ultra-easy money stance. The Bank of England and China’s Central Bank both said they will not do more to stimulate markets right now. Instead, China’s Central Bank said it wants to take measure to cut the froth out of the system. In the U.S., economic data was mixed. initial jobless claims rose to 265,000, weaker than the Street’s 258,000 estimate. Elsewhere, third-quarter productivity increased by 3.1%, well above the expected rise of 2%. The ISM non-manufacturing index missed estimates last month while factory orders rose for a third straight month and topped estimates. Earnings reactions continued to awful: Facebook ($FB), FitBit ($FIT), Shopify (SHOP), Godaddy (GDDY) were among some of the big losers on Thursday. Charter communications (CHTR) gapped up at the open but immediately sold off and closed lower. Before Friday’s open, the Labor Department said U.S. employers added 161k new jobs, missing estimates for 175k. The S&P 500 and Russell 2000 tried to bounce off their longer term 200 DMA lines.
Market Outlook: Tape Is Getting Weaker
The tape remains continues to deteriorate. The fundamental driver continues to be easy money from global central banks but the law of diminishing returns may be setting in. Additionally, several big central banks are becoming “less dovish” which may bode poorly for stocks. Economic and earnings data remain mixed at best which means easy money is here to stay. As always, keep your losses small and never argue with the tape.


