 There are only 3 ways a market can move: up, down, or sideways.
Trending Markets Move Up & Down
Uptrends are known as bull markets. In the simplest sense uptrends occur when markets are moving up. The definition, of an uptrend varies depending on your time frame.
- A day trader tends to look at short intra-day time frames (10 min, 30min, 60 min etc).
- Swing traders (a.k.a. intermediate term traders) tend to look at daily or weekly charts.
- Long-term traders look at monthly, quarterly or annual charts.
The beauty about Wall Street is that you are free to look at any time frame you want. The key is to find something that works for you and learn how the market reacts in that time-frame.
Sideways: Trading Ranges
Markets do not go straight up or down. They spend a lot of time moving sideways within uptrends and downtrends. The sideways action is important to understand because that is the market’s way of “setting” up for the next move (up or down). When a market moves sideways it is also known as a trading range (or base). Trading ranges are very common in the market and happen all the time. Moreover, they come in all different shapes and sizes. Once you learn how to identify trading ranges it gives you a huge edge on your competition because most people spend time analyzing a company’s sales and earnings but not how the stock actually trades.
Support and Resistance:
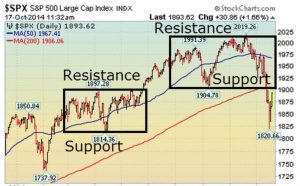
 During these sideways moves, markets form two key areas: support and resistance. Support is known as the bottom of the trading range, while resistance is the top of the trading range. These areas are important because once resistance is broken a new uptrend forms and ideally the bulls want to see resistance become support. Conversely, once support is broken, a new downtrend forms, and the bears want to see support become resistance. As with any “rule” there are exceptions but the broader concept happens more often than not and is important for you to understand.
Putting This In Action:
So how does this apply in real-time? Let’s take a look at the historical chart above. Here the S&P 500 sliced below support (1904-1905 area) of its large top pattern. The bears wanted to see support become resistance and a new trading range develop below the old one. So as long as the S&P 500 continued trading below 1905, by definition, a new downtrend emerged and the path of least resistance was lower.


