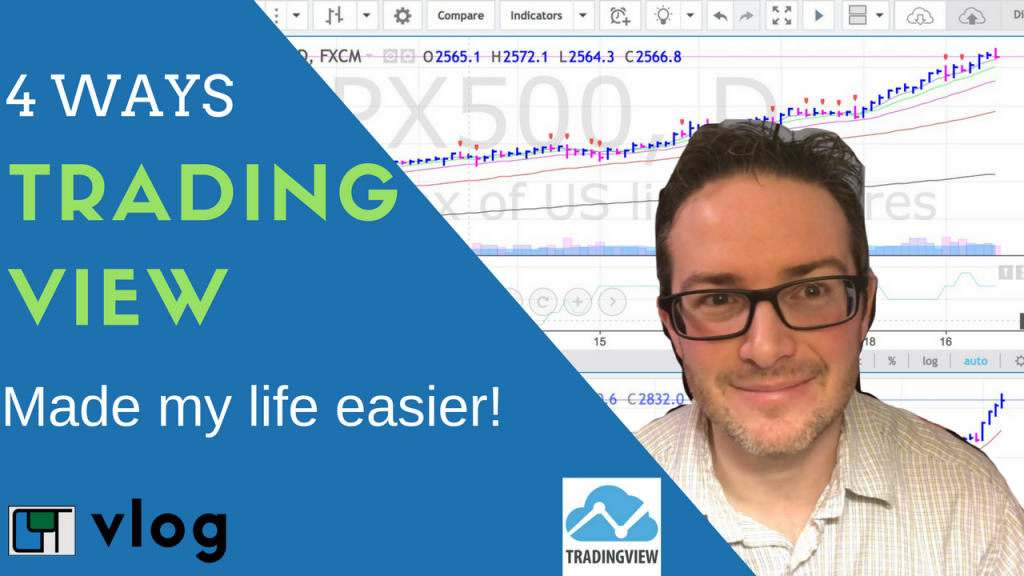
If you’ve watched any of my recent YouTube videos, you’ve likely seen TRADING VIEW.
TRADING VIEW is the charting service I use. I like them for a LOT of reasons. In this Trading View Review, I’m going to share what I love about them, where it’s lacking and how I’ve dealt with it, and some key features to help you automate within the platform if you have it.
Top 3 things I LOVE about Trading View
1. EASE OF USE
It is very easy to annotate charts, view multiple time frames, journal, build watch lists, and publish to social channels. Check out the video above. I spend a few minutes on how I do each of these.
2. IT’S CHEAP:
A Pro Membership only costs $9.99/month! Before I found Trading View, I was paying about $150/month for charts and scanning software. Now, Trading View does have a scanning component but it’s not something that I’ve found very useful. I now use ChartYourTrade MRI to quickly scan for high-quality growth stocks. You can read all about the various ways I scan for stocks, the parameters I set, some ways to do it for FREE or if you want to save time and spend just a little, some resources you can use. Click here to read “How to Scan for the Best Growth Stocks.”
3. AUTOMATION:
They allow users to write what they call “Pine Scripts”. You can basically create any indicator you can dream up and add it to your charts! This is perhaps the BIGGEST REASON why I LOVE Trading View. One of the things I would do manually in that really expensive charting service I mentioned earlier was flag distribution days on the indexes. So I would go
One of the things I would do manually in that other really expensive charting service I used to have was flag distribution days on the indexes. So I would go into each index, calculate if a distribution day had occurred, get the clunky annotation tool, and flag the day. I’d do this on the S&P 500, NASDAQ, and NYSE… doing this every week would really only take 5 or 10 minutes… BUT IT ADDS UP! 20-40minutes per month…I can think of better ways to spend that time.
Trading View is able to BOTH automatically flag distribution days AND keep a tally of the distribution days over a set period! In keeping within the CANSLIM trading methodology, I’ve set mine up to 25 days. The great thing about Trading View, you can get these codes and do whatever you want with them! The customization is incredible!
CLICK HERE TO GET TRADING VIEW NOW
HERE ARE MY 4 FAVORITE AUTOMATIONS (and the codes I use for them)
Just copy/paste the entire code into the “pine editor” and save them. Follow the steps I use in the video…
1. RELATIVE STRENGTH (vs the S&P 500)
study(“Relative Strength”, shorttitle=”RS”)
a = tickerid
b = input(“SPX500”, type=symbol)
as = security(a, period, close)
bs = security(b, period, close)
plot(as/bs, title=”Relative Strength”, color=gray)
len = input(30)
plot(sma(as/bs, len), color=navy)
2. DISTRIBUTION DAYS
//@version=2
study(“Distribution Days”, overlay=true)
is_down_bar = change(close) < -0.02 ? true : false
is_volume_up = change(volume) > 0 ? true : false
is_distribution = is_down_bar and is_volume_up ? true : false
plotshape(series=is_distribution)
3. DISTRIBUTION DAY COUNT
study(‘Distribution Day Count’ )
is_down_bar = change(close) < -.2 ? true : false
is_volume_up = change(volume) > 0 ? true : false
is_distribution = is_down_bar and is_volume_up ? true : false
sum = sum(is_distribution, 25)
plot(sum)
4. NEW HIGHS vs NEW LOWS on NYSE
study(“[RS]jangseohee NYSE – NHNL Indicator V0”)
timeperiod = input(“D”)
NH = security(“HIGN”, timeperiod, close)
NL = security(“LOWN”, timeperiod, close)
plot(NH, color=green, style=columns)
plot(-NL, color=maroon, style=columns)
showvectorchannel1 = input(true)
showvectorchannel2 = input(false)
showvectorchannel3 = input(false)
showvectorchannel4 = input(false)
showvectorchannel5 = input(false)
topvc1 = NH[2] < NH[1] and NH[1] > NH[0]
botvc1 = NL[2] < NL[1] and NL[1] > NL[0]
topv1 = topvc1 ? NH[1] : na
botv1 = botvc1 ? -NL[1] : na
plot(showvectorchannel1 ? topv1 : na, color=silver, offset=-1)
plot(showvectorchannel1 ? botv1 : na, color=silver, offset=-1)
topvc2 = topvc1 and valuewhen(topvc1, topv1, 1) < topv1
botvc2 = botvc1 and valuewhen(botvc1, botv1, 1) > botv1
topv2 = topvc2 ? NH[1] : na
botv2 = botvc2 ? -NL[1] : na
plot(showvectorchannel2 ? topv2 : na, color=gray, offset=-1)
plot(showvectorchannel2 ? botv2 : na, color=gray, offset=-1)
topvc3 = topvc2 and valuewhen(topvc2, topv2, 1) < topv1
botvc3 = botvc2 and valuewhen(botvc2, botv2, 1) > botv1
topv3 = topvc3 ? NH[1] : na
botv3 = botvc3 ? -NL[1] : na
plot(showvectorchannel3 ? topv3 : na, color=black, offset=-1)
plot(showvectorchannel3 ? botv3 : na, color=black, offset=-1)
topvc4 = topvc3 and valuewhen(topvc3, topv3, 1) < topv1
botvc4 = botvc3 and valuewhen(botvc3, botv3, 1) > botv1
topv4 = topvc4 ? NH[1] : na
botv4 = botvc4 ? -NL[1] : na
plot(showvectorchannel4 ? topv4 : na, color=black, offset=-1)
plot(showvectorchannel4 ? botv4 : na, color=black, offset=-1)
topvc5 = topvc4 and valuewhen(topvc4, topv4, 1) < topv1
botvc5 = botvc4 and valuewhen(botvc4, botv4, 1) > botv1
topv5 = topvc5 ? NH[1] : na
botv5 = botvc5 ? -NL[1] : na
plot(showvectorchannel5 ? topv5 : na, color=black, offset=-1)
plot(showvectorchannel5 ? botv5 : na, color=black, offset=-1)


